Patricia Adams is an economist and the executive director of Probe International, a Toronto based NGO that has been involved in the Chinese environmental movement since its beginnings in the mid-1980s.
She is confirming much of what I have said in recent years. The only thing I would take issue with his her description of there being a U-Turn. In my view, China never had the slightest intention of being serious about cutting emissions.
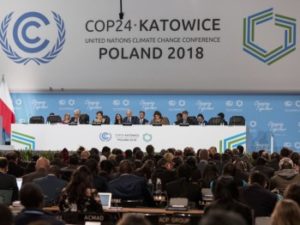
La conférence sur le climat de Katowice bat son plein et diverses initiatives visant à réduire les émissions de dioxyde de carbone sont à l’ordre du jour : manger moins de viande, se chauffer moins, prendre moins l’avion. Dans ce dernier cas, bien sûr, la conférence confine elle-même à l’absurde.
Il aurait été facile de transformer la conférence en une réunion sur Internet avec retransmission en direct et commentaires en ligne. Mais il aurait manqué quelque chose à ce long et merveilleux voyage d’affaires avec ses réceptions, ses indemnités journalières et ses réunions d’avant Noël entre sauveteurs du climat. Cette fois-ci, plus de 22 000 participants se sont rendus en Pologne, la plupart confortablement en avion. Les délégations les plus nombreuses à la Conférence sur le climat venaient d’Afrique.
La Guinée envoie 406 délégués cette année, la République démocratique du Congo y est présente avec 237 participants et la Côte d’Ivoire envoie 191 ressortissants en Pologne. La liste des participants est disponible sur la page d’accueil de la conférence en format pdf et compte 1084 pages.
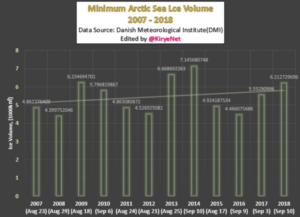
The media, alarmist scientists and many leading policymakers often tell the public “the Arctic is rapidly melting”. And if a poll were done today, a vast majority of the people in Japan and elsewhere would say this is true. Unfortunately they have become the victims of “fake news”.
Luckily we have some hard data from the Arctic. And if one looks at them, it is true that sea ice has seen a declining trend – if we go back 40 years.
Yet, if we look at the past 12 years, we see that the trend for minimum has stopped, and one could argue even reversed:
“The results of this review point to the extreme value of CO2 to all life forms, but no role of CO2 in any significant change of the Earth’s climate. … Many believe and/or support the notion that the Earth’s atmosphere is a ‘greenhouse’ with CO2 as the primary “greenhouse” gas warming Earth. That this concept seems acceptable is understandable—the modern heating of the Earth’s atmosphere began at the end of the Little Ice Age in 1850. The industrial revolution took hold about the same time. It would be natural to believe that these two events could be the reason for the rise in temperature. There is now a much clearer picture of an alternative reason for why the Earth’s surface temperature has risen since 1850.”
“There is no correlation of CO2 with temperature in any historical data set that was reviewed”.
Last year’s oceanic heat wave wasn’t as destructive as one the year before, scientists said.
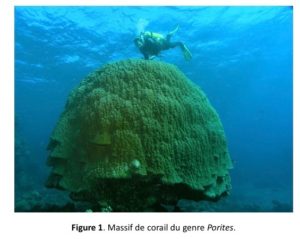
The Great Barrier Reef fared better during an oceanic heat wave last year than during sizzling weather a year earlier that caused hundreds of miles of corals to bleach, according to a study published Monday that suggests the massive structure may be growing more tolerant to climate change.
The report in the journal Nature Climate Change analyzed how corals along the Great Barrier fared in back-to-back mass bleaching events. The reef ― a UNESCO World Heritage Site and the largest living structure on the planet ― was cooked by overheated seawater in 2016 and again in 2017, with images of sickly white coral horrifying people around the globe.
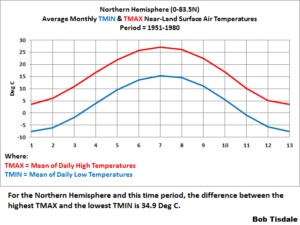
In this post, we’re going to present monthly TMIN and TMAX Near-Land Surface Air Temperature data for the Northern and Southern Hemispheres (not in anomaly form) in an effort to add a little perspective to global warming. And at the end of this post, I’m asking for your assistance in preparing a post especially for you, the visitors to this wonderful blog WattsUpWithThat.
INTRODUCTION FOR THE “GLOBAL WARMING IN PERSPECTIVE” SERIES
A small group of international unelected bureaucrats who serve the United Nations now wants to limit the rise of global land+ocean surface temperatures to no more 1.5 deg C from pre-industrial times…even though we’ve already seen about 1.0 deg C of global warming since then. So we’re going to put that 1.0 deg C change in global surface temperatures in perspective by examining the ranges of surface temperatures “we’ve been used to” on our lovely shared home Earth.
Le système d’échange de quotas d’émission de l’UE,connu sous l’acronyme SEQE-EU ou en anglais EU ETS, est instrument utilisé pour réduire les émissions de Gaz à Effet de Serre (GES) ou de CO2 pour faire court. Il repose sur un principe de plafonnement et d’échange des droits d’émission. Il a été adopté par la Commission Environnement du Parlement européen, le 13 octobre 2003.
The “amazing” thing is that this isn’t a “new” oil discovery. It’s just a realization that a lot more oil and gas can be produced from these formations than was previously imagined.
The Permian Basin a nearly infinite resource. It seems as if there will always be more hydrocarbons to squeeze out of its numerous oil & gas reservoirs. From a Warmunist perspective the Bone Spring and Wolfcamp are much worse than previously thought…
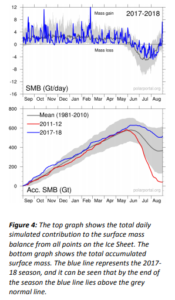
The Danish Meteorological Institute (DMI) also performs daily simulations of how much ice or water the Ice Sheet loses or accumulates. Based on these simulations, an overall assessment of how the surface mass balance develops across the entire Ice Sheet is obtained (Fig. 4).
At the end of the 2018 season (31 August 2018), the net surface mass balance was 517 Gt, which means that 517 Gt more snow fell than the quantity of snow and ice that melted and ran out into the sea. This number only contains the balance at the surface, and thus not the total balance, which also includes melting of glaciers and calving of icebergs.
…
Although the total SMB (Surface Mass Budget) for the 2016-2017 and 2017-2018 seasons are similar, development during the two seasons has been very different. Last year, the season began by gaining a lot of mass during the winter, whilst the development in SMB from the summer onwards reflected the long-term average. During the 2017-2018 season, SMB remained in line with the average from 1981-2010 until the summer, after which the development in SMB was higher than average.
For the past 50 years, scientists have been studying climate change and the possibility of related sea level changes resulting from melting ice and warming oceans. Despite the common belief that increasing levels of carbon dioxide (CO2) in our atmosphere could result in catastrophic sea level rise, there is no evidence to support this fear. Tax monies spent trying to solve this non-existent problem are a complete waste.
The polar regions of the Earth have long been depicted as canary-in-the-coal-mine sentinels of climate change, given that climate models project that CO2-induced global warming will manifest itself here, first and foremost, compared to other planetary latitudes. Consequently, researchers are frequently examining the Arctic and Antarctic for evidence of recent climate change.
…
Clearly, as demonstrated here and in other studies (see, for example, The Antarctic Peninsula: No Longer the Canary in the Coal Mine for Climate Alarmists and the references therein) there is a canary in the Antarctic alright, but it is alive and well. And these counter-observations do not bode well for climate models and their projections of CO2-induced global warming.
Figure 1. Surface mass-balance records for glaciers around the northern Antarctic Peninsula. Source: Engel et al. (2018).
Judith Curry, one of climate science’s most vocal critics, is leaving academe because of what she calls the poisonous nature of the scientific discussion around human-caused global warming.
Global carbon dioxide emissions will likely hit record highs this year, according to a new report released Wednesday as United Nations diplomats meet in Poland to hash out details of the Paris climate accord.
Global emissions will rise roughly 3 percent to 37.1 gigatons in 2018, according to the Global Carbon Project (GCP).
The rise in emissions was largely fueled by an uptick in coal-fired power generation in China and India.
“Emissions in China, India, and the US are expected to increase in 2018, while emissions in the [European Union] are expected to decline, and all other countries combined will most likely increase,” reads the report by GCP, which tracks emissions.
The first International Polar Year, held over 1882–1883, was an important event for science. The year was the brainchild of Austrian explorer Karl Weyprecht who, after a few years on different research missions, realised that scientists were missing the big picture by not sharing information with each other.
In 1875, at the annual meeting of German Scientists and Physicians in Graz, Austria, he proposed the setting up of an observational network of research stations to monitor the Arctic climate. It was the beginning of collaborative research in the region. Today, data collected 134 years ago on temperature, air pressure, or wind speed is still freely available.
There have been two more International Polar Year events since that inaugural one, most recently in 2007–2008, along with numerous other collaborative expeditions and research missions aimed at understanding aspects of Arctic biology, ecology, climate or geology.
by David Wojic, December 5, 2018 in ClimateChangeDispatch
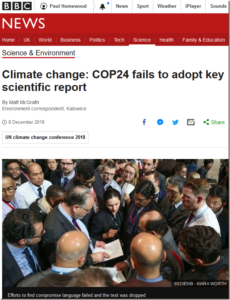
The mainstream press coverage of the beginning of the Katowice climate summit is sad but fascinating.
There is a uniformly dogmatic sense of urgency based on fear, with very little news and a great deal of preaching.
Fear is the dominant theme.
I truly pity the people who hold these false beliefs, as they must be afraid of the future. But I am not sympathetic with the alarmism, because it makes people dangerous.
The preachers are calling on the faithful to change the world we live in, and not in a good way. Fear makes people angry and angry people are dangerous.
Here are just three examples of alarmist news coverage of the Katowice climate summit, a few among many.
New Mexico contains hundreds of historic uranium mines. Although active uranium mining in the state has ceased, rates of cardiovascular and metabolic disease remain high in the population residing close to mines within the Navajo Nation. According to a new study in ACS’ journal Environmental Science & Technology Letters, inhaled uranium in dusts from the mines could be a factor.
Volcanoes are not fed by molten magma formed in large chambers finds a new study, overturning classic ideas about volcanic eruptions.
Instead, the study suggests that volcanoes are fed by so-called ‘mush reservoirs’ — areas of mostly solid crystals with magma in the small spaces between the crystals.
Our understanding of volcanic processes, including those leading to the largest eruptions, has been based on magma being stored in liquid-filled ‘magma’ chambers — large, underground caves full of liquid magma. However, these have never been observed.
The new study, by researchers at Imperial College London and the University of Bristol and published today in Nature, suggests the fundamental assumption of a magma chamber needs a re-think.
by J.C. Maurin, 2 décembre 2018 in ScienceClimatEnergie
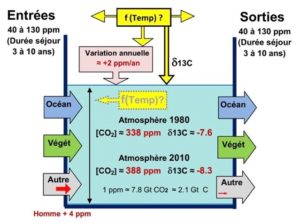
Au XVIe siècle, dans une ultime tentative pour sauver le système de Ptolémée, on se résigna enfin à admettre la rotation des planètes autour du Soleil mais on conserva le dogme de la position centrale de la Terre par rapport au Soleil. Le dernier pas vers l’héliocentrisme dut finalement être franchi, à regret. Au XXIesiècle, Le GIEC adapte discrètement son Almageste : on lit dans la version de novembre 2018 du Résumé à l’intention des décideurs dès la première page, 1er encadré de l’introduction → “L’augmentation mondiale de la concentration en dioxyde de carbone est essentiellement due à l’utilisation des combustibles fossiles et aux changements d’affectation des terres”. Fin de cette première page → « La source principale de l’augmentation de la concentration du dioxyde de carbone dans l’atmosphère depuis l’époque préindustrielle provient de l’utilisation des combustibles fossiles ». La certitude absolue, naguère affichée, d’une origine 100% anthropique dans la hausse du CO2atmosphérique disparaît donc. Un modèle mixte est désormais implicitement admis. A cinq siècles de distance, le dernier pas reste toujours difficile à franchir. Le présent article aide à trouver le chemin de Damas.
Figure 1. Rappels des observations (1/4) et corrélations (2/4)
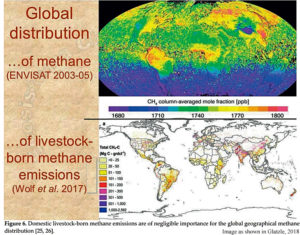
by Kenneth Richard, December 3, 2018 in NoTricksZone
Agrobiologist and scientific researcher Dr. Albrecht Glatzle, author of over 100 scientific papers and two textbooks, has published research that shows “there is no scientific evidence, whatsoever, that domestic livestock could represent a risk for the Earth’s climate” and that the “warming potential of anthropogenic GHG [greenhouse gas] emissions has been exaggerated”.
More than two miles below the ocean’s surface, microbes, worms, fishes, and other creatures great and small thrive. They rely on the transport of dead and decaying matter from the surface (marine snow) for food at these dark depths.
Up near the sea surface, carbon dioxide from the atmosphere is incorporated in the bodies of microscopic algae and the animals that eat them. When they die, these organisms sink to the depths, carrying carbon with them.
This supply of carbon to the deep sea isn’t steady. At times, months’ to years’ worth of marine snow falls to the abyss during very short “pulse” events.
In a new study published in the Proceedings of the National Academy of Sciences (PNAS), MBARI scientists and their collaborators show that there has been an increase in pulse events off the coast of California. They also show that, although such episodes are very important to the carbon cycle, they are not well represented in global climate models.
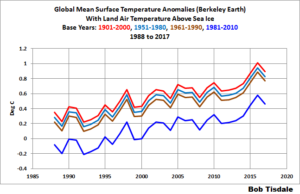
Most of us are familiar with the World Meteorological Organization (WMO)-recommended 30-year period for “normals”, which are also used as base years against which anomalies are calculated. Most, but not all, climate-related data are referenced to 30-year periods. Presently the “climatological standard normals” period is 1981-2010. These “climatological standard normals” are updated every ten years after we pass another year ending in a zero. That is, the next period for “climatological standard normals” will be 1991-2020, so the shift to new “climatological standard normals” will take place in a few years.
But were you aware that the WMO also has another recommended 30-year period for “normals”, against which anomalies are calculated? It’s used for the “reference standard normals” or “reference normals”. The WMO-recommended period for “reference normals” is 1961-1990. And as many of you know, of the primary suppliers of global mean surface temperature data, the base years of 1961-1990 are only used by the UKMO.
…
…
La géologie, une science plus que passionnante … et diverse