by Haley Zaremba, November 4, 2018 in OilPrice
…
China produces about two thirds of the whole world’s supply of lithium ion batteries, the most common battery type used in electric vehicles. Furthermore, these highly valuable batteries make up a staggering 40 percent of the cars’ value. As it stands, Europe is far from being able to compete with China when it comes to the production of lithium ion batteries. In fact, currently the entire continent is estimated to hold just 1 percent of the market.
…

by Susann Twidale, November 2, 2018 in Reuters
LONDON (Reuters) – Cuadrilla extracted its first shale gas from its site in northwest England, it said on Friday, after it began fracking operations there just over two weeks ago.
Cuadrilla said the gas flows were small but coming at such an early stage of the project were evidence of the potential of the site.
“This is a good early indication of the gas potential that we have long talked about,” Cuadrilla Chief Executive Francis Egan said in an emailed statement.
…
by R. Mottram et al. (DMI), October 27, 2018 in ScienceNordic
The end of August traditionally marks the end of the melt season for the Greenland ice sheet as it shifts from mostly melting to mostly gaining snow.
As usual, this is the time when the scientists at DMI and our partners in the Polar Portal assess the state of the ice sheet after a year of snowfall and ice melt. Using daily output from a weather forecasting model combined with a model that calculates melt of snow and ice, we calculate the “surface mass budget” (SMB) of the ice sheet.
This budget takes into account the balance between snow that is added to the ice sheet and melting snow and glacier ice that runs off into the ocean. The ice sheet also loses ice by the breaking off, or “calving”, of icebergs from its edge, but that is not included in this type of budget. As a result, the SMB will always be positive – that is, the ice sheet gains more snow than the ice it loses.
For this year, we calculated a total SMB of 517bn tonnes, which is almost 150bn tonnes above the average for 1981-2010, ranking just behind the 2016-17 season as sixth highest on record.
By contrast, the lowest SMB in the record was 2011-2012 with just 38bn tonnes, which shows how variable SMB can be from one year to another.
…
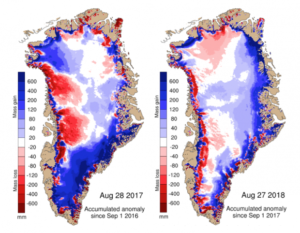
Maps show the difference between the annual SMB in 2017 (left) and 2018 (right) compared with the 1981-2010 period (in mm of ice melt). Blue shows more ice gain than average and red shows more ice loss than average. (Credit: DMI Polar Portal)
by J.R. Christy et al., March 8, 2018 in InternJournRemoteSensing
The Intergovernmental Panel on Climate Change Assessment Report 5 (IPCC AR5, 2013) discussed bulk atmospheric temperatures as indicators of climate variability and change. We examine four satellite datasets producing bulk tropospheric temperatures, based on microwave sounding units (MSUs), all updated since IPCC AR5. All datasets produce high correlations of anomalies versus independent observations from radiosondes (balloons), but differ somewhat in the metric of most interest, the linear trend beginning in 1979. The trend is an indicator of the response of the climate system to rising greenhouse gas concentrations and other forcings, and so is critical to understanding the climate. The satellite results indicate a range of near-global (+0.07 to +0.13°C decade−1) and tropical (+0.08 to +0.17°C decade−1) trends (1979–2016), and suggestions are presented to account for these differences. We show evidence that MSUs on National Oceanic and Atmospheric Administration’s satellites (NOAA-12 and −14, 1990–2001+) contain spurious warming, especially noticeable in three of the four satellite datasets.
Comparisons with radiosonde datasets independently adjusted for inhomogeneities and Reanalyses suggest the actual tropical (20°S-20°N) trend is +0.10 ± 0.03°C decade−1. This tropical result is over a factor of two less than the trend projected from the average of the IPCC climate model simulations for this same period (+0.27°C decade−1).
…
by Prof. Paul Berth, 4 novembre 2018 in ScienceClimatEnergie
Le 30 octobre 2018 sortait le dernier rapport du WWF[1] concernant l’état de la biodiversité (voir ici). Les données obtenues sont très préoccupantes. De nombreux médias ont bien entendu présenté ce rapport de façon très alarmiste en exagérant certains points. Le but du présent article est de remettre les pendules à l’heure, en démêlant le vrai du faux et en présentant certaines incertitudes.
1. Que dit exactement le rapport du WWF? Le rapport du WWF nous dit que globalement, entre 1970 et 2014, l’index LPI (Living Planet Index) a chuté de 60% (Figure 1). Il n’est pas question ici de mettre en doute les résultats obtenus par le WWF mais simplement de les mettre en perspective. L’index LPI est calculé en tenant compte du nombre d’individus pour plusieurs espèces. Au total, ce sont 4 005 espèces qui ont été considérées, réparties en 16 704 populations (il peut donc y avoir plusieurs populations pour une même espèce). Ces populations proviennent de tous les continents. Pour toutes les espèces prises en compte le nombre d’individus a été estimé, puis des sommes ont été établies.
…
La géologie, une science plus que passionnante … et diverse
