by M. Bastasch, November 14, 2018 in WUWT/DailyCaller
-
Scientists behind a headline-grabbing climate study admitted they “really muffed” their paper.
-
Their study claimed to find 60 percent more warming in the oceans, but that was based on math errors.
-
The errors were initially spotted by scientist Nic Lewis, who called them “serious (but surely inadvertent) errors.”
The scientists behind a headline-grabbing global warming study did something that seems all too rare these days — they admitted to making mistakes and thanked the researcher, a global warming skeptic, who pointed them out.
“When we were confronted with his insight it became immediately clear there was an issue there,” study co-author Ralph Keeling told The San Diego Union-Tribune on Tuesday.
Their study, published in October, used a new method of measuring ocean heat uptake and found the oceans had absorbed 60 more heat than previously thought. Many news outlets relayed the findings, but independent scientist Nic Lewis quickly found problems with the study.
Keeling, a scientist at the Scripps Institution of Oceanography, owned up to the mistake and thanked Lewis for finding it. Keeling and his co-authors submitted a correction to the journal Nature. (RELATED: Headline-Grabbing Global Warming Study Suffers From A Major Math Error)…
by Nick Stokes, November 14, 2018 in WUWT
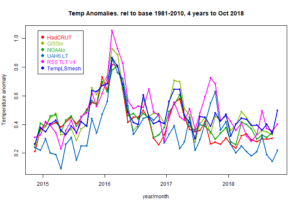
There is much criticism here of the estimates of global surface temperature anomaly provided by the majors – GISS, NOAA and HADCRUT. I try to answer these specifically, but also point out that the source data is readily available, and it is not too difficult to do your own calculation. I point out that I do this monthly, and have done for about eight years. My latest, for October, is here (it got warmer).
Last time CharlesTM was kind enough to suggest that I submit a post, I described how Australian data made its way, visible at all stages, from the 30-minute readings (reported with about 5 min delay) to the collection point as a CLIMAT form, from where it goes unchanged into GHCN unadjusted (qcu). You can see the world’s CLIMAT forms here; countries vary as to how they report the intermediate steps, but almost all the data comes from AWS, and is reported at the time soon after recording. So GHCN unadjusted, which is one of the data sources I use, can be verified. The other, ERSST v5, is not so easy, but there is a lot of its provenance available.
My calculation is based on GHCN unadjusted. That isn’t because I think the adjustments are unjustified, but rather because I find adjustment makes little difference, and I think it is useful to show that.
I’ll describe the methods and results, but firstly I should address that much-argued question of why use anomalies.
…
La géologie, une science plus que passionnante … et diverse
