by Paul Dorian, November 5, 2018 in PerspectaWeather
Overview
The sun is blank again today and has been without sunspots about 60% of the time this year as the current historically weak solar cycle heads towards the next solar minimum. Solar cycle 24 is currently on pace to be the weakest sunspot cycle with the fewest sunspots since cycle 14 peaked in February 1906. Solar cycle 24 continues a recent trend of weakening solar cycles which began with solar cycle 21 that peaked around 1980. The last time the sun was this blank in a given year on a percentage basis was 2009 during the last solar minimum when 71% of the time was spotless. That last solar minimum actually reached a nadir in 2008 when an astounding 73% of the year featured a spotless sun – the most spotless days in a given year since 1913. All indications are that the fast-approaching next solar minimum may be even quieter than the last one which was the deepest in nearly a century.
One of the natural consequences of a solar minimum is for the upper part of the Earth’s atmosphere to cool down. Another natural impact of decreasing solar activity is the weakening of the ambient solar wind and its magnetic field which, in turn, allows more cosmic rays to penetrate the solar system. The intensification of cosmic rays can have important consequences on such things as the safety of airline passengers and astronauts in space, Earth’s cloud cover and climate, and possibly even on lightning.
…
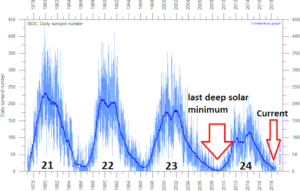
Daily observations of the number of sunspots since 1 January 1977 according to Solar Influences Data Analysis Center (SIDC). The thin blue line indicates the daily sunspot number, while the dark blue line indicates the running annual average. The recent low sunspot activity is clearly reflected in the recent low values for the total solar irradiance. Compare also with the geomagnetic Ap-index. Data source: WDC-SILSO, Royal Observatory of Belgium, Brussels. Last day shown: 31 October 2018. Last diagram update: 1 November 2018.
by O. Humlum et al., 2013 in Global&PlanetaryChange
Highlights
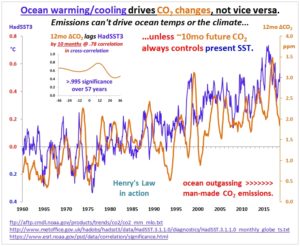
► Changes in global atmospheric CO2 are lagging 11–12 months behind changes in global sea surface temperature. ► Changes in global atmospheric CO2 are lagging 9.5–10 months behind changes in global air surface temperature. ► Changes in global atmospheric CO2 are lagging about 9 months behind changes in global lower troposphere temperature. ► Changes in ocean temperatures explain a substantial part of the observed changes in atmospheric CO2 since January 1980. ► Changes in atmospheric CO2 are not tracking changes in human emissions.
…
Also this graph
by Bob Tisdale, November 5, 2018 in WUWT
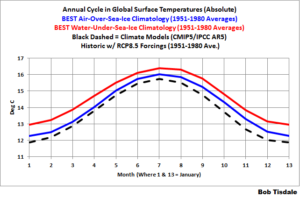
Alternate Title: The Annual Cycle in Global Land+Ocean Surface Temperature IS Far Greater Than 1.5 Deg C, AND Much-Much-MUCH Greater Than 1.5 Deg C Annually for Global Land Air Surface Temperatures
We all were taught early in school that the Earth orbits the Sun…that its path is elliptical…that because of the tilt in Earth’s axis of rotation, we have seasons as the Earth orbits our star annually. Because of the elliptical orbit, and because the ratios of land to ocean are different between the Northern and Southern Hemispheres, we might expect that global average surface temperatures would vary over the course of a year.
Later in life we’ve been brow beaten with alarmism about human-induced global warming and climate change…that the Earth will become a literal—not figurative—hell if global surface temperatures rise—formerly 2-deg C—now 1.5 deg C above pre-industrial levels. But does the average person know much global surface temperatures vary annually as it orbits the Sun? It’s unlikely, because I’ve never before seen graphs that are similar to what’s presented in this post or seen it discussed in any of the global warming literature. Am I expecting most persons to find this information to be of any interest? Nope. I simply find it noteworthy that, as I mentioned before, I’ve never seen it presented anywhere. In fact, I just Googled, in quotes, “How Much Do Global Surface Temperatures Cycle Annually?” and Google replied (their boldface), “No results found for “How Much Do Global Surface Temperatures Cycle Annually?”.
Remarkable, is it not, in these times of global warming interest?
Enough with the preamble and on to the meat of the post:
…
…
La géologie, une science plus que passionnante … et diverse
