by Coles et al., November, 11, 2018 in CO2Science
…
In light of the above findings, Coles et al. state the obvious, that the corals “were able to withstand elevated temperatures (31.4 °C) for a longer period of time in the current 2017 experiment” compared to the 1970 study. Consequently, they conclude that their results “indicate a shift in the temperature threshold tolerance of these corals to a 31-day exposure to 31.4 °C,” which findings “provide the first evidence of coral acclimatization or adaptation to increasing ocean temperatures.” And that observational reality should hold great bearing on the status and health of coral reefs in response to future climate change. If temperatures rise in the future, clearly, as living organisms, corals can (and do!) adapt. Alarmist predictions of their fast and ensuing demise due to global warming should not be taken too seriously.
by J.C. Maurin, 12 novembre 2018 in ScienceClimatEnergie
L’IPCC (GIEC en français) fut créé en 1988 par l’UNEP (United Nations Environment Programme) et le WMO (World Meteorological Organization). Dans les principes régissant les travaux du GIEC (1) on lit : Le GIEC a pour mission d’évaluer … les risques liés au changement climatique d’origine humaine. Le GIEC respecte son propre principe fondateur : il attribue l’intégralité de la hausse du taux de CO2 depuis 1958 à une cause anthropique. Nous examinerons ici le modèle anthropique du GIEC et nous le confronterons aux mesures contemporaines, puis à un modèle mixte. Cet article fait suite aux deux précédents publiés sur le site SCE au cours des mois de septembre (1/4) et octobre 2018 (2/4).
…
C.4. Conclusions
-
Un modèle qui décrit un monde fixe, en équilibre, un modèle où l’homme est central, un modèle qui parvient à reproduire certaines observations mais pas toutes, un modèle unanimement soutenu par les autorités politiques ou morales, enfin un modèle qui pose a priori un principe intangible… est le type même de modèle qui fut développé par Ptolémée (6) pour le système solaire. Ce modèle fut jadis l’objet d’un consensus à > 97%.
-
L’atmosphère actuelle comporte environ 20 ppm de CO2 anthropique correspondant à 20/400 soit ≈ 5% du CO2 atmosphérique. En un siècle les hommes ont donc modifié la composition de l’atmosphère de 20 ppm soit 0,002% : sur ce sujet également, il semble que nous ne soyons pas au centre du monde.
-
Les évolutions récentes du CO2 atmosphérique ne peuvent pas avoir une cause uniquement anthropique: les observations du δ13C l’interdisent. Les causes sont anthropiques et naturelles. Le modèle purement anthropique du GIEC est donc à rejeter.
by University of Barcelona, November 9, 2018 in ScienceDaily
Regional differences regarding other reconstructions
The results of the study show a temperature rise in the beginning of the Holocene, reaching the highest values in the Holocene Climate Optimum (about 7,800 years ago). There are also high temperatures until about 6,000 years ago, when a decline of temperature started and led to the lowest values in the first stage of the late Holocene (about 4,200 and 2,000 years ago).
Last, researchers detected a rise of temperatures over the two last millenniums, but they state they have to be careful with these data. “We cannot guarantee the observed rise in the reconstruction results from a temperature rise only, we cannot rule out other variables that can influence at other levels, such as the gradual increase of the anthropic activity in the area, which can change the community of Chironomidae to species that adapt to higher temperatures, but there are also human influence indicators,” says Narcís Prat.
Although these conclusions can coincide with other paleoclimate reconstructions, results also highlight some divergences at a regional level. “These differences can occur due the fact that some indicators point out to different seasonal signs. Therefore, Chironomidae are indicators of temperature in summer, while others such as chrysophites or alkenones are related to winter/spring temperatures,” notes the researcher.
A tool to evaluate climate trends
…
by H. Pettit, November 9, 2018 in MailOnline
-
Images reveal a timeline of the ancient landmasses buried beneath Antarctica
-
They were taken by the long-dead Gravity field and Ocean Circulation Explorer
-
The ESA satellite collected data on Earth’s gravitational pull
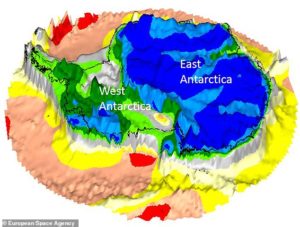
- The study revealed that West Antarctica (green) has a thinner crust than East Antarctica (blue), which has a ‘family likeness to Australia and India’
by P. Homewood, November 9, 2018 in NotaLotofPeopleKnowThat
What are the environmental impacts?
Generally the environmental impact of geothermal developments is extremely low. There are virtually no emissions and land use and visual impact are small. However, some potential impacts do need to be considered and information on each of these issues is set out in the sections below.
All these issues will be fully considered as part of the planning process. Cornwall Council has worked with the industry to develop robust Supplementary Planning Guidance to ensure risks are mitigated and minimised. In addition to planning permission, projects must also obtain the necessary licenses from the Environment Agency.
What is the risk of earth tremors (induced seismicity)?
…
by Liam Denning, November 1, 2018 in BloomberOpinion
The contrast between the success of the U.S. oil and gas industry and unpopularity in the stock market grows ever starker.
The Energy Information Administration released revised monthly figures for U.S. oil production on Thursday. The headline is that production is up — way, way up. It reached 11.35 million barrels a day in August, fully 2.1 million barrels a day higher than a year before. That’s almost like adding a whole new Mexico in the space of 12 months.
…
by Anthony Watts, November 7, 2018 in WUWT
A new study, based on 27 years of data from Mana Pools National Park in Zimbabwe, suggests that temperature increases over the last three decades have already caused major declines in local populations of tsetse flies.
This analysis, published in the journal PLOS Medicine this week, provides a first step in linking temperature to the risk of sleeping sickness in Africa.
…
My analysis
A model for fly population mortality is only as good as the temperature data used to run the model. It appears they only used one source of temperature data, the only one available to them, the Rekomitjie Research Station.
Interestingly, this helpful photo was also included in the press release from Eurekalert. It is the weather station used to monitor climate at the Rekomitjie Research Station, Zimbabwe. I provide it below, click for full-size. At the scale displayed above, you might not notice some important details about the weather station itself, but I did. Here it is, magnified: …
La géologie, une science plus que passionnante … et diverse
