by Judith Curry, November 30, 2018 in WUWT
Draft of article to be submitted for journal publication.
Well, I hope you are not overdosing on the issue of sea level rise. But this paper is somewhat different, a philosophy of science paper. Sort of how we think about thinking.
I would appreciate any comments, as well as suggestions as to which journals I might submit to. I have two in mind, but am open to suggestions (and I may need backups).
Thanks in advance for your comments.
Sea level rise: What’s the worst case?
Abstract. The objective of this paper is to provide a broader framing for how we bound possible scenarios for 21st century sea level rise, in particular how we assess and reason about worst-case scenarios. This paper integrates climate science with broader perspectives from the fields of philosophy of science and risk management. Modal logic is used as a basis for describing construction of the scenario range, including modal inductivism and falsification. The logic of partial positions and strategies for speculating on black swan events associated with sea level rise are described. The rapidly advancing front of background knowledge is described in terms of how we extend partial positions and approach falsifying extreme scenarios of 21st century atmospheric CO2 concentrations, warming and sea level rise. The application of partial positions and worst-case scenarios in decision making strategies is described for examples having different sensitivities to Type I versus Type II errors.
…
by Mark Fife, November 30, 2018 in WUWT
…
Conclusions:
We have looked at quality, long term records from three different regions. Two of these are on opposite sides of the North Atlantic, one is in the South Pacific. The two regions bordered by the North Atlantic are similar, but not identical. The record from Australia is only similar in that temperature has varied over time and has warmed in the recent past.
In all three regions there is no evidence of any strong correlation to CO2. There is ample evidence to support a conjecture of little to no influence.
There is ample evidence, widely shown in other studies, of localized influence due to development and population growth. The CET record has a correlation of temperature to CO2 of 0.54, which is the highest correlation of any individual record in this study. This area is also the most highly developed. While this does not constitute proof, it does tend to support the supposition the weak CO2 signal is enhanced by a coincidence between rising CO2 and rising development and population.
The efficacy of combining US records with those records from Greenland, Iceland, and the UK may be subject to opinion. However, there is little doubt combining records from Australia would create an extremely misleading record. Like averaging a sine curve and a cosine curve.
It appears the GISS data set does a poor job of estimating the history of temperature in all three regions. It shows a near perfect correlation to CO2 levels which is simply not reflected in any of the individual or regional records. There are probably numerous reasons for this. I would conjecture the reasons would include the influence of short-term temperature record bias, development and population growth bias, and data estimation bias. However, a major source of error could be attributed to the simple mistake of averaging regions where the records simply are too dissimilar for an average to yield useful information.
…
by P. Homewood, November 30, 2018 in NotaLotofPeopleKnowThat
…
I wholeheartedly agree with David’s comments, in particular the need to show graphs.
I am sometimes accused of cherry picking or coming to different conclusions to others. But what I always try to do is actually show the graph, so readers can form their own opinions.
While we are on the topic, I will put up that Woodfortrees graph, which I posted yesterday. According to Woodfortrees, the warming trend since 1950 has been 0.012C/yr, or 1.2C/C.
Yet the BBC report, referred to by Dr Whitehouse, actually states that:
If the trend continues, the WMO says temperatures may rise by 3-5C by 2100.
This claim clearly is not compatible with the historical data
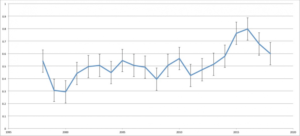
Fig 2 shows the same data with error bars from which it can be seen that 2018 is statistically equivalent to some years before the El Nino event.
…
See aslo here
La géologie, une science plus que passionnante … et diverse
