by J.C. Maurin, 13 juin 2019 in ScienceClimatEnergie
Une croissance du CO2 atmosphérique qui serait exclusivement anthropique est contradictoire avec les observations du carbone 13 dans l’atmosphère (ici). Cet article en 2 parties va montrer qu’il existe également des contradictions avec les observations du carbone 14. Celui-ci est utilisé à des fins de datation jusqu’à 50 000 ans BP (Before Present)et on dispose de nombreuses études (pour calibration) sur son évolution dans l’atmosphère.
La première partie s’intéresse, non pas aux datations, mais à la dilution du carbone 14 que provoque l’ajout de CO2 anthropique (effet SUESS) avant les essais thermonucléaires de 1952-1963. Dans la seconde partie nous verrons que l’évolution du carbone 14 après 1963 est aussi en contradiction avec une croissance du CO2 exclusivement anthropique.
1. Le carbone dans l’atmosphère [1] [5]
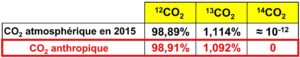
Le carbone existe habituellement sous 3 formes isotopiques : 12C pour ≈ 98.9% , 13C pour ≈ 1.1 % et 14C à l’état de traces (Fig. 1a).
Figure 1a.La seule différence entre CO2 anthropique et CO2 atmosphérique réside dans les proportions du mélange des isotopes: le CO2 anthropique est appauvri en 13C et 14C.L’ajout de CO2 anthropique va modifier, au fil des années, les proportions du mélange isotopique dans l’atmosphère.
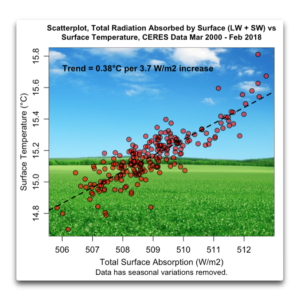
I kept going back and looking at the graphic from my previous post on radiation and temperature. It kept niggling at me. It shows the change in surface temperature compared to the contemporaneous change in how much energy the surface is absorbing. Here’s that graphic again:
Figure 1. From my previous post. It is a scatterplot showing the dependence of temperature on the total downwelling radiation (longwave plus shortwave) absorbed by the surface.
What I found botheracious were the outliers at the top of the diagram. I knew what they were from, which was the El Nino/La Nina of 2015-2016.
After thinking about that, I realized I’d left one factor out of the calculations above. What the El Nino phenomenon does is to periodically pump billions of cubic meters of the warmest Pacific equatorial water towards the poles. And I’d left that advected energy transfer out of the equation in Figure 1. (Horizontal transfer of energy from one place on earth to another is called “advection”).
And it’s not just advection of energy caused by El Nino. In general, heat is advected from the tropics towards the poles by the action of the ocean and the atmosphere. Figure 2 shows the average amount of energy exported (plus) or imported (minus) around the globe.
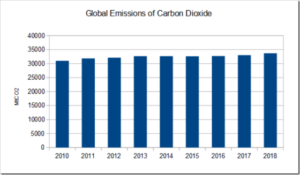
Global primary energy consumption grew rapidly in 2018, led by natural gas and renewables. Nevertheless, carbon emissions rose at their highest rate for seven years
Energy developments
Primary energy consumption grew at a rate of 2.9% last year, almost double its 10-year average of 1.5% per year, and the fastest since 2010.
By fuel, energy consumption growth was driven by natural gas, which contributed more than 40% of the increase. All fuels grew faster than their 10-year averages, apart from renewables, although renewables still accounted for the second largest increment to energy growth.
China, the US and India together accounted for more than two thirds of the global increase in energy demand, with US consumption expanding at its fastest rate for 30 years.
Carbon emissions
Carbon emissions grew by 2.0%, the fastest growth for seven years.
La géologie, une science plus que passionnante … et diverse