Anti science L. A. Times hypes propaganda denying global wide Medieval Warm Period and Little Ice Age

by Larry Hamlin, July 28, 2019 in WUWT


The Los Angeles Times is at it again hyping anti science climate alarmist propaganda trying to conceal the global wide Medieval Warm Period and the Little Ice Age that are supported and justified by hundreds of scientific studies.

This climate alarmist propaganda Times article cites a new “study” that ridiculously attempts to deny these clearly established warm and cool periods in our past.

This alarmist hyped new “study” is addressed in a superb article at the JoNova website demonstrating the complete lack of scientific veracity of this studies claims.

There is nothing I can add to show how politically contrived and inane the claims are from this new “study” beyond the excellent presentation in the JoNova article.

Provided below are excerpts from this excellent article which demonstrate the lack of scientific credibility of the new “study” as well as the politically driven anti science climate alarmism bias of the Times.


‘Hidden’ NOAA temperature data reveals that 6 of the last 9 months were below normal in the USA – and NOAA can’t even get June right

by Anthony Watts, July 30 2019 in WUWT


A review of state-of-the-art climate data tells a different story than what NOAA tells the public.

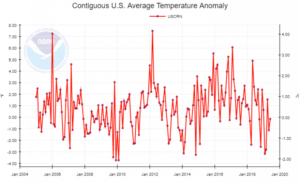
While media outlets scream “hottest ever” for the world in June and July (it’s summer) and opportunistic climate crusaders use those headlines to push the idea of a “climate crisis” the reality is for USA is that so far most of 2019 has been below normal, temperature-wise.

Little known data from the state of the art U.S. Climate Reference Network (which never seems to make it into NOAA’s monthly “state of the climate” reports) show that for the past nine months, six of them were below normal, shown in bold below.


201810 -0.18°F
201811 -2.56°F
201812 2.39°F
201901 0.63°F
201902 -3.15°F
201903 -2.81°F
201904 1.55°F
201905 -1.13°F
201906 -0.14°F

Above: Table 1, U.S. average temperature anomaly from October 2018 to June 2019. Full data file here

Note the below average value for June, 2019 at -0.14°F

Figure 1, U.S. average temperature anomaly from January 2005 to June 2019. Source of graph, NOAA, available here

The pause in global warming shows CO2 may be *more* powerful! Say hello to Hyperwarming Wierdness.

by JoNova, July 24, 2019


It’s all so obvious. If researchers start with models that don’t work, they can find anything they look for — even abject nonsense which is the complete opposite of what the models predicted.

Holy Simulation! Let’s take this reasoning and run with it  — in the unlikely event we actually get relentless rising temperatures, that will imply that the climate sensitivity of CO2 is lower. Can’t see that press release coming…

Nature has sunk so low these days it’s competing with The Onion.

The big problem bugging believers was that global warming paused, which no model predicted, and which remains unexplained still, despite moving goal posts, searching in data that doesn’t exist, and using error bars 17 times larger than the signal. The immutable problem is that energy shalt not be created nor destroyed, so The Pause still matters even years after it stopped pausing. The empty space still shows the models don’t understand the climate — CO2 was supposed to be heating the world, all day, everyday. Quadrillions of Joules have to go somewhere, they can’t just vanish, but models don’t know where they went. If we can’t explain the pause, we can’t explain the cause, and the models can’t predict anything.

In studies like these, the broken model is not a bug, it’s a mandatory requirement — if these models actually worked, it wouldn’t be as easy to produce any and every conclusion that an unskeptical scientist could hope to “be surprised” by.

The true value of this study, if any, is in 100 years time when some psychology PhD student will be able to complete an extra paragraph on the 6th dimensional flexibility of human rationalization and confirmation bias.

Busted climate models can literally prove anything. The more busted they are, the better.

More sensitive climates are more variable climates

University of Exeter

A decade without any global warming is more likely to happen if the climate is more sensitive to carbon dioxide emissions, new research has revealed.

China is warming fastest where the cities are, not where the models predicted – classic UHI

by JoNova, July 24, 2019


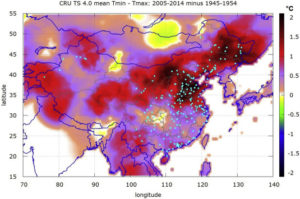
The biggest changes in temperature (“divergence” in dark red brown Fig 6) occurred where the most people lived (blue dots). In the 60 years to 2010 China was reported to have warmed by 0.79 ± 0.10 °C. However Scafetta et al calculate at most, China could have experienced a real warming of only 0.46 ± 0.13 °C.

Somehow the combined might and supercomputers at NOAA, NASA, Hadley and the Bureau of Met experts all missed this.

It’s another third of a degree gone from the Glorious CO2 Narrative. Just like that.


Is there a  more perfect nation to study the Urban Heat Island effect than China?

The worlds most populous nation has made a blistering transformation in two decades. As recently as 1995 the population was 75% rural. Now it’s approaching 60% urban. Shenzhen, which is near Hong Kong, grew from 3000 people in 1950 to more than 10 million in 2010. Around Beijing, thousands of towns have been built in a networked carpet, each a mere 2km apart (zoom in on Google satellite view). The stations in these areas are effectively not rural anymore.

See also here

China Still Expanding Coal Power Capacity

by P. Homewood, July 23, 2019 in NotaLotofPeoppleKnowThat


SANHE, China (Reuters) – China Energy Group, the country’s biggest power generator, will add more than 6 gigawatts (GW) of new ultra-low emission coal-fired capacity this year as it bids to meet growing electricity demand, a senior official with the firm said on Thursday.

The company also expected to build another 5 GW of low-emission capacity next year, Xiao Jianying, the head of the state-run firm’s coal-fired power department, told Reuters.

“China still has quite a big demand for electricity. The government now supports regions with poor wind and solar resources to use coal-fired power … it’s a more practical measure, as gas is still too expensive,” said Xiao.

China Energy operated coal-fired plants with a total capacity of 175 GW at the end of 2018, 77.4% of its total capacity and about 10% of the entire country’s capacity.

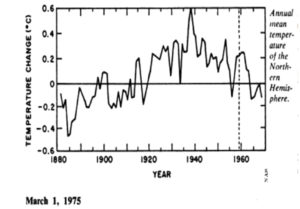
1970s: Earth Warmed 0.6°C From 1880-1940 And Cooled -0.3°C From 1940-1970. Now It’s 0.1°C And -0.05°C.

by K. Richard, July 25, 2019 in NoTricksZone


About 45 years ago, the “consensus” in climate science (as summarized by Williamson, 1975) was quite different than today’s version.

1. The Medieval Warm Period was about 1°C warmer than present overall while the “largely ice-free” Arctic was 4°C warmer, allowing the Vikings to navigate through open waters because there was “no or very little ice” at that time.
2. The island of Spitsbergen, 1237 km from the North Pole and home to over 2000 people, “benefited” because it warmed by 8°C between 1900 and 1940, resulting in 7 months of sea-ice free regional waters. This was up from just 3 months in the 1800s.
3. Central England temperatures dropped -0.5°C between the 1930s to the 1950s.
4. Pack-ice off northern and eastern iceland returned to its 1880s extent between 1958 and 1975.
5. In the 1960s, polar bears were able to walk across the sea (ice) from Greenland to Iceland for the first time since the early 1900s. (They had somehow survived the 7 months per year of sea-ice-free waters during the 1920s-1940s).


Image Source: National Academy of Sciences,  Understanding Climatic Change

Lingen Cheated: Germany’s New All-Time Record High Resulted From DWD Weather Service Lousy Station Siting

by P. Gosselin, July 28, 2019 in NoTricksZone


During last week’s record-setting European heat wave, Germany’s previous record of 40.3C was impressively shattered by the measurement station located at the northwest city of Lingen, near the Dutch border, some 50 kilometers from where I live. The German DWD weather service and media loved it!

Controversial siting

Yet, controversy now swirls about the new record setting measurement since it has come to light that the measurement is fraught with some considerable siting issues.

As the photo published by T-online here shows, the station is located right near a DWD office building, is shielded from the wind by grown trees and is located not far from a public swimming pool.

Meteorologist Michael Theusner told t-online.de: “The monthly average of the daily highs in Lingen has been deviating more and more upwards from the average of the highs in Lower Saxony since 2010.” The station has become increasingly shielded and thus tends to heat up more.

Swiss veteran meteorologist Jörg Kachelmann wrote the extra heat possibly could be heating the station by up to another 3 degrees!

DWD accepts overheated reading

12 New Papers Provide Robust Evidence The Earth Was Warmer During Medieval Times

by K. Richard, July 29, 2019 in NoTricksZone


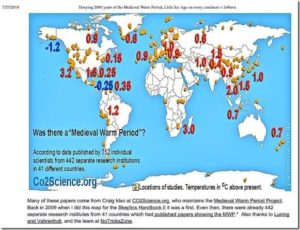
Claims that modern temperatures are globally warmer than they were during Medieval times (~800 to 1250 A.D.) have been contradicted by a flurry of new (2019) scientific papers.

Southern Ocean/SE Pacific (SSTs)

The Medieval Warm Period (1100 years BP) was 1.5°C warmer than today (14°C vs. 12.5°C) in the SE Pacific or Southern Ocean.


See also here

SUMMER COLD GRIPS RUSSIA: TEMPERATURE RECORDS TUMBLE — HARD FROSTS REPORTED

by Cap Allon, July 28, 2019 in Electroverse


Arctic air has plunged into ALL of transcontinental Russia this week, from east to west, north to south. In fact, average temperatures have been holding at least 8C below normal for vast swathes of the 17,125,200 km2 nation ALL MONTH.

And, over the past few days, a large number of new all-time record-low temperatures were set in the Magadan region, located to the east of the country, in northeast Yakutia (Sakha Republic).

I’ve listed a few of them below (data courtesy of (http://www.hmn.ru):

  • On July 24, in Susuman, a record breaking -4.1C (24.6F) was observed — busting the previous daily record of -3.5C set back in 1973 (solar minimum of cycle 20).
  • In Seimchan, -2.9C (26.8F) beat the previous record for the date of -2.4C (27.7F) from 1991.
  • In Brokhovo, the new record low for July 24 is now 4C (39.2F), which surpasses the 4.6C (40.3F) from 1973 (solar minimum of cycle 20).
  • The -1.4C (29.5F) in Talon comfortably ousted the -0.6C (30.9F) from 1973 (solar minimum of cycle 20).
  • Tompo’s -0.3C (31.5F) bumped-off the previous all-time record 0.3C (32.5F) from 1977 (again, solar minimum of cycle 20).
  • While in Zyryanka, the mercury fell to 2.7C (36.9F), busting 1956’s 2C (35.6F).

What the Climate Change Models Actually Say

by R. Murphy, July 20, 2019 in FoundationEconomicEducation


An Earth scientist’s recent article making the rounds on social media highlights a terrifying conversation he had with “a very senior member” of the IPCC, which is the UN’s body devoted to studying climate science. The upshot of their conversation was that millions of people will die from climate change, a conclusion that leads the author to lament that humans have created a consumption-driven civilization that is “hell-bent on destroying itself.”

As with most such alarmist rhetoric, there is little to document these sweeping claims—even if we restrict ourselves to “official” sources of information, including the IPCC reports themselves. The historical record does not justify panic, but instead should lead us to expect continued progress for humanity, so long as the normal operation of voluntary market interactions continues without significant political interference to sabotage it.

Here is the opening hook from James Dyke’s article, in which he grabs the reader with an apocalyptic conversation:

Why Climate Change Wasn’t Behind Paris’s Record-High Temperature

by Chris Martz, July 27, 019 in ClimateChangeDispatch


It’s summer, temperatures are hot - sometimes record hot - and as usual, climate alarmism reaches record highs as climate activists have a field day with fearmongering rather than with facts and data.

Every week, various weather events end up getting caught in the spokes of the wheel of climate; it’s an endless cycle. Rinse, wash, repeat.

This time, it’s the [second] European heatwave this summer.

A Bit of Historical Perspective

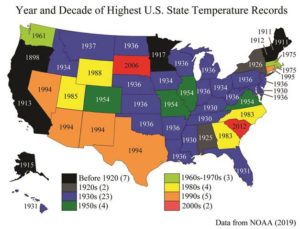
While countries like the Netherlands, Germany, and Belgium have recorded their hottest temperatures on record this week, Paris’s record high of 108.7°F (42.6°C) on Thursday, July 25, made international headlines and consequently sparked climate insanity.¹

The graph below (Figure 1) shows the maximum temperature in Paris, France for each year since 1900.² As indicated by the red trendline, there has been a noticeable increase in the annual maximum temperature in Paris over the long run, however, the trend is not alarming.

Paris’s previous hottest temperature record stood for nearly 72 years.³

On July 28, 1947, the city reached 104.7°F (40.4°C).³ Paris’s high of 108.7°F (42.6°C) on Thursday broke the old record by 4°F (2.2°C), an incredible feat by any stretch of the imagination.

To break an all-time temperature record by 4°F in summer, let alone tie it, is extremely difficult to do, even with global warming.

GLOBAL TEMPERATURE FALLING AGAIN

by Clive Best, July 27, 2019 in GWPF


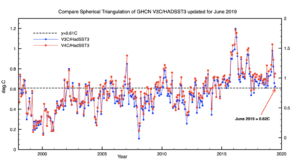
The global averaged surface temperature for June 2019 was 0.62C, back down to where it was before the 2015/16 El Nino.

The global averaged surface temperature for June 2019 was 0.62C using my spherical triangulation method merging GHCNV3 with HadSST3. This is a further drop of 0.04C from May 2018. The discrepancy with GHCNV4 is however growing. V4C calculated in exactly the same way gives a June temperature of 0.75C, a rise of 0.03C,  and 0.13C warmer than V3. This difference is statistically significant.

COLD PERU: “WE ARE GOING THROUGH ONE OF THE MOST INTENSE WINTERS IN 50 YEARS”

by Cap Alon, July 26, 2019 in Electroverse


Lima, the capital of Peru, is going through one of its coldest winters in almost 50 years, according to the National Service of Meteorology and Hydrology, with this year even surpassing the truly brutal 2018 season.

“Lima is currently recording minimum temperatures around 14.7C,” said climatology expert Lourdes Menis Álvarez of Senamhi. “As for maximum temperatures, we are around 17.5C.”

Comparing these temperatures to the 2018 season, which itself was one of the coldest winters on record, Álvarez found that this year has been significantly cooler to date, with temps ranging on average between 1C to 1.5C colder.

According to Álvarez, these types of cold winters were once common-place in Lima. Of late, however, strong El Niños have brought “long summers and warm winters” to the region.

Though the tide is clearly now turning. Álvarez: “The winter of 2018 was one of the coldest in almost 50 years. However, the winter of 2019 has already surpassed it in intensity.”

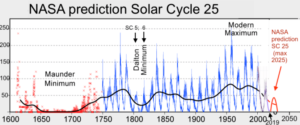
The cold times are returning, in line with historically low solar activity:


See also here (Russia)

UK Record Temperature Stays Intact

by P. Homewood, July 26, 2019 in NotaLotofPeopleKnowThat

The Met Office have been desperate to declare a new UK temperature record this week, but the weather gods said no!

The Cambridge temperature fell well short of the all time record of 38.5C set at Faversham in 2003.

They feebly claim that the Cambridge temperature is still a record for July. Climatologically July is a warmer month than August, when the Faversham record was set, so by all accounts the 2003 heatwave was more extreme than yesterday’s.

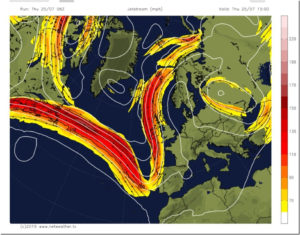
The cause of the high temperatures is very clear. Not only was hot air being drawn up from Spain, but a deep area of low pressure to the west powered up the jet stream to bring that hot air north very quickly, before the heat had a chance to dissipate.

FOR THE FIRST TIME IN TWO DECADES, THICK SNOW LINGERS ON HIMALAYAN MOUNTAIN PASSES IN JULY

by Cap Alon, July 26, 2019 in Electroverse


Crazed environmentalists take note, the Himalayan mountain passes of Rohtang, Baralacha, Kunjum, Shikula are STILL blanketed in deep snow, in July!

Snow holding on until the end of July is incredibly rare on these passes, reports the The Statesman — in fact, it’s the first time in 20 years that it’s occurred, the packs are usually all-gone by the end of May.

Furthermore, heavy and record-breaking snow has been falling this week actually adding to the pack.

“The heavy accumulation of snow up to 4-5 feet on Rohtang, Baralacha, Kunjum, Shikula passes is certainly good for the environment in the Himalayas,” said Senior Scientific Officer at State Centre on Climate Change, Dr SS Randhawa.


A view of Solang Nullah from where the Rohtang tunnel connecting Kullu to Lahaul and Spiti is proposed
photo by Birbal Sharma

Climate: about which temperature are we talking about?

by S. Furfari and H. Masson, July 26, 2019 in ScienceClimateEnergie


Is it the increase of temperature during the period 1980-2000 that has triggered the strong interest for the climate change issue? But actually, about which temperatures are we talking, and how reliable are the corresponding data?

1/ Measurement errors

Temperatures have been recorded with thermometers for a maximum of about 250 years, and by electronic sensors or satellites, since a few decades. For older data, one relies on “proxies” (tree rings, stomata, or other geological evidence requiring time and amplitude calibration, historical chronicles, almanacs, etc.). Each method has some experimental error, 0.1°C for a thermometer, much more for proxies. Switching from one method to another (for example from thermometer to electronic sensor or from electronic sensor to satellite data) requires some calibration and adjustment of the data, not always perfectly documented in the records. Also, as shown further in this paper, the length of the measurement window is of paramount importance for drawing conclusions on a possible trend observed in climate data. Some compromise is required between the accuracy of the data and their representativity.

2/ Time averaging errors

If one considers only “reliable” measurements made using thermometers, one needs to define daily, weekly, monthly, annually averaged temperatures. But before using electronic sensors, allowing quite continuous recording of the data, these measurements were made punctually, by hand, a few times a day. The daily averaging algorithm used changes from country to country and over time, in a way not perfectly documented in the data; which induces some errors (Limburg, 2014) . Also, the temperature follows seasonal cycles, linked to the solar activity and the local exposition to it (angle of incidence of the solar radiations) which means that when averaging monthly data, one compares temperatures (from the beginning and the end of the month) corresponding to different points on the seasonal cycle. Finally, as any experimental gardener knows, the cycles of the Moon have also some detectable effect on the temperature (a 14 days cycle is apparent in local temperature data, corresponding to the harmonic 2 of the Moon month, Frank, 2010); there are circa 13 moon cycle of 28 days in one solar year of 365 days, but the solar year is divided in 12 months, which induces some biases and fake trends (Masson, 2018).

3/ Spatial averaging

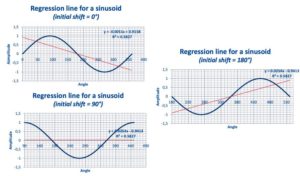
Figs. 12, 13 and 14 : Linear regression line over a single period of a sinusoid.


Conclusions


  1. IPCC projections result from mathematical models which need to be calibrated by making use of data from the past. The accuracy of the calibration data is of paramount importance, as the climate system is highly non-linear, and this is also the case for the (Navier-Stokes) equations and (Runge-Kutta integration) algorithms used in the IPCC computer models. Consequently, the system and also the way IPCC represent it, are highly sensitive to tiny changes in the value of parameters or initial conditions (the calibration data in the present case), that must be known with high accuracy. This is not the case, putting serious doubt on whatever conclusion that could be drawn from model projections.

  2. Most of the mainstream climate related data used by IPCC are indeed generated from meteo data collected at land meteo stations. This has two consequences:(i) The spatial coverage of the data is highly questionable, as the temperature over the oceans, representing 70% of the Earth surface, is mostly neglected or “guestimated” by interpolation;(ii) The number and location of theses land meteo stations has considerably changed over time, inducing biases and fake trends.

  3. The key indicator used by IPCC is the global temperature anomaly, obtained by spatially averaging, as well as possible, local anomalies. Local anomalies are the comparison of present local temperature to the averaged local temperature calculated over a previous fixed reference period of 30 years, changing each 30 years (1930-1960, 1960-1990, etc.). The concept of local anomaly is highly questionable, due to the presence of poly-cyclic components in the temperature data, inducing considerable biases and false trends when the “measurement window” is shorter than at least 6 times the longest period detectable in the data; which is unfortunately the case with temperature data

  4. Linear trend lines applied to (poly-)cyclic data of period similar to the length of the time window considered, open the door to any kind of fake conclusions, if not manipulations aimed to push one political agenda or another.

  5. Consequently, it is highly recommended to abandon the concept of global temperature anomaly and to focus on unbiased local meteo data to detect an eventual change in the local climate, which is a physically meaningful concept, and which is after all what is really of importance for local people, agriculture, industry, services, business, health and welfare in general.
Urban Heat Island (or UHI)

by Roger A. Pielke Sr,  July 25, 2019


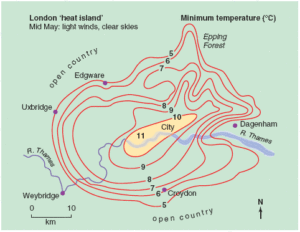
The urban heat island effect is a well-documented example of inadvertent modification of climate by human activities in the form of increased temperatures of urban areas compared to a city’s rural surroundings. It is a fine example of how changing the energy balance of a region can affect the regional climate.

On average, the city is warmer than the countryside because of differences between the energy gains and losses of each region. There are a number of factors that contribute to the relative warmth of cities, such as heat from industrial activity, the thermal properties of buildings, and the evaporation of water. For example, the heat produced by heating and cooling city buildings and running planes, trains, buses, and automobiles contributes to the warmer city temperatures. Heat generated by these objects eventually makes its way into the atmosphere, adding as much as one third of the heat received from solar energy. The architecture of cities intensifies UHI effect. The canyon shape of the tall buildings and the narrow space between them magnifies the longwave energy gains. During the day, solar energy is trapped by multiple reflections off the many closely spaced, tall buildings, reducing heat losses by longwave radiation (See schematic below). Pollution in the city’s air also modifies the absorption of longwave and shortwave radiation of the atmosphere.

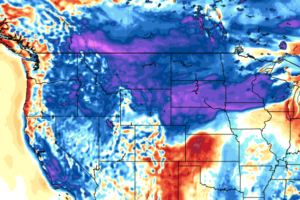
ALL-TIME RECORD LOW TEMPERATURES SET ACROSS MONTANA + ONE TIED FROM 1898

by Cap Allon, July 23, 2019 in Electroverse


With the few days of ‘eastern heat’ taking all the headlines, the anomalous and long-lasting cold infecting vast swathes of North America is again being swept under the sustainably-sourced non-synthetic-petroleum-derived-fiber carpet. Record cold hit Montana over the weekend with several cities and towns setting new all-time record lows, but I’ll bet my diesel-guzzling L200 you never heard about it.

I’ve listed a few of the new record lows below:

  • Utica set a new record low of -1.1C (30F) on Saturday July 20.
  • Kalispell’s 2.2C (36F) busted the previous record of 3.3C (38F) set in 1996 (solar minimum of cycle 22).


You can view it from this link : https://electroverse.net/new-all-time-record-low-temperatures-set-across-montana/

CO2 Is So Powerful It Can Cause Global Warming To Pause For Decades

by Joanna Nova, July 24, 2019 in ClimateChangeDispatch


It’s all so obvious. If researchers start with models that don’t work, they can find anything they look for — even abject nonsense which is the complete opposite of what the models predicted.

Holy Simulation! Let’s take this reasoning and run with it  — in the unlikely event, we actually get relentless rising temperatures, that will imply that the climate sensitivity of CO2 is lower. Can’t see that press release coming…

Nature has sunk so low these days it’s competing with The Onion.

The big problem bugging believers was that global warming paused, which no model predicted, and which remains unexplained still, despite moving goalposts, searching in data that doesn’t exist, and using error bars 17 times larger than the signal.

The immutable problem is that energy shalt not be created nor destroyed, so The Pause still matters even years after it stopped pausing.

The empty space still shows the models don’t understand the climate — CO2 was supposed to be heating the world, all day, every day.

Quadrillions of Joules have to go somewhere, they can’t just vanish, but models don’t know where they went. If we can’t explain the pause, we can’t explain the cause, and the models can’t predict anything.

In studies like these, the broken model is not a bug, it’s a mandatory requirement — if these models actually worked, it wouldn’t be as easy to produce any and every conclusion that an unskeptical scientist could hope to “be surprised” by.

The true value of this study, if any, is in 100 years time when some psychology Ph.D. student will be able to complete an extra paragraph on the 6th-dimensional flexibility of human rationalization and confirmation bias.

Busted climate models can literally prove anything. The more busted they are, the better.

Developing nations latest decade of energy & emissions growth torpedoes alarmist global emissions control scam

by Larry Hamlin, July 23, 2019 in WUWT


The UN has been pursuing global emissions policy for decades that are intended to provide for the establishment of global government schemes allowing it to control world emissions.

No fewer than 24 United Nations Climate Change Conferences have been held at various global locations since 1995 under its Conference of the Parties (COP) legal framework.

COP 21 which occurred in November and December 2015 in Paris resulted in the creation of the Paris Agreement that supposedly established global agreement to reduce greenhouse gas emissions and limit future global temperatures that the UN based upon projections from climate models that grossly exaggerate the impact of greenhouse gases on world temperatures.

The UN IPCC acknowledged in its AR3 climate report in 2001 that it is not possible to develop computer models that are capable of predicting future global climate and yet the Paris Agreement based its emissions targets intended for the future using these flawed computer models.

Three additional UN climate conferences have occurred since the Paris Agreement with the last conference being in 2018 in Poland. No success has been achieved in these three conferences in devising specific commitments for emissions reductions targets for the world’s developing nations.

Additionally the U.S. under President Trump wisely withdrew from the Paris Agreement in June of 2017.

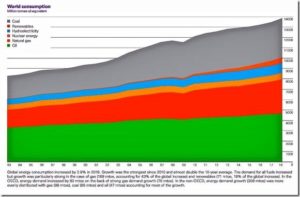
Global energy and emissions detailed information for 2018 is now available which includes data encompassing the latest decade of 2008 to 2018. The world energy consumption data from the report is summarized in the graph below.

This latest decade energy and emissions data clearly demonstrates that the developing nations completely dominate global energy and emissions. This includes both present levels as well as future growth. These results also show that the developed nations play a minority role in these measures both presently and in the future.

The results for the last decade show that global energy use grew by 18.5% during the last decade with 98.5% of that energy growth accounted for by the developing nations.

China Energy to expand ultra-low emission coal-fired power: executive

by Reuters, July 23, 2019 in WUWT


SANHE, China (Reuters) – China Energy Group, the country’s biggest power generator, will add more than 6 gigawatts (GW) of new ultra-low emission coal-fired capacity this year as it bids to meet growing electricity demand, a senior official with the firm said on Thursday.

The company also expected to build another 5 GW of low-emission capacity next year, Xiao Jianying, the head of the state-run firm’s coal-fired power department, told Reuters.

“China still has quite a big demand for electricity. The government now supports regions with poor wind and solar resources to use coal-fired power … it’s a more practical measure, as gas is still too expensive,” said Xiao.

China Energy operated coal-fired plants with a total capacity of 175 GW at the end of 2018, 77.4% of its total capacity and about 10% of the entire country’s capacity.

Xiao said the company would gradually shut down small and polluting coal-fired power units and replace them with efficient ones, noting that total capacity would continue to increase but at a slower rate of growth.

The firm is also planning to launch another carbon capture and storage (CCS) project in northwest China next year as part of its efforts to reduce the environmental impact of using coal, company officials said. It already runs a CCS plant at its coal-to-oil facility in Erdos in Inner Mongolia.

China, the world’s biggest greenhouse gas emitter, has vowed to control new coal production and new coal-fired power capacity as part of its commitments to curb pollution and tackle global warming. However, it has shown signs of relaxing restrictions in recent months amid an economic slowdown.

Thirty years of unique data reveal what’s really killing coral reefs

by P. Homewood, July 24, 201 in NotatLotofPeopleKnowThat


Coral reefs are considered one of the most threatened ecosystems on the planet and are dying at alarming rates around the world. Scientists attribute coral bleaching and ultimately massive coral death to a number of environmental stressors, in particular, warming water temperatures due to climate change.

A study published in the international journal Marine Biology, reveals what’s really killing coral reefs. With 30 years of unique data from Looe Key Reef in the lower Florida Keys, researchers from Florida Atlantic University’s Harbor Branch Oceanographic Institute and collaborators have discovered that the problem of coral bleaching is not just due to a warming planet, but also a planet that is simultaneously being enriched with reactive nitrogen from multiple sources.

Improperly treated sewage, fertilizers and top soil are elevating nitrogen levels, which are causing phosphorus starvation in the corals, reducing their temperature threshold for “bleaching.” These coral reefs were dying off long before they were impacted by rising water temperatures. This study represents the longest record of reactive nutrients and algae concentrations for coral reefs anywhere in the world.

“Our results provide compelling evidence that nitrogen loading from the Florida Keys and greater Everglades ecosystem caused by humans, rather than warming temperatures, is the primary driver of coral reef degradation at Looe Key Sanctuary Preservation Area during our long-term study,” said Brian Lapointe, Ph.D., senior author and a research professor at FAU’s Harbor Branch.


https://phys.org/news/2019-07-years-unique-reveal-coral-reefs.html


There is the usual armwaving about climate change, but no evidence is presented as to why a small increase in CO2 levels should have the slightest effect on water temperatures or coral development, when the climate has been much warmer for most of the period since the end of the ice age.

As is usually the case with environmental degradation and species decline, it is the obvious factors which are responsible.

1980s Science: Ice Cores Show CO2 Naturally Rose 200 ppm (65 ppm/100 Years) During The Early Holocene

by K. Richard, July 22, 2019 in NoTricksZone


A few decades ago it was “consensus” science that CO2 levels had reached 400 ppm (and even up to 500 ppm) during the Early Holocene, with rising amplitudes of greater than 200 ppm and rates of 65 ppm in less than a century. Then the “consensus” opinion changed.

In 1982 it was still quite acceptable for Dr. Flohn, a climate scientist, to acknowledge that changes in CO2 concentration changes are significantly determined by temperature “rather independent of” fossil fuel emissions, but also that Holocene CO2 concentrations reached 350 to 400 ppm between 8,000 to 6,000 years ago (Flohn, 1982).

Why the discrepancy between “consensus” CO2 and historically recorded CO2?

Polish physicist Dr. Zbigniew Jaworowski (1997) was a fierce critic of the means by which ice core data have been collected to assign CO2 concentration values to past epochs.

His criticisms center around the post-1985 tendencies for fellow scientists to openly employ selection bias in making pre-determined decisions about what measurements are “right” and which ones are “wrong” – effectively rendering their results meaningless.

He cites Pearlman et al. (1986), for example. These authors collected 74 Antarctic ice core CO2 samples. Of those, 32 (43%) were rejected because they had values that were too high or too low to match with the agreed-upon pre-determination.

In what other branch of science is it acceptable to discard measured data we don’t agree with?


New York Heatwaves Like This Week’s Are The Norm

by P. Homewood, July 22, 2019 in NotaLotofPeopleKnowThat


Extremely hot weather has started to hit most of the United States, with temperatures set to peak over the weekend, meteorologists say.

The heatwave could affect about 200 million people in major cities like New York, Washington and Boston in the East Coast, and the Midwest region too.

In some places, temperatures could be close to or exceed 100F (38C). Parts of Canada are also being hit.

Experts link more frequent heatwaves in recent years to climate change.

The world experienced its hottest June on record this year, with an average temperature worldwide of 61.6F (16.4C), according to new data.

Earlier this month, the US state of Alaska, part of which lies inside the Arctic Circle, registered record high temperatures.

https://www.bbc.co.uk/news/world-us-canada-49049378


As I revealed last week, the Alaska claim was fake.

But what about this latest heatwave? Is it anything unusual?

Well not in New York, that’s for sure.

The temperature in Central Park never even got near 100F, peaking at 95F yesterday.


http://climod2.nrcc.cornell.edu/