Causes of the Rapid Warming of the North Atlantic Ocean in the Mid-1990s

by P. Homewood, April 9, 2020 in NotaLotofpeopleKnowThat


http://ocean.dmi.dk/arctic/icecover_30y.uk.php

Most of us are probably familiar with the pattern of Arctic sea ice decline between 1979 and 2007, followed by a period of relative stability. Most of the decline took place after the mid 1990s.

The decline is nearly always explained away as the result of global warming, but a couple of old studies show this not to be the case.

In 2011, Robson & Sutton found that the sub polar gyre underwent remarkable and rapid warming in the mid 1990s, and that this was linked to changes in the North Atlantic Oscillation:

RECORD SNOWFALL BURIES UPPER MIDWEST — SIERRA NEVADA MOUNTAINS TO SEE 4-FEET ON SUNDAY — NH SNOW MASS 500 GIGATONS ABOVE 1982-2012 AVERAGE

by Cap Allon, April 5, 2020 in Electroverse


According to abcnews.go.com and the NWS, seven states from Minnesota to Kansas were under ice and snow alerts on Friday, while forecasts for the West see 4-feet of snow falling over the Sierra through Sunday alone.

Thursday, April 2 saw record Spring snowfall bury the Upper Midwest.

In Grand Forks, North Dakota, a whopping 10 inches (25.4 cm) of global warming goodness was measured; while Fargo, North Dakota, saw snow totals touch 5 inches (12.7 cm).

Wyoming was handed the largest accumulations — a recording busting 21 inches (53.3cm).

This cold front continued its slow southerly march overnight Thursday, and reached southeastern Texas by Friday afternoon — the biggest impacts here were severe thunderstorms, damaging winds, golf-ball size hail, and the odd tornado. Heavy rain also reportedly produced some flash flooding.

A new storm rolled into the West Coast on Saturday bringing heavy rain to the California coast. Looking forward to Sunday, staggering April snow totals of up to 4 FEET are forecast to bury the Sierra Nevada Mountains:

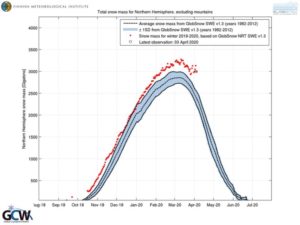
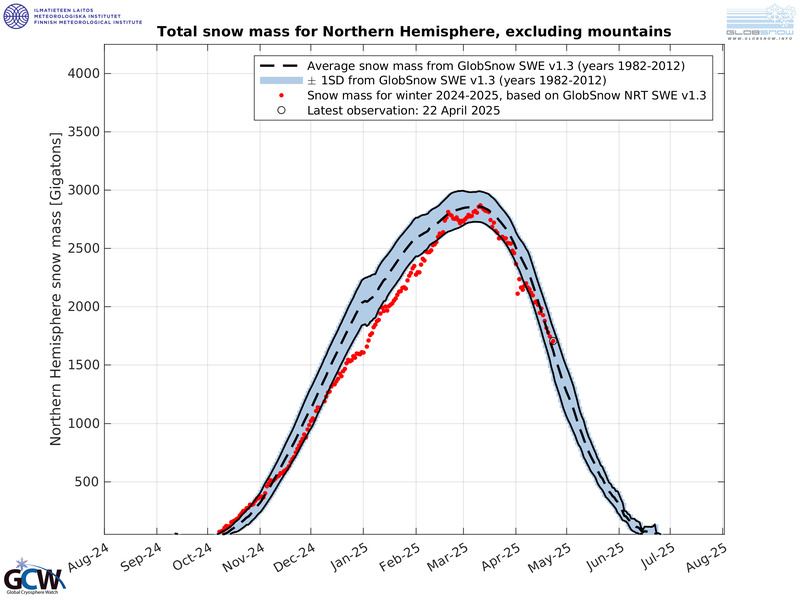
The significance of these snow totals cannot be overemphasized.

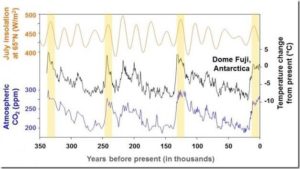
This is how glaciers form.

This is also how ice ages begin.

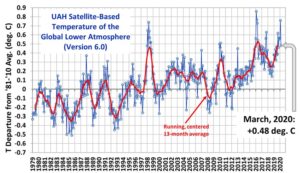
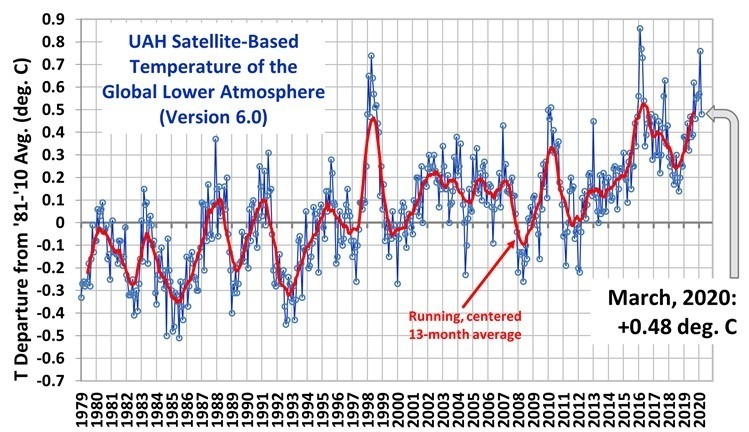
The COLD TIMES are returning in line with historically low solar activitycloud-nucleating Cosmic Rays, and a meridional jet stream flow.

Even NASA agrees, in part at least, with their forecast for this upcoming solar cycle (25) revealing it will be “the weakest of the past 200 years,” with the agency correlating previous solar shutdowns to prolonged periods of global cooling here.

Science team points out a new failure of climate models

by A. Watts, April 6, 2020 in WUWT


From Nature Climate Change:

Ill-sooted models by Baird Langenbrunner

Atmospheric black carbon (BC) or soot — formed by the incomplete combustion of fossil fuels, biofuel and biomass — causes warming by absorbing sunlight and enhancing the direct radiative forcing of the climate. As BC ages, it is coated with material due to gas condensation and collisions with other particles. These processes lead to variation in the composition of BC-containing particles and in the arrangement of their internal components — a mixture of BC and other material — though global climate models do not fully account for these heterogeneities. Instead, BC-containing particles are typically modelled as uniformly coated spheres with identical aerosol composition, and these simplifications lead to overestimated absorption.

Full article here

Here, the PNAS paper

Carbon soot in from industrial process in the air. Licensed from 123rf.com

The Next Solar Cycle

by David Whitehouse.(pdf), April 6, 2020 in GWPF


London, 6 April: A former BBC science correspondent says that there remains a real possibility that unusual solar behaviour could influence the Earth’s climate, bringing cooler temperatures  for the next decade.

Despite rising levels of atmospheric carbon dioxide, the reduction in solar activity along with cooling from other long-term terrestrial climate variables could mean we might see a slowdown in global warming for years.

Dr Whitehouse says:  “It is clear that the solar influence on climate is about 0.1 °C a decade so it is important to know when there are low solar activity periods. We have a grasp of the basic mechanism that drives long-term solar activity, but many of the specifics still elude us. Successful predictions of solar cycle strength are therefore few and far between.”

Whitehouse adds that although NASA are predicting that solar cycle 25, which is just beginning, might be moderate-to-weak, the possibility of a very weak cycle, with a measurable effect on the terrestrial climate, remains a real one.

Dr Whitehouse reviews the history of solar cycle predictions in a new paper by the Global Warming Policy Foundation which is published today.

The paper, entitled The Next Solar Cycle, And Why It Matters For Climatecan be downloaded here (pdf)

Contact

Dr David Whitehouse
e: david.whitehouse@thegwpf.com

El Nino & Arctic Warming In the 1930s

by P. Homewood, April 5, 2020 in NotaLotofPeopleKnowThat


Just following up on Joe Bastardi’s article yesterday about El Ninos and Arctic warming, it is worth looking at longer term trends.

Below is the chart of the MEI, with red indicating El Ninos and blue La Ninas.:

Extended Multivariate ENSO Index

https://www.esrl.noaa.gov/psd/enso/mei.ext/

As we can see, the period 1925 to 1945 was dominated by powerful El Ninos. This of course was also the time of great warming in the Arctic, known as “The Warming in The North”, when temperatures across much of the Arctic were as high as they are now.

During the 1950s, a much colder climate took over in the Arctic, until it became warmer again in the 90s. This was also a period when La Ninas dominated.

Coincidence?

The climate in the Arctic is also very well correlated with the Atlantic Multidecadal Oscillation (AMO):

Continuer la lecture de El Nino & Arctic Warming In the 1930s

Is Greenland Warming, Melting? Hell No! NASA Data Show No Warming In Nearly 100 Years!

by Kirye & Gosselin, April 3, 2020 in NoTricksZone


But then NASA adjusted the V3 data and called it GHCN V4 “unadjusted”. The chart shown above in my tweet toggles between the prior V3 chart and the “unadjusted” V4. See the difference?

Note how the lack of warming has been removed and now the V4 data show modest warming. The missing heat was found – in the statistics! So in a sense, global warming has been “man-made” – done through statistical fudging and not human activity.

Extra warm U.S. winter had nature’s thumbprint on it–Joe Bastardi

by P. Homewood, April 3; 2020 in NotaLotofPeoppleKnowThat


Joe Bastardi explains why this winter has been so mild in the US, but also across N Europe, at CFACT.

Two points:

1) I will make the case for why such winters like this happen

2) I will point out that nowhere in this article did the massive natural physical drivers that far outweigh the effect of CO2, which is only .041% of the atmosphere. Pointedly, of which man is only responsible for  25% and the US only 15% of that total.

I am not going to waste time attacking here, except to say this kind of one-sided journalism and the fact that nowhere did anyone show what I am about to reveal to you, should raise questions of any objective person.

Basically the rules of the game are, if its warm like this winter, its climate change, if it is cold, its climate change. It is typical of everyone gets a trophy in that any answer even if opposite, means you get credit.

I won’t copy the whole article as it is a bit technical, but it can be seen here. However these are the main points Joe raises, starting with the role of El Nino and water vapour:

Water vapor is by far the most important greenhouse gas when it comes to the planetary weather and climate. Meteorologist look at “saturation mixing ratios” which show a correlation of water vapor to temperature. Basically the colder and drier the air mass, the more the introduction of water vapor will lead higher temperatures, there is no place like the arctic to prove this is the case. The cyclically warmed oceans have put more water vapor (and CO2) into the air. When Super El Niño’s go off, the immense amounts dispersed lead to a step up of the temperature. The colder regions leading the way as will be opined on below.

COP26 Postponed

by Charles Rotter/UNFCC, April 1, 2020 in WUWT


The COP26 UN climate change conference set to take place in Glasgow in November has been postponed due to COVID-19.

This decision has been taken by the COP Bureau of the UNFCCC (United Nations Framework Convention on Climate Change), with the UK and its Italian partners.

Dates for a rescheduled conference in 2021, hosted in Glasgow by the UK in partnership with Italy, will be set out in due course following further discussion with parties.

In light of the ongoing, worldwide effects of COVID-19, holding an ambitious, inclusive COP26 in November 2020 is no longer possible.

Rescheduling will ensure all parties can focus on the issues to be discussed at this vital conference and allow more time for the necessary preparations to take place. We will continue to work with all involved to increase climate ambition, build resilience and lower emissions.

See also here

Magma Flood Linked To Sudden Ancient Global Warming Event

by H. Lee, April 1, 2020 in ClimateChangeDispatch


A study has cemented the link between an intense global warming episode 56 million years ago and volcanism in the North Atlantic, with implications for modern climate change.

Roughly 60 million years ago, circulation changes deep within our planet generated a hot current of rock — the Iceland plume — causing it to rise from the heart of Earth’s mantle.


The Giant’s Causeway in Northern Ireland is a geologic feature consisting of thousands of interlocking basalt columns that formed from volcanic eruptions 60 million years ago.

The Wrong Kind Of Carbon

Although a great deal of North Atlantic volcanism happened close in time to the PETM, scientists were initially skeptical that it could have driven the warming.

Sedimentary layers that formed at the time had the wrong kind of carbon — they were rich in the isotope carbon-12, indicating an organic carbon source rather than a volcanic one.

The leading theory was that fluctuations in Earth’s orbit around the sun melted a type of frozen methane just beneath the seabed called methane clathrates.

Yet scientists found scant evidence that enough clathrates existed in the pre-PETM world, or that they could have melted fast enough to drive the warming.

A possible missing link between the North Atlantic Igneous Province and organic carbon was spotted in 2004 in seismic scans through the seabed off the coast of Norway.

Continuer la lecture de Magma Flood Linked To Sudden Ancient Global Warming Event

Ships’ emissions create measurable regional change in clouds

by  University of Washington, March 24, 2020 in ScienceDaily


A container ship leaves a trail of white clouds in its wake that can linger in the air for hours. This puffy line is not just exhaust from the engine, but a change in the clouds that’s caused by small airborne particles of pollution.

New research led by the University of Washington is the first to measure this phenomenon’s effect over years and at a regional scale. Satellite data over a shipping lane in the south Atlantic show that the ships modify clouds to block an additional 2 Watts of solar energy, on average, from reaching each square meter of ocean surface near the shipping lane.

The result implies that globally, cloud changes caused by particles from all forms of industrial pollution block 1 Watt of solar energy per square meter of Earth’s surface, masking almost a third of the present-day warming from greenhouse gases. The open-access study was published March 24 in AGU Advances, a journal of the American Geophysical Union.

EARTH’S TEMPERATURE PLUNGED IN MARCH — GLOBAL COOLING FROM HERE ON OUT

by Cap Allon, April 2, 2020 in Electroverse


The Global Lower Atmosphere plunged 0.28C in March to 0.48C, from its (expected early-year) high of 0.76C in February. Looking at the Sun, the cycles, the past, and the graphs, it is reasonable to assume there’s only one trend from here on out, and that’s down…

Take the previous anomalous “warming spikes” on the UAH Satellite-Based Temperature of the Global Lower Atmosphere chart (below) — they generally occur at the beginning of a year, and then are quickly followed by a sharp downward plunge:

www.drroyspencer.com/

China Extracts Record Amount Of Natural Gas From ‘Fire Ice’ In South China Sea

by GWPF, March 31, 2020


We might be sitting on enough gas to power the world for hundreds, if not thousands, of years.


China conducted its first operation to extract natural gas from gas hydrates in the South China Sea in 2017. Photo: Reuters
In a world awash in oil and gas, you’d think it couldn’t get any worse. Well, it can: China just announced that it had extracted a record amount of what has been poetically called fire ice. It is, however, a form of natural gas trapped in frozen water. 

Continuer la lecture de China Extracts Record Amount Of Natural Gas From ‘Fire Ice’ In South China Sea

New Study: Coral Reefs Thrive Near Acidic Waters (pH ~6.0) Where Seafloor Vents Emit Up To 95,000 ppm CO2

by K. Richard, March 30, 2020 in NoTricksZone


Though it’s believed the 130 ppm increase in atmospheric CO2 concentration since 1750 has caused the ocean waters to “acidify”, on a daily basis 50-380°C metallic acid enriched by CO2 concentrations reaching 60,000 to 95,000 ppm pours through seafloor vents. Nearby coral reefs “thrive” in these high-CO2 conditions.

50 times more CO2 in the oceans than in the atmosphere

Though many believe humans are “acidifying” the oceans by burning fossil fuels and emitting CO2, the ability of humans to impact the oceanic CO2 concentration is already compromised by the observation that the ocean waters contain about 50 times more CO2 (38,000 vs. 750 PgC) than the atmosphere does (North et al., 2014).

The Next Great Extinction Event Will Not Be Global Warming – It Will Be Global Cooling

by A. MacRae, September 1, 2019 in WUWT


CATASTROPHIC GLOBAL WARMING IS A FALSE CRISIS – THE NEXT GREAT EXTINCTION WILL BE GLOBAL COOLING

Forget all those falsehoods about scary global warming, deceptions contrived by wolves to stampede the sheep. The next great extinction event will not be global warming, it will be global cooling. Future extinction events are preponderantly cold: a glacial period, medium-size asteroid strike or supervolcano. Humanity barely survived the last glacial period that ended only 11,500 years ago, the blink-of–an-eye in geologic time.

Cold, not heat, is by far the greater killer of humanity. Today, cool and cold weather kills about 20 times as many people as warm and hot weather. Excess Winter Deaths, defined as more deaths in the four winter months than equivalent non-winter months, total over two million souls per year, in both cold and warm climates. Earth is colder-than-optimum for humanity, and currently-observed moderate global warming increases life spans.

“Cold Weather Kills 20 Times As Many People As Hot Weather”

By Joseph D’Aleo and Allan MacRae, September 4, 2015

https://friendsofsciencecalgary.files.wordpress.com/2015/09/cold-weather-kills-macrae-daleo-4sept2015-final.pdf

However, Excess Winter Deaths are not the worst threats to humanity. The glacial cycle averages about 100,000 years, consisting of about 90,000 years of the glacial period, when mile-thick continental glaciers blanketed much of the Northern and Southern Hemispheres including Canada, Russia, Northern Europe and Northern USA, and about 10,000 years of interglacial, the warm period of the present. Earth is now 11,500 years into the current warm interglacial, and our planet may re-enter the glacial period at any time.

“Glacial-Interglacial Cycles”

https://www.ncdc.noaa.gov/abrupt-climate-change/Glacial-Interglacial%20Cycles

https://www.ncdc.noaa.gov/sites/default/files/styles/716px_width/public/glacial-interglacial.jpg?itok=19bwFcU9

The UAH Global Temperature Dataset at 30 Years: A Look Back at the Early Days

by Dr. Roy Spencer, March 31, 2020 in GlobalWarming


Today (Monday, March 30) is the 30th anniversary of our publication in Science describing the first satellite-based dataset for climate monitoring.

While much has happened in the last 30 years, I thought it might be interesting for people to know what led up to the dataset’s development, and some of the politics and behind-the-scenes happenings in the early days. What follows is in approximate chronological order, and is admittedly from my own perspective. John Christy might have somewhat different recollections of these events.

Some of what follows might surprise you, some of it is humorous, and I also wanted to give credit to some of the other players. Without their help, influence, and foresight, the satellite temperature dataset might never have been developed.


Continuer la lecture de The UAH Global Temperature Dataset at 30 Years: A Look Back at the Early Days