Tous les articles par Alain Préat

Full-time professor at the Free University of Brussels, Belgium apreat@gmail.com apreat@ulb.ac.be • Department of Earth Sciences and Environment Res. Grp. - Biogeochemistry & Modeling of the Earth System Sedimentology & Basin Analysis • Alumnus, Collège des Alumni, Académie Royale de Sciences, des Lettres et des Beaux Arts de Belgique (mars 2013). http://www.academieroyale.be/cgi?usr=2a8crwkksq&lg=fr&pag=858&rec=0&frm=0&par=aybabtu&id=4471&flux=8365323 • Prof. Invited, Université de Mons-Hainaut (2010-present-day) • Prof. Coordinator and invited to the Royal Academy of Sciences of Belgium (Belgian College) (2009- present day) • Prof. partim to the DEA (third cycle) led by the University of Lille (9 universities from 1999 to 2004) - Prof. partim at the University of Paris-Sud/Orsay, European-Socrates Agreement (1995-1998) • Prof. partim at the University of Louvain, Convention ULB-UCL (1993-2000) • Since 2015 : Member of Comité éditorial de la Revue Géologie de la France http://geolfrance.brgm.fr • Since 2014 : Regular author of texts for ‘la Revue Science et Pseudosciences’ http://www.pseudo-sciences.org/ • Many field works (several weeks to 2 months) (Meso- and Paleozoic carbonates, Paleo- to Neoproterozoic carbonates) in Europe, USA (Nevada), Papouasia (Holocene), North Africa (Algeria, Morrocco, Tunisia), West Africa (Gabon, DRC, Congo-Brazzaville, South Africa, Angola), Iraq... Recently : field works (3 to 5 weeks) Congo- Brazzaville 2012, 2015, 2016 (carbonate Neoproterozoic). Degree in geological sciences at the Free University of Brussels (ULB) in 1974, I went to Algeria for two years teaching mining geology at the University of Constantine. Back in Belgium I worked for two years as an expert for the EEC (European Commission), first on the prospecting of Pb and Zn in carbonate environments, then the uranium exploration in Belgium. Then Assistant at ULB, Department of Geology I got the degree of Doctor of Sciences (Geology) in 1985. My thesis, devoted to the study of the Devonian carbonate sedimentology of northern France and southern Belgium, comprised a significant portion of field work whose interpretation and synthesis conducted to the establishment of model of carbonate platforms and ramps with reefal constructions. I then worked for Petrofina SA and shared a little more than two years in Angola as Director of the Research Laboratory of this oil company. The lab included 22 people (micropaleontology, sedimentology, petrophysics). My main activity was to interpret facies reservoirs from drillings in the Cretaceous, sometimes in the Tertiary. I carried out many studies for oil companies operating in this country. I returned to the ULB in 1988 as First Assistant and was appointed Professor in 1990. I carried out various missions for mining companies in Belgium and oil companies abroad and continued research, particularly through projects of the Scientific Research National Funds (FNRS). My research still concerns sedimentology, geochemistry and diagenesis of carbonate rocks which leads me to travel many countries in Europe or outside Europe, North Africa, Papua New Guinea and the USA, to conduct field missions. Since the late 90's, I expanded my field of research in addressing the problem of mass extinctions of organisms from the Upper Devonian series across Euramerica (from North America to Poland) and I also specialized in microbiological and geochemical analyses of ancient carbonate series developing a sustained collaboration with biologists of my university. We are at the origin of a paleoecological model based on the presence of iron-bacterial microfossils, which led me to travel many countries in Europe and North Africa. This model accounts for the red pigmentation of many marble and ornamental stones used in the world. This research also has implications on the emergence of Life from the earliest stages of formation of Earth, as well as in the field of exobiology or extraterrestrial life ... More recently I invested in the study from the Precambrian series of Gabon and Congo. These works with colleagues from BRGM (Orléans) are as much about the academic side (consequences of the appearance of oxygen in the Paleoproterozoic and study of Neoproterozoic glaciations) that the potential applications in reservoir rocks and source rocks of oil (in collaboration with oil companies). Finally I recently established a close collaboration with the Royal Institute of Natural Sciences of Belgium to study the susceptibility magnetic signal from various European Paleozoic series. All these works allowed me to gain a thorough understanding of carbonate rocks (petrology, micropaleontology, geobiology, geochemistry, sequence stratigraphy, diagenesis) as well in Precambrian (2.2 Ga and 0.6 Ga), Paleozoic (from Silurian to Carboniferous) and Mesozoic (Jurassic and Cretaceous) rocks. Recently (2010) I have established a collaboration with Iraqi Kurdistan as part of a government program to boost scientific research in this country. My research led me to publish about 180 papers in international and national journals and presented more than 170 conference papers. I am a holder of eight courses at the ULB (5 mandatory and 3 optional), excursions and field stages, I taught at the third cycle in several French universities and led or co-managed a score of 20 Doctoral (PhD) and Post-doctoral theses and has been the promotor of more than 50 Masters theses.

Le Précambrien : les bactéries, la tectonique des plaques et l’oxygène

by A. Préat (.pdf), 21 août 2020 in Bull.Séanc.Acad.R.Sci.OutreMer


 Mots-clés. — Écosystèmes microbiens; Isotopes du carbone et du soufre; Oxydoréduction; Oxygène; Océans et atmosphère. 

Résumé. — L’oxygène n’est pas apparu aussi brutalement qu’on le pensait sur notre planète. Malgré un apport en oxygène lié aux cyanobactéries dès l’archéen, ce ne sont pas ces microorganismes qui sont à la base de la première grande «révolution» de l’oxygène qui a eu lieu à la limite archéen/paléoprotérozoïque (il y a deux milliards et demi d’années) dans l’atmosphère, lors du Grand Événement d’Oxydation. Ce sont les processus liés au cycle de la tectonique des plaques (activité mantellique et périodes intenses d’érosion/altération) qui ont contribué de manière déterminante à l’augmentation de la concentration de l’oxygène atmosphérique voici deux milliards et demi d’années. Les deux principaux processus responsables de cette augmentation sont liés à l’enfouissement de la matière organique et de la pyrite. L’altération des séries riches de ces deux composants conditionnera ensuite pendant près d’un milliard d’années la composition chimique des océans en oxygène, soufre et fer. Au cours du temps, l’oxygène proviendra de l’activité des cyanobactéries et l’atmosphère réductrice du début de l’archéen sera remplacée par une atmosphère oxydante à la fin du précambrien. 

Keywords. — Microbial Ecosystems; Carbon and Sulfur Isotopes; Oxidation Reduction; Oxygen; Oceans and Atmosphere. 

Summary. — The Precambrian: Bacteria, Plate Tectonics and Oxygen. — Oxygen did not appear as abruptly as we thought on our planet. Despite an oxygen supply related to cyanobacteria since the Archean, these microorganisms are not at the origin of the first great oxygen revolution that took place at the Archean/Paleoproterozoic boundary (two and a half billion years) in the atmosphere during the Great Oxidation Event. Two processes related to the cycle of plate tectonics (mantle activity and intense periods of erosion/weathering) were mostly involved in the increase of the atmospheric oxygen concentration two and a half billion years ago. These two main processes are related to the burial of organic matter and pyrite. The alteration of series with high contents of these two elements will then condition for nearly one billion years the oxygen, sulfur and iron chemical composition of the oceans. Oxygen will finally come from the activity of cyanobacteria and the early Archean reducing atmosphere will be replaced by an oxidizing atmosphere at the end of the Precambrian. 

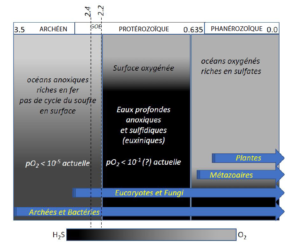
Fig. 3. — Évolution des compositions chimiques et des organismes des océans en trois phases majeures. À l’archéen, les océans contiennent peu d’oxygène et sont relativement riches en fer (colonne de gauche), alors que dans les océans modernes (colonne de droite) l’oxygène est abondant et le fer en quantité limitée. Entre ces deux phases, un long intervalle d’un peu plus d’un milliard d’années est caractérisé par des océans avec des concentrations modérées d’oxygène en surface et des eaux plus profondes riches en H2S en présence de quantités limitées de fer, de molybdène et d’autres éléments en traces importants dans les cycles biologiques. La colonne centrale représente l’«Océan de Canfield» et caractérise le Boring Billion. L’H2S produit (suite à la présence des sulfates, cf. texte) réagit avec le fer ferreux pour former la pyrite. Le fer ferreux n’est donc pas consommé par l’oxygène durant cet intervalle de temps, mais par l’H2S. L’Événement Lomagundi-Jatuli a lieu à environ 2,1 Ga dans le GOE (Great Oxidation Event), marqué par une très forte production d’oxygène. Le début du GOE est marqué par l’oxydation de la pyrite sur les cratons et la disparition des minéraux détritiques sensibles aux conditions d’oxydoréduction des éléments chalcophiles ou sidérophiles (uraninite, sidérite, pyrite, molybdénite, etc.). Les deux grands épisodes «Terre Boule de Neige» à 2,3 Ga («Glaciation Makganyena») et 0,635 («Glaciation Marinoenne»), et d’autres événements glaciaires moins importants ne sont pas reportés ni discutés dans le texte (modifié d’après Knoll 2003). 


ANTARCTIC FRONT TO DELIVER “ONE-IN-15-YEAR WEATHER EVENT” TO NEW SOUTH WALES

by Cap Allon, August 20, 2020 in Electroverse


People do the best they can with the information they have, but it appears to me, and Charles Bukowski, that the problem with the world is that the intelligent people are full of doubt, while the stupid people are full of confidence.

HEAVY SNOW is set to bury large swathes of NSW and the ACT over the next few days in what the Bureau of Meteorology is calling a “one-in-15-year weather event”, and what Electroverse posits is an addition to the ever-mounting pile of evidence which suggests anthropogenic global warming is a politicized, data-spun lie.

A large mass of Antarctic air is on course to blast the eastern half of Australia with blizzards, wild winds, and record-breaking low temperatures as it breaks-away from the ice continent and rides anomalously-far north on the back of a weak & wavy (meridional) jet stream (a phenomenon associated with the historically low solar activity we’re currently receiving).

Let’s Be Serious, More C02 Isn’t Making the Earth ‘Uninhabitable’

by  D. Simon, August 17, 2020 in RealClearMarkets


Former Federal Reserve Board Vice Chairman and Princeton University economist Alan Blinder recently wrote the following in the Wall Street Journal: “cumulative CO2 emissions heat up the atmosphere, causing climate changes of all sorts—most of them bad. Because this huge negative externality has been allowed to run rampant, we are gradually making the Earth an inhospitable place for humans.”

Increasing CO2 emissions have been “making the Earth an inhospitable place for humans?” Really?

A method has been developed to study extreme space weather events

by SKOLKOVO INSTITUTE OF SCIENCE AND TECHNOLOGY (SKOLTECH), August 15, 2020 in WUWT/Rotter


Scientists at Skolkovo Institute of Science and Technology (Skoltech), together with colleagues from the Karl-Franzens University of Graz & the Kanzelhöhe Observatory (Austria), Jet Propulsion Laboratory of California Institute of Technology (USA), Helioresearch (USA) and Space Research Institute of the Russian Academy of Sciences (Russia) developed a method to study fast Coronal Mass Ejections, powerful ejections of magnetized matter from the outer atmosphere of the Sun. The results can help to better understand and predict the most extreme space weather events and their potential to cause strong geomagnetic storms that directly affect the operation of engineering systems in space and on Earth. The results of the study are published in the Astrophysical Journal.

Coronal Mass Ejections are among the most energetic eruptive phenomena in our solar system and the main source of major space weather events. Huge clouds of plasma and magnetic flux are ejected from the atmosphere of the Sun into the surrounding space with speeds ranging from 100 to 3500 km/s. These gigantic solar plasma clouds and the accompanying powerful shock waves can reach our planet in less than a day, causing severe geomagnetic storms posing hazards to astronauts and technology in space and on Earth.

One of the strongest Space Weather events occurred in 1859 when the induced geomagnetic storm collapsed the whole telegraph system in North America and Europe, the main means of communication for business and personal contacts in those days.

“Low-Fact Propaganda”: Spiegel’s Alarmism Exposed (Again), Greenland Ice Not “Doomed”

by P. Gosselin, August 16, 2020 in NoTricksZone


German skeptic site Die Kalte Sonne here debunks a recent alarmist article appearing in Spiegel aimed at shocking its readers. The reality, it turns out, is not shocking at all.

Greenland ice doomed?

According to Spiegel, the Greenland ice sheet is already doomed (that is unless we skip the usual democratic process and just act immediately).

Spiegel claims Greenland “glaciers are continuously losing huge masses of ice” and that the system there is “dramatically off balance”. The leftist Hamburg-based weekly reported:

The melting of the glaciers on Greenland has apparently passed the point of no return. Even if the global rise in temperature were to stop immediately, the ice sheet would continue to retreat, report researchers led by Michalea King of Ohio State University report in the journal “Communications Earth and Environment“.

Read more at Spiegel

4°C warmer 11,000 years ago

But Die kalte Sonne wondered if this were really so, and needed only 2 mouse clicks to find a recent temperature reconstruction for Greenland’s past (Lecavalier et al. 2017, pdf here). The paper’s Figure 4a  shows the temperatures, with the temperature of 1950 at the far right which in paleo-climatology is always meant as “present”.

Thus, 11,000 years ago, it was up to 4°C warmer than in 1950 over long periods of thousands of years, and today the warming has been about 1°C since then. Since we can see an ice sheet of 2,850,000 km³ (that is roughly Gt) today, the “point of no return” cannot have been exceeded 10,000 years ago. How does the heading then come about? We take a look at the associated work by King et al. 2020:


[VIDEO] NEW SOUTH WALES KANGAROOS GO TOE-TO-TOE IN THE SNOW DURING RECORD-BREAKING ANTARCTIC BLAST

by Cap Allon, August 12, 2020 in Electroverse


An Antarctic blast has brought record-breaking low temperatures and blizzard conditions across much of Australia this August, according to the Bureau of Meteorology — and even the kangas appear to have had their fill of it.

he heavy snowfall in New South Wales over recent days led to one lucky local capturing a pair of kangaroos going toe-to-toe in the driving snow:

see video

Extensively-Referenced Study Of Past Scientists’ Global Temperature Estimates Suggests ‘No Change’ In 100 Years

by K. Richard, August 13, 2020 in NoTricksZone


In the early 1900s, the globally-averaged distribution of calculated surface temperature estimates ranged between 14 and 15°C. For 1991-2018, HadCRUT, Berkeley, and NASA GISS also estimate today’s global temperature is about 14.5°C.

Scientists estimating Earth’s surface temperature has been an ongoing pursuit since the early 19th century.

A new study (Kramm et al., 2020) suggests the generally agreed-upon global temperature from 1877 to 1913 from dozens of calculated results was about 14.4°C.

Problematically, HadCRUT, Berkley, and NASA GISS also indicate the 1991-2018 had a global surface temperature of about 14.5°C.

This would suggest there has been “no change in the globally averaged near-surface temperature over the past 100 years”.

Claim: Past evidence supports complete loss of Arctic sea-ice by 2035

by BRITISH ANTARCTIC SURVEY, August 3, 2020 in WUWT/Ch. Rotter


A new study, published this week in the journal Nature Climate Change, supports predictions that the Arctic could be free of sea ice by 2035.

BRITISH ANTARCTIC SURVEY

A new study, published this week in the journal Nature Climate Change, supports predictions that the Arctic could be free of sea ice by 2035.

High temperatures in the Arctic during the last interglacial – the warm period around 127,000 years ago – have puzzled scientists for decades. Now the UK Met Office’s Hadley Centre climate model has enabled an international team of researchers to compare Arctic sea ice conditions during the last interglacial with present day. Their findings are important for improving predictions of future sea ice change.

During spring and early summer, shallow pools of water form on the surface of Arctic sea-ice. These ‘melt ponds’ are important for how much sunlight is absorbed by the ice and how much is reflected back into space. The new Hadley Centre model is the UK’s most advanced physical representation of the Earth’s climate and a critical tool for climate research and incorporates sea-ice and melt ponds.

Using the model to look at Arctic sea ice during the last interglacial, the team concludes that the impact of intense springtime sunshine created many melt ponds, which played a crucial role in sea-ice melt. A simulation of the future using the same model indicates that the Arctic may become sea ice-free by 2035.

Joint lead author Dr Maria Vittoria Guarino, Earth System Modeller at British Antarctic Survey (BAS), says:

“High temperatures in the Arctic have puzzled scientists for decades. …

The Tyranny Of Global Warmists Is Worse Than You Think

by D. Solway, August 11, 2020 in ClimateChangeDispatch


“The more one has paid for a forgery, the more one defends it in the face of all the evidence to the contrary,” writes John Le Carré in his novel about espionage and deception, Smiley’s People.

This certainly seems to be the case with the four major weather-tracking agencies: the Hadley Climate Research Unit in Britain, the Christy group at the University of Alabama, the Remote Sensing Systems Inc. in California, and the NASA Goddard Institute for Space Studies in New York (NASA GISS).

In a previous article for The Pipeline, I examined the malfeasance of the influential Hadley Climate Research Unit at the University of East Anglia in Norwich, where two major email dumps (aka “Climategate”) showed the outfit’s determined efforts to fudge the data, suppress unfavorable results and eliminate dissenting voices.

This should have put the “global warming” farce to bed once and for all, but the deception shows no sign of abating.

Le 20ème siècle a été anormalement chaud mais le 21ème siècle revient à la normale (1/2)

by Jean Van Vliet, 14 août 2020, in ScienceClimatEnergie


Introduction

Suite à la prise de conscience à la fin du 20ème siècle d’une hausse inhabituelle des températures terrestres, des chercheurs américains ont développé une théorie du réchauffement global basé sur l’effet de serre dû au CO2 [1], en soulignant la responsabilité possible de l’homme dans le réchauffement observé: la poursuite des émissions de CO2 conduirait à une éventuelle catastrophe planétaire. Ces  chercheurs ont présenté leur théorie au Congrès américain [2] et aux médias. Le monde politique international a réagi rapidement à cet alarmisme [3] en permettant à Assemblée Générale de l’ONU de décembre 1988 d’approuver la mise en place du GIEC [4].

Depuis plus de trente ans et malgré le manque persistant de preuve formelle, la peur du réchauffement global anthropique causé par le CO2 est propagée sans relâche par l’ONU et ses satellites PNUE, GIEC et OMM relayés par les ONG environnementales et les médias, suivis plus récemment par une fraction du monde académique occidental. Une puissante industrie des énergies renouvelables a été créée via des subsides et des certificats verts quitte à doubler ou tripler le prix de l’électricité. Cette industrie est prête à exploiter les nouvelles aubaines financières annoncées par l’Accord de Paris et le Green Deal de l’UE. Dans un tel contexte, le but avoué est que l’humanité change radicalement son comportement, fût-ce au prix d’une dictature environnementale: l’alarmisme médiatique est maximal, et même les enfants sont embrigadés dans le débat pour soi-disant “sauver la planète”.

Cette tentative rampante de prise du pouvoir a cependant buté contre un obstacle imprévu depuis le début de 2020, à savoir la pandémie du Coronavirus: le lockdown sanitaire a montré que la société pouvait changer son comportement de manière spectaculaire, mais au prix de conséquences économiques et sociales majeures. A la première attaque de la pandémie succède aujourd’hui une deuxième vague et il semble impossible de prévoir quand nous serons délivrés du virus.

Les ressources des Etats n’étant pas infinies, la question brûlante se pose aujourd’hui  de l’affectation des moyens humains et financiers disponibles en fonction nos priorités: devons-nous avoir davantage peur d’une pandémie et de ses conséquences sociales et économiques incontestables ou devons-nous supputer une explosion incontrôlable de la crise climatique amorcée au 20ème siècle et modifiant de manière drastique et irréversible notre environnement ?

Le but du présent article est d’apporter des éléments de réponse à cette question en examinant, dans une perspective scientifique large et basée sur les observations plutôt que sur les modèles, la “crise climatique” démarrée durant la seconde moitié du 20ème siècle en essayant de tirer des conclusions applicables au 21èmesiècle.

1/ La crise ‘climatique du 20ème siècle

Il existe de nombreuses sources fournissant des historiques de température, mais il existe peu de séries chronologiques comparables à celle de l’Observatoire d’Armagh en Irlande du Nord pour la période 1796-2002 [5]; cette série est disponible sur le site web du Met Office britannique pour la période allant de 2002 à aujourd’hui [6].

Figure 1 : Evolution des températures moyennes annuelles de 1796 à 2019 (courbe bleue) ainsi qu’une courbe lissée correspondant à la moyenne glissante rétrospective sur une période de 11 ans (courbe rouge).

Greta Thunberg’s Message Of Doom Is Religion, Not Reality

by I. Martin, August 10, 2020 in ClimateChangeDispatch


In January, the great and not so good of the corporate elite gathered at Davos for another telling off from Greta Thunberg.

“One year ago I came to Davos and told you that our house is on fire,” the climate activist reminded delegates. “I said I wanted you to panic.” In the intervening year they had not panicked enough, she said.

Although the meeting of the World Economic Forum was dedicated to creating a “Cohesive and Sustainable World”, and corporate culture has gone obsessively green, the naughty capitalists and greedy governments refused to end the use of fossil fuels instantly.

Media Blame Isaias On Climate Change – As Hurricane Numbers Decline

by H.S. Burnett, August 10, 2020 in ClimateChangeDispatch


Hurricane Isaias hadn’t even made landfall in the United States before the media began proclaiming Isaias was the result of human-caused climate change.

Not only is there no evidence for such a claim, but hurricane numbers have been declining as global temperatures modestly warm.

Also, even the United Nations Intergovernmental Panel on Climate Change (IPCC) disputes any connection between global warming and hurricanes.

Large Increase In Number Of Sunshine Hours Likely Behind Warming, Glacier Retreat In Alps Since 1980

by P. Gosselin, August 9, 2020 in NoTricksZone

Today global warming alarmists insist blaming climate change on man-made CO2 emissions. Yet, everywhere we look it’s difficult to find any correlation between CO2 and warming. Pre-industrial history shows that changes in CO2 in fact followed temperature changes.

Today we look at some climate charts of the European upper Ostalpen to look for hints what may be behind the warming since the late 20th century. We know glaciers there have been receding over the recent decades.

First is a mean temperature chart of the region for the May to September period going back 133 years:


Chart cropped from video “Die Alpengletscher im Klimawandel: Status quo“, by Günther Aigner


New Study: A Southern Ocean Site Has Just Cooled To Ice Age-Era Temperatures – 2°C Colder Than 20,000 Years Ago

by K. Richard, August 10, 2020 in NoTricksZone


A new temperature reconstruction indicates today’s sea surface temperatures are colder than all but a few millennia out of the last 156,000 years.

A Southern Ocean site analyzed in a new study (Ghadi et al., 2020) has averaged 1-2°C during glacials and 4°C during interglacials. Today, with a 410 ppm CO2 concentration, this location has again plummeted to glacial/ice age levels (2°C).

The site was 2°C warmer than now when CO2 concentrations were 180 ppm about 20,000 years ago, or during the peak of the last ice age. During the Early Holocene (10,000 to 8,000 years ago), summer sea surface temperatures were also 2°C warmer than today.

There is no indication that CO2 concentration changes are in any way correlated with temperature changes throughout this entire 156,000-year epoch.

VICTORY FOR SCIENCE! German Research Foundation Regrets Censorship, Reinstate’s Critic’s Statement

by P. Gosselin, August 7, 2020 in NoTricksZone


After widespread criticism, the German Research Foundation (DFG) has decided to reverse its July 30th decision to take down a dissident climate science statement from prominent German satirist Dieter Nuhr (background here).

The DFG has put Nuhr’s statement back online again after realizing it had blundered when it caved in to activists and had not acted in the interest of science (pdf here).

The German Research Foundation is back, again in favor of diversity of scientific opinion! Image: Galileo fails to change Catholic Church doctrine.

New Study: Rising CO2 Drives Post-1980s Greening…Which Cools The Earth And Offsets 29% Of Human Emissions

by Haverd et al., 2020 in NoTricksZone/K. Richard


About 70% of the Earth’s post-1980s vegetative greening trend has been driven by CO2 fertilization. More greening has offset or reversed 29% of recent anthropogenic CO2 emissions. Greening also has a net cooling effect on surface temperatures.

Earlier this year we highlighted a study (Haverd et al., 2020) asserting rising CO2 and warming are the dominiant drivers of Earth’s strong post-1980s greening trend. This greening expands Earth’s carbon sink so profoundly that by 2100 the greening of the Earth will offset 17 years (equivalent) of anthropogenic CO2 emissions.

A 17% offset over 80 years, or net CO2 emissions reversal, would easily supplant the effectiveness of Paris climate accord CO2 mitigation policies.

Now another new study (Piaoet et al., 2020) expands upon these same principles, further suggesting the net effect of more CO2-driven greening is more cooling and carbon sink expansion.

Since the 1980s, 29% of human CO2 emissions were cancelled out by the CO2-induced greening of the Earth. The post-2000 vegetative greening expansion has been so massive (5.4 million km²) its net areal increase is equivalent to a region the size of the Amazon rainforest.

“Vegetation models suggest that CO2 fertilization is the main driver of greening on the global scale, with other factors being notable at the regional scale. Modelling indicates that greening could mitigate global warming by increasing the carbon sink on land and altering biogeophysical processes, mainly evaporative cooling.”

by Cap Allon, August 7, 2020 in Electroverse


According to official government data from the National Snow & Ice Data Center (NSIDC), 2020’s Antarctic Sea Ice Extent is tracking the 1979-1990 average.

Climate alarmists take note, the ice locked within Antarctica is far more important to your hokey climate theories than that contained in its northern cousin the Arctic.

The Antarctic contains 90% of our planet’s ice, and, therefore, if Antarctica isn’t melting then any potential sea-level rise will be severely limited.

And Antarctica isn’t melting.

According to the latest NSIDC data, sea ice extent around the southern pole has been tracking the 1979-1990 average ALL YEAR:

[nsidc.org/arcticseaicenews/charctic-interactive-sea-ice-graph]

In addition, August 2020’s extent is currently greater than it was in the 1980s:

Mercury Deposition, Climate Change and Anthropogenic Activities: A Review

by Li, F. et al. July 31, 2020 in Front. Earth.Sci.


As a toxic and harmful global pollutant, mercury enters the environment through natural sources, and human activities. Based on large numbers of previous studies, this paper summarized the characteristics of mercury deposition and the impacts of climate change and human activities on mercury deposition from a global perspective. The results indicated that global mercury deposition changed synchronously, with more accumulation during the glacial period and less accumulation during the interglacial period. Mercury deposition fluctuated greatly during the Early Holocene but was stable and low during the Mid-Holocene. During the Late Holocene, mercury deposition reached the highest value. An increase in precipitation promotes a rise in forest litterfall Hg deposition. Nevertheless, there is a paucity of research on the mechanisms of mercury deposition affected by long-term humidity changes. Mercury accumulation was relatively low before the Industrial Revolution ca. 1840, while after industrialization, intensive industrial activities produced large amounts of anthropogenic mercury emissions and the accumulation increased rapidly. Since the 1970s, the center of global mercury production has gradually shifted from Europe and North America to Asia. On the scale of hundreds of thousands of years, mercury accumulation was greater in cold periods and less in warm periods, reflecting exogenous dust inputs. On millennial timescales, the correspondence between mercury deposition and temperature is less significant, as the former is more closely related to volcanic eruption and human activities. However, there remains significant uncertainties such as non-uniform distribution of research sites, lack of mercury deposition reconstruction with a long timescale and sub-century resolution, and the unclear relationship between precipitation change and mercury accumulation.

During The Last Glacial Maximum Fires Were 10 Times More Common And Summer Temps 3-4°C Warmer Than Today

by K. Richard, August 3, 2020 in NoTricksZone


A new study finds that 26 to 19 thousand years ago, with CO2 concentrations as low as 180 ppm, fire activity was an order of magnitude more prevalent than today near the southern tip of Africa – mostly because summer temperatures were 3-4°C warmer.

We usually assume the last glacial maximum – the peak of the last ice age – was signficantly colder than it is today.

But evidence has been uncovered that wild horses fed on exposed grass year-round in the Arctic, Alaska’s North Slope, about 20,000 to 17,000 years ago, when CO2 concentrations were at their lowest and yet “summer temperatures were higher here than they are today” (Kuzmina et al., 2019). Horses had a “substantial dietary volume” of dried grasses year-round, even in winter at this time, but the Arctic is presently “no place for horses” because there is too little for them to eat, and the food there is to eat is “deeply buried by snow” (Guthrie and Stoker, 1990).

In a new study (Kraaij et al., 2020) find evidence that “the number of days per annum with high or higher fire danger scores was almost an order of magnitude larger during the LGM [last glacial maximum, 19-26 ka BP]  than under contemporary conditions” near Africa’s southernmost tip, and that “daily maximum temperatures were 3-4°C higher than present in summer (and 2-4°C lower than present in winter), which would have contributed to the high severity of fire weather during LGM summers.”

Neither conclusion – that surface temperatures would be warmer or that fires would be more common – would seem to be consistent with the position that CO2 variations drive climate or heavily contribute to fire patterns.

World’s Largest Meteorite

by Geology Page, January 8, 2017


Name: Hoba “This is an OFFICIAL meteorite name”
Abbreviation: There is no official abbreviation for this meteorite.
Observed fall: No
Year found: 1920
Country: Namibia
Mass: 60 tons

The Hoba or Hoba West meteorite lies on the farm “Hoba West”, not far from Grootfontein, in the Otjozondjupa Region of Namibia. It has been uncovered but, because of its large mass, has never been moved from where it fell. The main mass is estimated at more than 60 tons, making it the largest known meteorite (as a single piece) and the most massive naturally occurring piece of iron known on Earth’s surface.

Impact

The Hoba meteorite impact is thought to have occurred more recently than 80,000 years ago. It is inferred that the Earth’s atmosphere slowed the object to the point that it impacted the surface at terminal velocity, thereby remaining intact and causing little excavation.

Assuming a drag coefficient of about 1.3, the meteor would have been slowed to about 720 miles per hour (0.32 km/s) from its speed on entering the Earth’s atmosphere, typically in excess of 10 km/s for similar objects. The meteorite is unusual in that it is flat on both major surfaces, possibly causing it to have skipped across the top of the atmosphere like a flat stone skipping on water.

Read more : http://www.geologypage.com/2017/01/worlds-largest-meteorite.html#ixzz6U2Q7UUR8
Follow us: @geologypage on Twitter | geologypage on Facebook

First Time In 70 Years No Pacific Typhoon Forms In July… Alarmists Alarmed Typhoon Trend Falling!

by P. Gosselin, Ausgust 1, 2020 in NoTricksZone


This year is the first time since 1951 the Pacific sees no typhoons in the month of July. Typhoons have seen downward trend since 1951. 

Global warming alarmists like to claim that tropical storms will intensify and become more frequent unless people stop using fossil fuels.

And recently these alarmists have had our attention steered to the Atlantic basin, where tropical storms this year have seen quite an active season thus far.

Another reason the focus has been on the Atlantic is because very little has been happening in terms of Pacific typhoons, and the alarmists don’t want to talk about that.

In fact this July is the first July to have seen no typhoons formed in the Pacific at all since statistics on this began in 1951, according to the data from the Japan Meteorological Agency (JMA).

Data source: JMA, here and here

Normally between 3 to 4 typhoons form in the Pacific in July. Up to 8 have formed in the past, e.g. on 2017 and 1971. But this year July failed to see a single typhoon form – the first time this has occurred since 1951.

Satellite survey shows California’s sinking coastal hotspots

by Arizona State University, August 2, 2020 in WUWT


A majority of the world population lives on low lying lands near the sea, some of which are predicted to submerge by the end of the 21st century due to rising sea levels.

The most relevant quantity for assessing the impacts of sea-level change on these communities is the relative sea-level rise – the elevation change between the Earth’s surface height and sea surface height. For an observer standing on the coastland, relative sea-level rise is the net change in the sea level, which also includes the rise and fall of the land beneath observer’s feet.

Now, using precise measurements from state-of-the-art satellite-based interferometric synthetic aperture radar (InSAR) that can detect the land surface rise and fall with millimeter accuracy, an Arizona State University research team has, for the first time, tracked the entire California coast’s vertical land motion.

They’ve identified local hotspots of the sinking coast, in the cities of San Diego, Los Angeles, Santa Cruz and San Francisco, with a combined population of 4 to 8 million people exposed to rapid land subsidence, who will be at a higher flooding risk during the decades ahead of projected sea-level rise.

“We have ushered in a new era of coastal mapping at greater than 1,000 fold higher detail and resolution than ever before,” said Manoochehr Shirzaei, who is the principal investigator of the NASA-funded project. “The unprecedented detail and submillimeter accuracy resolved in our vertical land motion dataset can transform the understanding of natural and anthropogenic changes in relative sea-level and associated hazards.”

The results were published in this week’s issue of Science Advances (DOI link here).

NASA “CLIMATE PROPHET” JAMES HANSEN SAID THE ARCTIC WOULD BE “FREE OF SUMMER ICE” BY 2018

by Cap Allon, August 2, 2020 in Electroverse


Bolstered by the sycophantic-praise he received following his 1988 Congressional testimony on man-made global warming, NASA climate scientist/activist James Edward Hansen continued his prophesies well into the 2000s–despite his ever-growing list of climate fails.

“The greenhouse effect is here,” pronounced doomsayer Hansen back on June 23, 1988.

“We’re [still] toast,” he repeated with a straight face 20 years later, in 2008.

in preparation for his 1988 Congressional testimony, scientists/activist Hansen produced three potential scenarios regarding the future trend for global average temperatures:

A) “Business As Usual” — if human’s did nothing regarding rising CO2 levels.

B) If we “moderately” reduced CO2 emissions.

C) If atmospheric carbon dioxide was reduced to year 2000 levels.


Real-world observations reveal Hansen’s projections were way off. Scenarios A and Bsignificantly over-predict the warming trend. And digging into the data, A overstates CO2 and other greenhouse gas growth and rejects against the observations; Scenario B slightly understates CO2 growth, overstates methane and CFCs and zeroes-out other greenhouse gas growth, and it too significantly overstates the warming.

The scenario that best-matches the observations is C — the one where Hansen has CO2 topping-out at 368 ppm in 2000 but then sees it fixed at that level thereafter–something that obviously didn’t happen. It’s this drastic “halt the industrial revolution” scenario that ended up with a warming trend most like the real-world observations.

Here is one thought, proposed by climate scientist John Christy:

Suppose Hansen had offered a Scenario D, in which greenhouse gases continue to rise, but after the 1990s they have very little effect on the climate. That would play out similarly in his modeled Scenario C, and it would match the data — this hypothetical Scenario D is the reality we’re living today.

James Edward Hansen is still considered a “climate prophet” by many, but his 1988 scenarios simply DO NOT FIT THE DATA–speaking of which, let’s look at his Arctic sea ice predictions.