by C. Kennedy, Oct 29, 2020 in NOAAClimate.gov
No, “global warming” means Earth’s averageannual air temperature is rising, but not necessarily in every single location during all seasons across the globe. It’s like your grades. If one semester you get all Bs and Cs, and the next you get all As and Cs, your grade point average rises, even though you didn’t improve in every class.
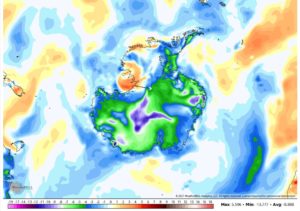
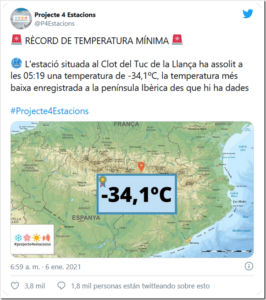
That’s the way it is with Earth’s near-surface temperature as atmospheric greenhouse gas levels climb. Temperature trends across the entire globe aren’t uniform because of the diverse geography on our planet—oceans versus continents, lowlands versus mountains, forests versus deserts versus ice sheets—as well as natural climate variability. When you’re zoomed in on a particular place, you may not be able to see the overall trend.
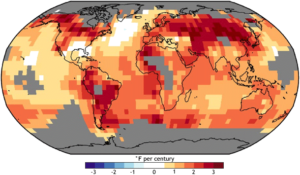
It is only when scientists calculate the average of temperature changes from every place on Earth over the course of a year to produce a single number, and then look at how that number has changed over time that a very clear, global warming trend emerges. In other words, it’s only when we “zoom out” to the planet-wide scale that the trend is obvious: despite a few, rare areas experiencing an overall cooling trend, the vast majority of places across the globe are warming.
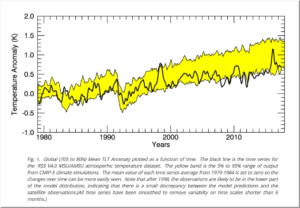
The reason a “zoomed out” view makes the long-term trend so clear is that Earth’s annual average temperatures from year to year are found to be very stable when nothing is forcing it to change. Today, though, every decade since 1960 has been warmer than the last, and the last three decades each have been the warmest on record. Relative to geologic time, the warming that has occurred—1.8°F (1°C) over a span of about 120 years—is an unusually large temperature change in a relatively short span of time.
…