Tous les articles par Alain Préat

Full-time professor at the Free University of Brussels, Belgium apreat@gmail.com apreat@ulb.ac.be • Department of Earth Sciences and Environment Res. Grp. - Biogeochemistry & Modeling of the Earth System Sedimentology & Basin Analysis • Alumnus, Collège des Alumni, Académie Royale de Sciences, des Lettres et des Beaux Arts de Belgique (mars 2013). http://www.academieroyale.be/cgi?usr=2a8crwkksq&lg=fr&pag=858&rec=0&frm=0&par=aybabtu&id=4471&flux=8365323 • Prof. Invited, Université de Mons-Hainaut (2010-present-day) • Prof. Coordinator and invited to the Royal Academy of Sciences of Belgium (Belgian College) (2009- present day) • Prof. partim to the DEA (third cycle) led by the University of Lille (9 universities from 1999 to 2004) - Prof. partim at the University of Paris-Sud/Orsay, European-Socrates Agreement (1995-1998) • Prof. partim at the University of Louvain, Convention ULB-UCL (1993-2000) • Since 2015 : Member of Comité éditorial de la Revue Géologie de la France http://geolfrance.brgm.fr • Since 2014 : Regular author of texts for ‘la Revue Science et Pseudosciences’ http://www.pseudo-sciences.org/ • Many field works (several weeks to 2 months) (Meso- and Paleozoic carbonates, Paleo- to Neoproterozoic carbonates) in Europe, USA (Nevada), Papouasia (Holocene), North Africa (Algeria, Morrocco, Tunisia), West Africa (Gabon, DRC, Congo-Brazzaville, South Africa, Angola), Iraq... Recently : field works (3 to 5 weeks) Congo- Brazzaville 2012, 2015, 2016 (carbonate Neoproterozoic). Degree in geological sciences at the Free University of Brussels (ULB) in 1974, I went to Algeria for two years teaching mining geology at the University of Constantine. Back in Belgium I worked for two years as an expert for the EEC (European Commission), first on the prospecting of Pb and Zn in carbonate environments, then the uranium exploration in Belgium. Then Assistant at ULB, Department of Geology I got the degree of Doctor of Sciences (Geology) in 1985. My thesis, devoted to the study of the Devonian carbonate sedimentology of northern France and southern Belgium, comprised a significant portion of field work whose interpretation and synthesis conducted to the establishment of model of carbonate platforms and ramps with reefal constructions. I then worked for Petrofina SA and shared a little more than two years in Angola as Director of the Research Laboratory of this oil company. The lab included 22 people (micropaleontology, sedimentology, petrophysics). My main activity was to interpret facies reservoirs from drillings in the Cretaceous, sometimes in the Tertiary. I carried out many studies for oil companies operating in this country. I returned to the ULB in 1988 as First Assistant and was appointed Professor in 1990. I carried out various missions for mining companies in Belgium and oil companies abroad and continued research, particularly through projects of the Scientific Research National Funds (FNRS). My research still concerns sedimentology, geochemistry and diagenesis of carbonate rocks which leads me to travel many countries in Europe or outside Europe, North Africa, Papua New Guinea and the USA, to conduct field missions. Since the late 90's, I expanded my field of research in addressing the problem of mass extinctions of organisms from the Upper Devonian series across Euramerica (from North America to Poland) and I also specialized in microbiological and geochemical analyses of ancient carbonate series developing a sustained collaboration with biologists of my university. We are at the origin of a paleoecological model based on the presence of iron-bacterial microfossils, which led me to travel many countries in Europe and North Africa. This model accounts for the red pigmentation of many marble and ornamental stones used in the world. This research also has implications on the emergence of Life from the earliest stages of formation of Earth, as well as in the field of exobiology or extraterrestrial life ... More recently I invested in the study from the Precambrian series of Gabon and Congo. These works with colleagues from BRGM (Orléans) are as much about the academic side (consequences of the appearance of oxygen in the Paleoproterozoic and study of Neoproterozoic glaciations) that the potential applications in reservoir rocks and source rocks of oil (in collaboration with oil companies). Finally I recently established a close collaboration with the Royal Institute of Natural Sciences of Belgium to study the susceptibility magnetic signal from various European Paleozoic series. All these works allowed me to gain a thorough understanding of carbonate rocks (petrology, micropaleontology, geobiology, geochemistry, sequence stratigraphy, diagenesis) as well in Precambrian (2.2 Ga and 0.6 Ga), Paleozoic (from Silurian to Carboniferous) and Mesozoic (Jurassic and Cretaceous) rocks. Recently (2010) I have established a collaboration with Iraqi Kurdistan as part of a government program to boost scientific research in this country. My research led me to publish about 180 papers in international and national journals and presented more than 170 conference papers. I am a holder of eight courses at the ULB (5 mandatory and 3 optional), excursions and field stages, I taught at the third cycle in several French universities and led or co-managed a score of 20 Doctoral (PhD) and Post-doctoral theses and has been the promotor of more than 50 Masters theses.

Mann, Hayhoe Try To Erase To The Pesky Medieval Warm Period

by J. Taylor, October 3, 2019 in ClimateChangeDispatch


Climate alarmists Michael Mann and Katharine Hayhoe have been caught using dubious, revisionist temperature data in their attempt, as one Climategate email author put it,  to “deal a mortal blow” to the extensively documented Medieval Warm Period.

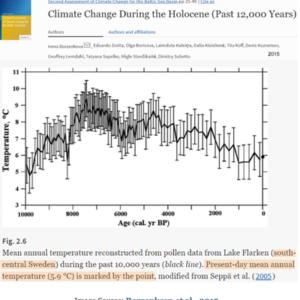
Before climate change became a political issue, it was scientifically well-established that a significant global warming event occurred between approximately 900 AD and 1200 AD.

For example, the United Nations Intergovernmental Panel on Climate Change (IPCC) First Assessment Report presented a temperature history and visual graph documenting that the Medieval Warm Period existed and that it brought temperatures at least as warm as today (at pg. 7).

Multiple peer-reviewed studies provided additional confirmation of the Medieval Warm Period.

The warming climate of the Medieval Warm Period spurred abundant crop production, fewer extreme droughts and floods, a growing human population, and improving living standards.

The Little Ice Age terminated the Medieval Warm Period and brought devastating weather extremes, widespread crop failures, famines, plagues like the Black Death, and a contracting human population.

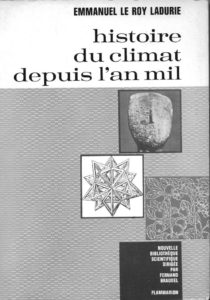
For a good summary of the extensive benefits of the Medieval Warm Period and the devastating harms of the Little Ice Age, see the excellent book, “In the Wake of the Plague: The Black Death and the World It Created.”

55 New (2019) Scientific Papers Link Solar Activity To Climate Change

by K. Richard, October 3, 2019 in NoTricksZone


In the last few years, hundreds of peer-reviewed scientific papers have been published linking changes in solar activity to Earth’s climate (2016, 2017, 2018). The evidence for a robust Sun-Climate connection continues to accumulate in 2019.

When it comes to the Sun’s influence on climate, one conclusion is certain: there is no widespread scientific agreement as to how and to what extent solar activity and its related parameters (i.e., galactic cosmic rays, geomagnetic activity, solar wind flux) impact changes in the Earth’s temperature and precipitation.

The disagreement is so chasmic and the mechanisms are so poorly understood that scientists’ estimates of the influence of direct solar irradiance forcing between the 17th century and today can range between a negligible +0.1 W m-2 to a very robust +6 W m-2 (Egorova et al., 2018Mazzarella and Scafetta, 2018).

There is no consensus on the amplitude of the historical solar forcingThe estimated magnitude of the total solar irradiance difference between Maunder minimum and present time ranges from 0.1 to 6 W/m2 making uncertain the simulation of the past and future climate.”  (Egorova et al., 2018)
“According to the IPCC (2013), solar forcing is extremely small and cannot induce the estimated 1.0–1.5 °C since the LIA. However, thesolar radiative forcing is quite uncertain because from 1700 to 2000 the proposed historical total solar irradiance reconstructions vary greatly from a minimum of 0.5 W/m2 to a maximum of about 6 W/m2 (cf..: Hoyt and Schatten 1993; Wang et al. 2005; Shapiro et al. 2011). Moreover, it is believed that the sun can influence the climate also via a magnetically induced cosmic ray flux modulation (e.g.: Kirkby 2007) or via heliospheric oscillation related to planetary resonances (e.g.: Scafetta 2013, 2014b; Scafetta et al. 2016, and others). Since solar and climate records correlate quite significantly throughout the Holocene (cf: Kerr 2001; Steinhilber et al. 2012; Scafetta 2012, 20104b), the results shown herein may be quite realistic, although the exact physical mechanisms linking astronomical forcings to climate change are still poorly understood.”  (Mazzarella and Scafetta, 2018)”

Coal to remain ‘King’ in Southeast Asia

by David Middleton, October 4, 2019 in WUWT


‘Coal is still king’ in Southeast Asia even as countries work toward cleaner energy
PUBLISHED MON, SEP 30 2019
Huileng Tan

KEY POINTS

• Not only will coal continue to be the dominant fuel source in power generation in Southeast Asia, its use will grow and peak in 2027 before slowing, according to a Wood Mackenzie study.

• The Indonesian government has targeted generating 23% of electricity from renewable sources by 2025 — almost double the 12% now, but it will be “difficult to achieve because capacity expansion plans are still dominated by coal,” Moody’s analysts say.

• Global coal demand grew for a second straight year to reach 0.7% in 2018, International Energy Agency data shows.

Coal is still a dominant fuel in the rapidly growing economies of Southeast Asia, even amid a general global move toward cleaner energy sources, data from several recent reports show.

Figure 1. Global coal consumption by region (million tonnes of oil equivalent per year). BP Statistical Review of World Energy 2019.

NEW ZEALAND EXPERIENCES FOURTH COLDEST SEPTEMBER THIS CENTURY

by Cap Allon, October 4, 2019 in Electroverse


New Zealand’s average temperature last month –for the country as a whole– was below the 1981-2010 September avg., Niwa has said in its Monthly Climate Summary.

An unusual warming of the atmosphere high above Antarctica –called a Sudden Stratospheric Warming event (SSW)– assisted in making last month the fourth coldest September in New Zealand this century.

There have only ever been two SSWs recorded in the Southern Hemisphere, previous to this years — one in September 2002 (major) and another in September 2010 (minor).

The 2002 SSW event resulted in New Zealand experiencing a significant cold outbreak in October while the 2010 event was associated with record rainfall during September.

Record Antarctic Stratospheric Warming Causes Sept. 2019 Global Temperature Update Confusion

by Roy Spencer, October 4, 2019 in WUWT


While the vast majority of our monthly global temperature updates are pretty routine, September 2019 is proving to be a unique exception. The bottom line is that there is nothing wrong with the UAH temperatures we originally reported. But what I discovered about last month is pretty unusual.

It all started when our global lower tropospheric (LT) temperature came in at an unexpectedly high +0.61 deg. C above the 1981-2010 average. I say “unexpected” because, as WeatherBell’s Joe Bastardi has pointed out, the global average surface temperature from NOAA’s CFS model had been running about 0.3 C above normal, and our numbers are usually not that different from that model product.

[By way of review, the three basic layers we compute average temperatures from the satellites are, in increasing altitude, the mid-troposphere (MT), tropopause region (TP), and lower stratosphere (LS). From these three deep layer temperatures, we compute the lower tropospheric (LT) product using a linear combination of the three main channels, LT = 1.548MT – 0.538TP +0.01LS.]

Yesterday, John Christy noticed that the Southern Hemisphere was unusually warm in our lower stratosphere (LS) temperature product, while the Northern Hemisphere was unusually cool. This led me to look at the tropical results for our mid-troposphere (MT) and ‘tropopause’ (TP) products, which in the tropics usually track each other. A scatterplot of them revealed September 2019 to be a clear outlier, that is, the TP temperature anomaly was too cool for the MT temperature anomaly.

So, John put a notice on his monthly global temperature update report, and I added a notice to the top of my monthly blog post, that we suspected maybe one of the two satellites we are currently using (NOAA-19 and Metop-B) had problems.

As it turns out, there were no problems with the data. Just an unusual regional weather event that produced an unusual global response.

RECORDS CONTINUE TO FALL ACROSS THE NW + MORE HISTORIC COLD SET TO ENGULF ALL OF NORTH AMERICA BY OCT 10

by Cap Allon, October 3, 2019 in Electroverse


This weekend will mark the final phase of a major winter storm that ravaged the NW U.S. bringing whipping winds to the Flathead Valley, feet of snow along the Continental Divide and record-breaking/challenging temps for all.

A new all-time daily record low temperature was set in Kalispell, Montana on Wednesday, October 02 as the mercury plunged into the teens across the region.

The weather station at Glacier Park International Airport recorded a low of 19F (-7.2C) at 5 AM which busted the dates previous record low of 21F (-6.1C) set back in 1999.

Great Falls, Montana registered a record-smashing 9F (-12.8C) on Tue, Oct 01, according to the NWS, which annihilated the previous daily low of 22F (-5.6C) set back in 1959.

Additionally, areas to the northwest also saw record low daily temperatures on Tuesday as both Cut Bank and Browning comfortably surpassed their previous cold records from 1950.

And further south, crossing a few state lines into California, temperatures at Sacramento Executive Airport dropped to 42F (5.6C) early Wednesday morning, surpassing the old record of 43F (6.1C) set in 1971. Meaning that in less than a week, Sacramento has now set multiple all-time record lows; on Sunday, both downtown Sacramento and the airport set record lows of 45F (7.2C) and 46F (7.8C) respectively.

Global Temperature Report: September 2019

by Anthony Watts, October 3, 2019 in WUWT


Global climate trend since Dec. 1 1978: +0.13 C per decade

September Temperatures (preliminary)

Global composite temp.: +0.61 C (+1.10 °F) above seasonal average

Northern Hemisphere.: +0.64 C (+1.15 °F) above seasonal average

Southern Hemisphere.: +0.58 C (+1.00°F) above seasonal average

Tropics.: +0.60 C (+1.08°F) above seasonal average

August Temperatures (final)

Global composite temp.: +0.38 C (+0.68 °F) above seasonal average

Northern Hemisphere.: +0.33 C (+0.59 °F) above seasonal average

Southern Hemisphere.: +0.44 C (+0.79°F) above seasonal average

Tropics.: +0.45 C (+0.81 °F) above seasonal average

Notes on data released October 3, 2019 (v6.0)

September’s globally-averaged, bulk-layer atmospheric temperature anomaly of +0.61°C (+1.10°F) represented the warmest September reading of the past 41 Septembers in our satellite record. The jump from August was substantial (+0.23°C) and ranks among the largest month-to-month changes. (Several previous jumps were greater than 0.3°C however.) The warmth was global in extent with warmest September temperatures posted for both hemispheres and the tropical belt. This month-to-month heating is possibly related, at least in part, to the tropical Pacific Ocean’s loss of heat energy to the atmosphere in the recent months as El Niño conditions declined.

Emmanuel Le Roy Ladurie A (re)lire absolument…

by Alain Préat,  3 octobre 2019 inScienceClimatEnergie


S’il est un livre, et un des premiers, à s’être penché de manière aussi détaillée sur l’évolution (récente) du climat, c’est celui d’Emmanuel Le Roy Ladurie ‘Histoire du climat depuis l’an mil’, publié en 1967.

Rappelons cependant le livre précurseur de Joseph-Jean-Nicolas Fuster publié en 1845 et récemment analysé ici même à SCE (et toujours disponible, voir ici).


1/ Introduction

A lire ou relire ce livre de 366 pages (Figure 1), on ne peut qu’être stupéfié par l’analyse rigoureuse qui met en évidence la variabilité naturelle du climat aux échelles pluriséculaire et décennale, qui décortique et privilégie  avec finesse le caractère local du climat par rapport à un climat global et fournit à partir d’indicateurs fiables des fourchettes de températures pour les variations climatiques observées à l’échelle pluriséculaire.

 Figure 1. Histoire du climat depuis l’an mil, Flammarion, publié en 1967

Avant d’aborder ce sujet en détail, il semble qu’aucun modèle sorti des ‘computers’ (GIEC) n’ait été jusqu’à présent capable de rendre compte des évolutions rapportées dans le livre d’ Emmanuel Le Roy Ladurie, ces modèles se prétendent ‘globaux’, contrairement à la conclusion du livre en question qui insiste particulièrement sur le caractère local des climats. Enfin il s’agit d’un livre de 366 pages bien illustré (photographies, cartes et graphiques) dans lequel il n’est pas mentionné une seule fois ‘le poison’ des temps modernes, à savoir le CO2. L’auteur, en 1967 (faut-il le rappeler …), propose ou explore quand  même des pistes pour rendre compte de la succession d’épisodes ‘froids’ et ‘chauds’, tout au long de ces 1000 années d’histoire, qui en fait  débutent il y a 3500 ans (mais pour ces temps historiques plus reculés, les données fiables sont moins nombreuses).


2/ Alors que dit Emmanuel Le Roy Ladurie ?

Net-Zero Carbon Dioxide Emissions By 2050 Requires A New Nuclear Power Plant Every Day

by Roger Pielke, Sep. 30, 2019 in WUWT


I research and write about science, policy and politics.

More than a decade ago, Gwyn Prins and Steve Rayner characterized climate policy as an “auction of promises” in which politicians “vied to outbid each other with proposed emissions targets that were simply not achievable.” For instance, among Democrats competing for the presidency in 2020, several, including Joe Biden, have committed to achieving net-zero carbon dioxide emissions by 2050. Candidate Andrew Yang bid 2049, and Cory Booker topped that by offering 2045. Bernie Sanders has offered a 71% reduction by 2030.

One reason that we see this “auction of promises” is that the targets and timetables for emissions reductions are easy to state but difficult to comprehend. Here I’ll present what net-zero carbon dioxide emissions for 2050 actually means in terms of the rate of deployment of carbon-free energy and the coincident decommissioning of fossil fuel infrastructure.

To conduct this analysis I use the BP Statistical Review of World Energy, which presents data on global and national fossil fuel consumption in units called “million tons of oil equivalent” or mtoe. In 2018 the world consumed 11,743 mtoe in the form of coal, natural gas and petroleum. The combustion of these fossil fuels resulted in 33.7 billion tonnes of carbon dioxide emissions. In order for those emissions to reach net-zero, we will have to replace about 12,000 mtoe of energy consumption expected for 2019. (I ignore so-called negative emissions technologies, which do not presently exist at scale.)

Another useful number to know is that there are 11,051 days left until January 1, 2050. To achieve net-zero carbon dioxide emissions globally by 2050 thus requires the deployment of >1 mtoe of carbon-free energy consumption (~12,000 mtoe/11,051 days) every day, starting tomorrow and continuing for the next 30+ years. Achieving net-zero also requires the corresponding equivalent decommissioning of more than 1 mtoe of energy consumption from fossil fuels every single day.

Another important number to consider is the expected increase in energy consumption in coming decades. The International Energy Agency currently projects that global energy consumption will increase by about 1.25% per year to 2040. That rate of increase in energy consumption would mean that the world will require another ~5,800 mtoe of energy consumption by 2050, or about another 0.5 of an mtoe per day to 2050. That brings the total needed deployment level to achieve net-zero emissions to about 1.6 mtoe per day to 2050.


The scale of the challenge to achieve net-zero carbon dioxide emissions in 2050. Roger Pielke Jr., BP 2018

2019 Arctic Ice Demise Deferred Again

by Ron Clutz, October 2, 2019 in ScienceMatters


MASIE daily results for September show 2019 early melting followed by an early stabilizing and refreezing.

Note that 2019 started the month about 800k km2 below the 12 year average (2007 through 2018 inclusive).  There was little additional loss of ice, a rise then a dip below 4 M km2, and a sharp rise ending the month.  Interestingly, 2019 matched the lowest year 2012 at the start, but ended the month well ahead of both 2012 and 2007.

The table for day 273 shows distribution of ice across the regions making up the Arctic ocean.

Trois solutions (et demie) pour le climat

by Prof. Samuel Furfari, 3 octobre 2019 in L’Echo


“Après avoir travaillé pendant plus de 40 ans dans le domaine, mon expérience me pousse à plaider pour une analyse factuelle et objective de la situation, même si elle peut paraître iconoclaste dans le climat actuel…’

Les feux des projecteurs de l’Assemblée générale de l’ONU s’étant éteints, il est temps de voir plus sereinement la situation en matière de politique climatique — et donc énergétique – qui menace dangereusement notre démocratie. Après avoir travaillé pendant plus de 40 ans dans le domaine, mon expérience me pousse à plaider pour une analyse factuelle et objective de la situation, même si elle peut paraître iconoclaste dans le climat actuel.

Malgré l’opinion générale, et de certains scientifiques, la science du climat est très jeune. Affirmer que “tout est connu et qu’il n’y a plus qu’à agir” est donc prématuré. Le rapport du GIEC est rempli de conditionnels. Pas de certitudes, mais des hypothèses loin d’être irrécusables, puisque le système climatique possède “une signature chaotique“.

Lorsque durant la vague de chaleur de cet été, le climatologue français Jean Jouzel annonce que la température augmentera de “trois ou quatre” degrés, il omet d’ajouter que le GIEC assortit cette hypothèse d’une probabilité de 1% et que c’est pour un maximum de 3°C et non de 4°C ou de 7°C comme on l’entend parfois.

‘There is no climate emergency,’ hundreds of scientists, engineers tell U.N.

by P. Homewood, October 2, 2019 in NotaLotofPeopleKnowThat


Lost amid the coverage of Swedish teen activist Greta Thunberg at last week’s U.N. Global Climate Summit were the 500 international scientists, engineers and other stakeholders sounding a very different message: “There is no climate emergency.”

The European Climate Declaration, spearheaded by the Amsterdam-based Climate Intelligence Foundation [CLINTEL], described the leading climate models as “unfit” and urged UN Secretary-General Antonio Guterres to pursue a climate policy based on “sound science.”

“Current climate policies pointlessly and grievously undermine the economic system, putting lives at risk in countries denied access to affordable, reliable electrical energy,” said the Sept. 23 letter signed by professionals from 23 countries.

Most of the signers hailed from Europe, but there were also scientists from the United States, Canada, Australia, New Zealand and South America.

“We urge you to follow a climate policy based on sound science, realistic economics and genuine concern for those harmed by costly but unnecessary attempts at mitigation,” the letter said.

Full story here.

Eocene Climatic Optima: Another Clean Kill of Carbon Dioxide-Driven Climate Change Hypothesis?

by David Middleton, September 30, 2019 in WUWT


Key points

  1. The Eocene was, on average, 4–15 °C warmer than today.
  2. Atmospheric CO2 was very likely in the 450-600 ppm range.
  3. Modern climate models would require 4,500 ppm CO2 to simulate the Eocene temperature range;
  4. And/or a climate sensitivity of 4-8 °C per doubling;
  5. And/or “that other climate forcings were stronger than previously assumed”.

They totally missed the most obvious reason why just about every effort to gin up a paleo example of CO2-driven climate change falls apart: Atmospheric CO2 is not a primary driver of climate change over geologic time. This wouldn’t mean that it isn’t a greenhouse gas or that it has no effect on temperature. It would simply mean that it was a relatively minor climate driver, like volcanic eruptions.

At some point over the past 30 years or so, the assumption that CO2 drives modern climate change has become a paradigm. And I think we have seen a rare failure in the application of the geologic principle of Uniformitarianism.

Uniformitarianism is often incorrectly cited as the reason geologists were slow to accept plate tectonics, the impact theory of the K-Pg extinction and why the hypotheses for a Younger Dryas impact and abiotic oil are generally unaccepted. However, Uniformitarianism may be why a CO2-driven climate paradigm appears to have come into wide acceptance, at least in academia.

Figure 3a. Marine pCO2 (foram boron δ11B, alkenone δ13C), atmospheric CO2 from plant stomata (green and yellow diamonds with red outlines), Mauna Loa instrumental CO2 (thick red line) and Cenozoic temperature change from benthic foram δ18O (light gray line).


New Study: Modern Arctic Sea Ice Cover Is Present MONTHS Longer Than Nearly All Of The Last 8000 Years

by Caron et al., 2019, 30 Sep. 2019 in NoTricksZone


A new reconstruction of Arctic (NW Greenland) sea ice cover (Caron et al., 2019) reveals modern day sea ice is present multiple months longer than almost any time in the last 8000 years…and today’s summer sea surface temperatures s are among the coldest of the Holocene.
Yet another new study (Caron et al., 2019) shows today’s Arctic sea ice cover is still quite extensive when compared to the last several thousand years, when CO2 concentrations ranged between 260 and 270 ppm.

Other new Arctic sea ice reconstructions from the north of Iceland (Harning et al., 2019) and Barents Sea (Berben et al., 2019) regions indicate a) modern sea ice extent has changed very little in the last several hundred years, or since the Little Ice Age, and b) the Early Holocene had millennial-scale periods of sea-ice-free and open water conditions, which is in stark contrast to “modern conditions” – the “highest value” or furthest extent of the sea ice record.

[T]he PBIP25 values [proxy for sea ice presence] reach their highest value (0.87) of the record at ca. 0 cal yr BP. An increase in PBIP25 suggests a further extension in sea ice cover, reflecting Arctic Front conditions (Müller et al., 2011), most similar to modern conditions.” (Berben et al., 2019)


Greta’s Soros Connections

by P. Homewood, 28 Sep. 2019 in NotaLotofPeopleKnowThat


Andrew Bolt is not afraid to tell the truth about our Greta. It is a pity that the media here have not got the courage to do the same…


16-year-old climate change activist Greta Thunberg has quickly risen to become one of the world’s most prominent political leaders, inspiring a mass movement of millions seemingly out of thin air to combat the problem of global warming.


However, the young girl’s sudden ascent to prominence is not happening by chance. She has deep connections to the globalist elite and activist parents who are supporters of the far-left domestic terrorist group ANTIFA.


Thunberg’s frequent handler is Luisa-Marie Neubauer, an operative from the ONE Movement. Neubauer can be seen behind Thunberg at many of her public events.


Why Haven’t the Tropics Warmed Much? A Tantalizing Piece of Evidence

by Dr. Roy Spencer, Sep. 28, 2019 in WUWT


The radiative resistance to global temperature change is what limits the temperature change in response to radiative forcing from (say) increasing CO2, or the sun suddenly deciding to pump out a 1 percent more sunlight.

If the climate system sheds only a little extra energy with warming, it warms even more until radiative energy balance is restored. If it sheds a lot of energy, then very little warming is required to restore global energy balance. This is the climate sensitivity holy grail, and it will determine just how much warming results from increasing CO2 in the atmosphere.

John Christy and I are preparing a paper based upon Dept. of Energy-sponsored research explaining why the tropical troposphere hasn’t warmed as much in nature as in climate models. (The discrepancy exists for surface temperature trends; for both RSS and UAH tropical tropospheric trends; as well as for global reanalysis datasets). Danny Braswell and I did a lot of research on this subject about 5-10 years ago, and published several papers.

Without going into the gory details of why it is so difficult to measure “feedbacks” (how strong the climate system radiatively resists a temperature change in response to radiative forcing), I’m going to present one graph of new results from our work that suggests where the problem with the models might be.

Le Précambrien : les bactéries, la tectonique des plaques et l’oxygène (2/2)

by Alain Préat, 25 septembre 2019 in Science-Climat-Energie


Résumé : L’oxygène n’est pas apparu aussi brutalement qu’on le pensait sur notre planète (nb: première partie 1/2, ici).

Malgré un apport en oxygène lié aux cyanobactéries dès l’Archéen, ce ne se sont pas ces microorganismes qui sont à la base de la première grande ‘révolution’ de l’oxygène qui a eu lieu à la limite Archéen/Paléoprotérozoïque (il y a 2,5 milliards d’années) dans l’atmosphère, lors du Grand Evénement d’Oxydation. Ce sont les processus liés au cycle de la tectonique des plaques (activité mantellique et périodes intenses d’érosion/altération) qui ont contribué de manière déterminante à l’augmentation de la concentration de l’oxygène atmosphérique vers 2,5 milliards d’années. Les deux principaux processus responsables de cette augmentation sont liés à l’enfouissement de la matière organique et de la pyrite (= FeS2). L’altération des séries riches en ces deux composants conditionnera ensuite pendant près d’un milliard d’années la composition chimique des océans en oxygène, soufre et fer. Au cours du temps, l’oxygène proviendra de l’activité des cyanobactéries et l’atmosphère réductrice du début de l’Archéen sera remplacée par une atmosphère oxydante à la fin du Précambrien.

Abstract : Oxygen did not appear as abruptly as we thought on our planet.

Despite an oxygen supply related to cyanobacteria, since the Archean, it is not these microorganisms that are at the base of the first great oxygen revolution that took place at the Archean/Paleoproterozoic boundary (2.5 billion years) in the atmosphere during the Great Oxidation Event. Two processes related to the cycle of plate tectonics (mantle activity and intense periods of erosion/weathering) were mostly involved in the increase of the of atmospheric oxygen concentration 2.5 billion years ago. These two main processes are related to the burial of organic matter and those of pyrite(= FeS2) The alteration of series with high contents of the two elements will then condition for nearly a billion of years the oxygen, sulfur and iron chemical composition of the oceans. The oxygen will finally come from the activity of cyanobacteria and the early Archean reducing atmosphere will be replaced by an oxidizing atmosphere at the end of the Precambrian.

Protesting Warmth? Greta’s Home, Sweden, Is 3°C COLDER Today Than Nearly All Of The Last 9000 Years

by K. Richard, September 26, 2019 in NoTricksZone


Greta Thunberg lives in Sweden. According to peer-reviewed science, Sweden was at least 3°C warmer than it is today about 6000 to 9000 years ago, when CO2 concentrations lingered around 265 ppm. At 410 ppm CO2, 21st century Sweden is colder now than almost any time in the last 9000 years.

A Much Warmer Northern Hemisphere

During the Medieval Warm Period, wine vineyards flourished in Scandinavia and Russia at the same latitude (55°N) where polar bears roam today.

UK Climate Trends: Plus Ça Change: Climate hysteria is unjustified

by P. Homewood, September 27, 2019 in GWPF


London, 27 September: The UK’s key climate indicators have barely changed for 20 years. That’s according to a new paper from the Global Warming Policy Foundation, which rebuts claims that the weather is getting worse.
According to author Paul Homewood, the Met Office’s Central England Temperature Record shows that temperatures have barely changed in 20 years and that there has been no increase in extremely hot days either:
“The summer of 2018 had just one day over 30 degrees, while 1976 had six. The Met Office’s data show that hot days are just not becoming more common.”
And there seems to be little to worry about on bad weather front either. There has been a gentle decline in storminess, and in most of the UK, there has been no change in either average rainfall or rainfall extremes:
“Only in Scotland has there been a noticeable increase”, says Homewood. “Climate hysteria is entirely overdone.”
Paul Homewood: Plus Ça Change: The UK Climate in 2018 (pdf)

Canadian Govt. Scrapped 100 Years Of Inconvenient Data On Climate Change

by L.  Goldstein, Sep. 22, 2019 in ClimateChangeDispatch

Canadians already suspicious of Prime Minister Justin Trudeau’s carbon tax will likely be even more suspicious given a report by Ottawa-based Blacklock’s Reporter that Environment Canada omitted a century’s worth of observed weather data in developing its computer models on the impacts of climate change.

The scrapping of all observed weather data from 1850 to 1949 was necessary, a spokesman for Environment Canada told Blacklock’s Reporter, after researchers concluded that historically, there weren’t enough weather stations to create a reliable data set for that 100-year period.

“The historical data is not observed historical data,” the spokesman said. “It is modeled historical data … 24 models from historical simulations spanning 1950 to 2005 were used.”

These computer simulations are part of the federal government’s ClimateData.ca website launched by Environment Minister Catherine McKenna on Aug. 15.

She described it as “an important next step in giving our decision-makers even greater access to important climate data for long-term planning. The more each of us uses this type of information, the more it will help.”

Blacklock’s Reporter, which describes itself as “the only reporter-owned and operated newsroom in Ottawa” focusing on intensive reporting of government documents, notes that in many cases the observed temperatures scrapped by Environment Canada in creating its computer models were higher in the past than today.

For example, Vancouver had a higher record temperature in 1910 (30.6C) [87.08F] than in 2017 (29.5C) [85.1F].


Continental Cooling: Earliest Snow In 20 Years In Greta’s Sweden…Data Suggest Autumn Arriving EARLIER In Europe!

by P. Gosselin, Sep. 22, 2019 in NoTricksZone


By Kirye in Tokyo

Cooling August trends and stunningly early snows in Europe contradict global catastrophist warming claims.

Recently we heard reports of the earliest snowfall in Greta Thunberg’s Sweden in 20 years, and “stunning” snowfall in Norway. So it’s been strange to hear during these hysterical days of Fridays for Future (FFF) how snowfall is supposed to disappear even in the dead of winter.

Yet, Sweden’s and Norway’s early snowfall really should not come as a surprise when we look at the temperature trends for late summer in Sweden and elsewhere. The data are telling us that the opposite is happening: In reality autumn seems to be arriving earlier in Scandinavia.

Fall arriving sooner in Scandinavia

Using the untampered data from the Japan Meteorological Agency (JMA) from the 6 Swedish stations that offer close to complete datasets, we see that August has been seeing a late summer cooling trend across the Nordic country:

No climate emergency for polar bears or walrus means no climate emergency period

by Charles the moderator, Sep. 23, 2019 in WUWT


We are told the Arctic is warming twice as fast as anywhere else in the world, yet as the internet reverberates with shrill, almost-the-lowest-ice-extent-ever stories, polar bears, Pacific walrus, and the most common ice seal species (ringed and bearded seals, as well as harp seals), are all thriving.  Two new videos published by the GWPF on polar bears and walrus confront this conundrum and the conclusion is clear: if there is no climate emergency for polar bears, there is no climate emergency anywhere.

Polar bears have survived several periods of less ice than there is now as well as periods with more ice. Most ice seal species and walrus, which have existed in the Arctic much longer than polar bears, have lived through many of these extreme sea ice cycles. The low ice extent this year – whether it ends up being second-lowest or third-lowest since 1979 – is merely a blip compared to what these species have experienced during the Pleistocene.

This new video explains that polar bears are important ecosystem indicators that are taking reduced summer sea ice in their stride. My new book, The Polar Bear Catastrophe That Never Happened, explains why this has caught polar bear specialists off guard.

Alarmist Rhetoric Based On Exaggerations And Lies”

by P. Gosselin, Sep. 18, 2019 in NoTricksZone


In a recent interview with the online Berliner Zeitung (BZ) here, economist Björn Lomborg said that 16-year old Greta Thunberg’s demands “will put people in danger”.

Greta, the Swedish teenage activist is calling for radical cuts in CO2 emissions – on a scale that would have profound impacts on the world’s market system. Moreover, Lomborg calls the demands immoral. Lomborg says it would be far wiser to invest money in bringing the world’s poor out of grinding poverty rather than to try to mitigate climate change.

Fear based on 30 years of lies and exaggerations

“Rich countries that tell poor countries not to use fossil energy for the benefit of the environment are acting immorally,” Lomborg told the BZ.

Lomborg also sharply criticized Thunberg, telling BILD news daily: “Greta Thunberg fears the end of the world due to climate change. This fear is the result of three decades of alarmist rhetoric based on exaggerations and lies.”

€43 billion for 0.00001°C of temperature reduction yearly

Lomborg also called Germany’s “Energiewende” – transition to green energies – “the best example of a failed climate policy” which has proven to be “incredibly costly and ineffective.”

“Global warming will be reduced by 0.001 degrees at most by 2100 for 43 billion euros a year,” he told the BZ. Lomborg blames the adults for panicking Ms Thunberg and using her “to push through an agenda that costs trillions but brings almost no benefits.”

Rather, for the trillions we will likely get us far graver problems. What a deal.

Le Précambrien : les bactéries, la tectonique des plaques et l’oxygène (1/2)

by Alain Préat, 20 septembre 2019, in ScienceClimatEnergie


Résumé : L’oxygène n’est pas apparu aussi brutalement qu’on le pensait sur notre planète.

Malgré un apport en oxygène lié aux cyanobactéries dès l’Archéen, ce ne se sont pas ces micro-organismes qui sont à la base de la première grande ‘révolution’ de l’oxygène qui a eu lieu à la limite Archéen/Paléoprotérozoïque (il y a 2,5 milliards d’années) dans l’atmosphère, lors du Grand Evénement d’Oxydation. Ce sont les processus liés au cycle de la tectonique des plaques (activité mantellique et périodes intenses d’érosion/altération) qui ont contribué de manière déterminante à l’augmentation de la concentration de l’oxygène atmosphérique vers 2,5 milliards d’années. Les deux principaux processus responsables de cette augmentation sont liés à l’enfouissement de la matière organique et de la pyrite (= FeS2). L’altération des séries riches en ces deux composants conditionnera ensuite pendant près d’un milliard d’années la composition chimique des océans en oxygène, soufre et fer. Au cours du temps, l’oxygène proviendra de l’activité des cyanobactéries et l’atmosphère réductrice du début de l’Archéen sera remplacée par une atmosphère oxydante à la fin du Précambrien.

Abstract : Oxygen did not appear as abruptly as we thought on our planet.

Despite an oxygen supply related to cyanobacteria, since the Archean, it is not these microorganisms that are at the base of the first great oxygen revolution that took place at the Archean/Paleoproterozoic boundary (2.5 billion years) in the atmosphere during the Great Oxidation Event. Two processes related to the cycle of plate tectonics (mantle activity and intense periods of erosion/weathering) were mostly involved in the increase of the of atmospheric oxygen concentration 2.5 billion years ago. These two main processes are related to the burial of organic matter and those of pyrite (= FeS2). The alteration of series with high contents of the two elements will then condition for nearly a billion of years the oxygen, sulfur and iron chemical composition of the oceans. The oxygen will finally come from the activity of cyanobacteria and the early Archean reducing atmosphere will be replaced by an oxidizing atmosphere at the end of the Precambrian.

OLYMPUS DIGITAL CAMERA

Figure 2a( en haut). Stromatolithe columnaire, Néoprotérozoïque, (Formation SC1c in Préat et al. 2018), Bassin du Niari, République du Congo (Brazzaville), photo A. Préat, 2016.