Tous les articles par Alain Préat

Full-time professor at the Free University of Brussels, Belgium apreat@gmail.com apreat@ulb.ac.be • Department of Earth Sciences and Environment Res. Grp. - Biogeochemistry & Modeling of the Earth System Sedimentology & Basin Analysis • Alumnus, Collège des Alumni, Académie Royale de Sciences, des Lettres et des Beaux Arts de Belgique (mars 2013). http://www.academieroyale.be/cgi?usr=2a8crwkksq&lg=fr&pag=858&rec=0&frm=0&par=aybabtu&id=4471&flux=8365323 • Prof. Invited, Université de Mons-Hainaut (2010-present-day) • Prof. Coordinator and invited to the Royal Academy of Sciences of Belgium (Belgian College) (2009- present day) • Prof. partim to the DEA (third cycle) led by the University of Lille (9 universities from 1999 to 2004) - Prof. partim at the University of Paris-Sud/Orsay, European-Socrates Agreement (1995-1998) • Prof. partim at the University of Louvain, Convention ULB-UCL (1993-2000) • Since 2015 : Member of Comité éditorial de la Revue Géologie de la France http://geolfrance.brgm.fr • Since 2014 : Regular author of texts for ‘la Revue Science et Pseudosciences’ http://www.pseudo-sciences.org/ • Many field works (several weeks to 2 months) (Meso- and Paleozoic carbonates, Paleo- to Neoproterozoic carbonates) in Europe, USA (Nevada), Papouasia (Holocene), North Africa (Algeria, Morrocco, Tunisia), West Africa (Gabon, DRC, Congo-Brazzaville, South Africa, Angola), Iraq... Recently : field works (3 to 5 weeks) Congo- Brazzaville 2012, 2015, 2016 (carbonate Neoproterozoic). Degree in geological sciences at the Free University of Brussels (ULB) in 1974, I went to Algeria for two years teaching mining geology at the University of Constantine. Back in Belgium I worked for two years as an expert for the EEC (European Commission), first on the prospecting of Pb and Zn in carbonate environments, then the uranium exploration in Belgium. Then Assistant at ULB, Department of Geology I got the degree of Doctor of Sciences (Geology) in 1985. My thesis, devoted to the study of the Devonian carbonate sedimentology of northern France and southern Belgium, comprised a significant portion of field work whose interpretation and synthesis conducted to the establishment of model of carbonate platforms and ramps with reefal constructions. I then worked for Petrofina SA and shared a little more than two years in Angola as Director of the Research Laboratory of this oil company. The lab included 22 people (micropaleontology, sedimentology, petrophysics). My main activity was to interpret facies reservoirs from drillings in the Cretaceous, sometimes in the Tertiary. I carried out many studies for oil companies operating in this country. I returned to the ULB in 1988 as First Assistant and was appointed Professor in 1990. I carried out various missions for mining companies in Belgium and oil companies abroad and continued research, particularly through projects of the Scientific Research National Funds (FNRS). My research still concerns sedimentology, geochemistry and diagenesis of carbonate rocks which leads me to travel many countries in Europe or outside Europe, North Africa, Papua New Guinea and the USA, to conduct field missions. Since the late 90's, I expanded my field of research in addressing the problem of mass extinctions of organisms from the Upper Devonian series across Euramerica (from North America to Poland) and I also specialized in microbiological and geochemical analyses of ancient carbonate series developing a sustained collaboration with biologists of my university. We are at the origin of a paleoecological model based on the presence of iron-bacterial microfossils, which led me to travel many countries in Europe and North Africa. This model accounts for the red pigmentation of many marble and ornamental stones used in the world. This research also has implications on the emergence of Life from the earliest stages of formation of Earth, as well as in the field of exobiology or extraterrestrial life ... More recently I invested in the study from the Precambrian series of Gabon and Congo. These works with colleagues from BRGM (Orléans) are as much about the academic side (consequences of the appearance of oxygen in the Paleoproterozoic and study of Neoproterozoic glaciations) that the potential applications in reservoir rocks and source rocks of oil (in collaboration with oil companies). Finally I recently established a close collaboration with the Royal Institute of Natural Sciences of Belgium to study the susceptibility magnetic signal from various European Paleozoic series. All these works allowed me to gain a thorough understanding of carbonate rocks (petrology, micropaleontology, geobiology, geochemistry, sequence stratigraphy, diagenesis) as well in Precambrian (2.2 Ga and 0.6 Ga), Paleozoic (from Silurian to Carboniferous) and Mesozoic (Jurassic and Cretaceous) rocks. Recently (2010) I have established a collaboration with Iraqi Kurdistan as part of a government program to boost scientific research in this country. My research led me to publish about 180 papers in international and national journals and presented more than 170 conference papers. I am a holder of eight courses at the ULB (5 mandatory and 3 optional), excursions and field stages, I taught at the third cycle in several French universities and led or co-managed a score of 20 Doctoral (PhD) and Post-doctoral theses and has been the promotor of more than 50 Masters theses.

Re-evaluating the manufacture of the climate consensus

by Judith Curry, August 21, 2019 in ClimateEtc.


A new book by Oppenheimer, Oreskes et al. entitled ‘Discerning Experts: The Practices of Scientific Assessment for Environmental Policy‘ makes a case against consensus seeking in climate science assessments.

I have long railed against the consensus-seeking process used by the IPCC (see my previous blog posts on this topic).  And particularly, my paper:

Oppenheimer has long voiced concerns about consensus (e.g. his 2007 paper).  However, Oreskes has been consensus enforcer in chief, originating the 97% thingy.

I haven’t read their new book, but authors Oreskes, Oppenheimer and Jamison have written an essay on their book in Scientific American, entitled Scientists have been underestimating the rate of climate change.

You can see where this is going from the title of this article; most of this is an attempt to justify alarmism. But they make some interesting points.  Excerpts:

Lets stop manufacturing consensus about climate change.  Lets open up the scientific debate on climate change and celebrate disagreement and use it to push the knowledge frontier of climate science.  The whole consensus thing has done little to reduce global CO2 emissions, which was the point of the whole exercise.  It’s time for new approaches to both science and policy.

Listen to the Trees!

by Jim Steele, August 22, 2019 in WUWT


What’s Natural?

Published in Pacifica. Tribune August 20,2019

This summer I taught a class on the Natural History of the Sierra Nevada for San Francisco State University’s Sierra Nevada Field Campus. The first day we taught students how to identify the trees. Once students know their trees, they can easily see how tree species vary with elevation, temperature, moisture, and snow pack. They can see which species colonize open sunny areas and which trees need shade before they can invade. Old time naturalists used trees to identify “life-zones” where different species of mammals, birds, insects and other plants can be found. Furthermore, when you listen to the trees, you can see change.


Tree rings indicate the warmest decades of the 20th century were the 1930s and 40s, and temperatures have yet to surpass those decades. This divergence between thermometers and trees is best explained by the fact that instrumental temperatures are biased upwards when taken at hot airports or in areas recently suffering from growing urban heat island effects. In contrast, trees measure temperatures in natural habitat.

Why CO2 is Not the Control Knob of Global Temperature and Observational Proof it is Not Causing Dangerous Warming

by Institute for the Human Environment,   August 2019


There is no debate as to whether or not atmospheric carbon dioxide, or CO2, is a so-called greenhouse gas. When present in the atmosphere, this one-carbon and two-oxygen molecule indeed has the capacity to absorb infrared radiation and warm the planet. There is also no debate as to whether or not the concentration of atmospheric CO2 is rising; over the past two centuries it has increased from a meager 0.028% of the atmosphere by volume to a still-meager 0.041% today. Furthermore, there is no argument that global temperatures are warmer today than they were 50, 100 or even 200 years ago. However, there is much debate on whether or not the modern increase in atmospheric CO2 has caused, or is presently causing, dangerous global warming, warming so severe that it is threatening life all across the planet.

But how accurate is this narrative?

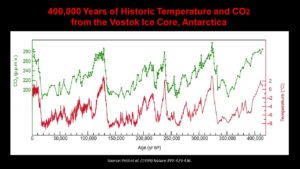
In answering this question, one need only examine the historic temperature and CO2 records illustrated in Figure 1 more critically. Certainly, these two variables experience a fairly high degree of correlation over the time period shown. However, it doesn’t take a Ph.D. scientist to recognize and understand the fact that correlation among two variables does not prove causation. Every textbook on statistics teaches as much, and they also teach that a hypothesis of causation among two variables can be rejected if there is no statistically significant correlation between them, or if the correlation fails to be maintained in a consistent and expected manner across time.

By applying such principles to the case being considered here, it can confidently be argued that if carbon dioxide is indeed the all-important control knob of temperature that climate alarmists claim it to be, then changes in atmospheric CO2 should always precede changes in temperature. And, because CO2 is a greenhouse gas, to prove causation those changes must always be such that a rise in CO2 induces a corresponding rise in temperature, whereas a decline in CO2 must always induce a corresponding drop in temperature. Consistent observations to the contrary, if present in the historic record, would therefore serve to invalidate a causation claim, as well as demonstrate that atmospheric CO2 is nothing more than a bit player among the many factors that drive climate change.

Figure 1. 400,000 years of historic temperature and CO2 from the Vostok Ice Core, Antarctica. Source: Petit et al. (1999) Nature 399: 429-436.

‘MASSIVE POOL’ OF METHANE HIDDEN DEEP BENEATH EARTH’S SURFACE DISCOVERED BY SCIENTISTS

by Hannay Osborne, 21 August 2019 in Newsweek from PNAS


A huge source of methane has been discovered deep beneath the surface of Earth, sitting between the upper mantle and lower oceanic crust. The discovery is important as it could provide an insight into the hydrothermal vents that may have helped the planet’s first life emerge. Researchers also argue it could be a source of hydrogen and methane on other planets in the solar system—”even those where liquid water is no longer present.”

The ‘abiotic’ methane—methane that is not formed with organic matter—was found locked inside rocks. Researchers from the Woods Hole Oceanographic Institution (WHOI), Massachusetts, took 160 samples from hydrothermal sites across the globe, including the Mid-Atlantic Ridge, Guaymas Basin, the East Pacific Rise and the Mid-Cayman Rise. After analyzing them with a laser-based microscope, they found that almost all contained pockets of methane.

In their study, published in the journal PNAS, the team says this could be the biggest source of abiotic methane in the world. This reservoir, they say, could account for more methane than was in Earth’s atmosphere before the onset of the industrial era.

The methane appears to have formed by reactions between trapped water and olivine, a group of rock-forming minerals found in the planet’s subsurface. When seawater moves through the deep ocean crust, it mixes with magma-hot olivine. When the mineral cools, the water is trapped inside and a chemical reaction takes place, leading to the formation of hydrogen and methane.

Traditionally, we think of methane—a potent greenhouse gas—as forming when organic material breaks down. When it is emitted into the atmosphere, it has a warming effect far greater than carbon dioxide, although it is far shorter-lived than the latter, disappearing after about a decade.

However, methane is also known to exist on the seafloor. It is released through deep-sea vents—geothermally heated fissures on Earth’s crust. In 2016, scientists with the Ocean Exploration Trust discovered over 500 methane spewing vents off the west coast of the U.S.

However, the source of the seafloor methane has remained something of a mystery. “Identifying an abiotic source of deep-sea methane has been a problem that we’ve been wrestling with for many years,” study author Jeffrey Seewald, a senior scientist at WHOI, said in a statement.

Lead author Frieder Klein added: “We were totally surprised to find this massive pool of abiotic methane in the oceanic crust and mantle. Here’s a source of chemical energy that’s being created by geology.”

Media Ignore Vast Summer Cold Across Northern Hemisphere; Southern USA, Russia See “Record Lows” In July

by P. Gosselin, August 3, 2019 in NoTricksZone


While the headlines naturally focused on an intense heat wave over a region centered over France and Germany last week, the global warming ambulance chasers worked overtime avoiding and ignoring the real story: vast, continent-wide cold spreading across Russia.

Heat and cold zero-sum

First at the European Institute for Climate and Energy (EIKE), Klaus Öllerer reported how the Sahara heat ended up being a “zero-sum” event for the northern hemisphere region of Europe and Asia.

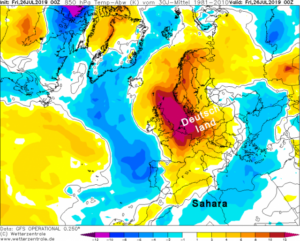
Öllerer wrote last week that despite the heat that took place in large parts of Europe, it was cooler than usual in other neighboring parts. Only a certain area in Central Europe (purple area) was particularly hot. Around it, it was less warm (yellow) and cooler than usual (blue):

Source: wetterzentrale.de

“Even large parts of the Sahara are cooler than usual (blue). This is no wonder, as the heat is now in Europe and cooler air flows into the Sahara,” Öllerer wrote.

“The above-average warm areas balance out with the above-average cold areas,” he concluded. “The current warming is a zero-sum game! Historically, such events have occurred again and again.”

“It is even the case that in cooler times – such as the Little Ice Age – warm summer extremes were more frequent than in the last one hundred years and more,” Öllerer added.

Severe cold across Russia

Northern Europe July Temperature Sees NO WARMING Over Past Decades. Global July Not A Record High!

by P. Gosselin, August 20, 2019 in NoTricksZone


Parts of Europe have seen a couple of brief but intense heat waves this summer, and so some of the public got brainwashed by the media into thinking the continent’s summer climate is rapidly getting hotter and that all this is the new normal.

Yet, when we examine the unaltered data from the Japan Meteorology Agency (JMA) for locations in northern Europe that have long-term datasets available, we see there has been no July warming trend over the past decades. Media reports suggesting otherwise are nonsense.

Ireland

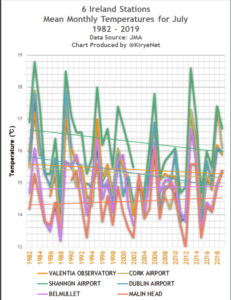
Looking at 6 stations in Ireland, we have the following for July:


Data source: JMA.

Overall, Ireland’s mean July temperatures have been cooling off modestly over the past 3 decades and more, even though three stations are located at airports.

Sweden

The latest travesty in ‘consensus enforcement’

by Judith Curry, August 14, 2019 in ClimateEtc.


The latest travesty in consensus ‘enforcement’, published by Nature.
.
Abstract. We juxtapose 386 prominent contrarians with 386 expert scientists by tracking their digital footprints across 200,000 research publications and 100,000 English-language digital and print media articles on climate change. Projecting these individuals across the same backdrop facilitates quantifying disparities in media visibility and scientific authority, and identifying organization patterns within their association networks. Here we show via direct comparison that contrarians are featured in 49% more media articles than scientists. Yet when comparing visibility in mainstream media sources only, we observe just a 1% excess visibility, which objectively demonstrates the crowding out of professional mainstream sources by the proliferation of new media sources, many of which contribute to the production and consumption of climate change disinformation at scale. These results demonstrate why climate scientists should increasingly exert their authority in scientific and public discourse, and why professional journalists and editors should adjust the disproportionate attention given to contrarians.
.
This ranks as the worst paper I have ever seen published in a reputable journal.  The major methodological problems and dubious assumptions:
.
  • Category error to sort into contrarians and climate scientists, with contrarians including scientists, journalists and politicians.
  • Apart from the category error, the two groups are incorrectly specified, with some climate scientists incorrectly designated as contrarians.
  • Cherry picking the citation data of top 386 cited scientists to delete Curry, Pielke Jr, Tol, among others (p 12 of Supplemental Information)
  • Acceptance of the partisan, activist, non-scientist group DeSmog as a legitimate basis for categorizing scientists as ‘contrarian’
  • Assumption that scientific expertise on the causes of climate change relates directly to the number of scientific citations.
  • Assumption that it would be beneficial for the public debate on climate change  for the ‘unheard’ but highly cited climate scientists to enter into the media fray.
  • Assumption that scientists have special authority in policy debates on climate change
The real travesty is this press release issued by UC Merced:

The harm that this paper does to climate science is an attempt to de-legitimize climate scientists (both academic and non academic), with the ancillary effects of making it more difficult to get their papers published in journals (stay tuned for my latest engagement with the journal peer review process, coming later this month) and the censorship of Nir Shaviv by Forbes (hopefully coming later this week).

Hurricane Camille Remembered

by P. Homewood, August 19, 2019 in NotaLotofPeopoleKnowThat


This month marks the 50th anniversary of Hurricane Camille, the second most powerful to git the US coast. The strongest was the Labor Day Hurricane of 1935.

The NWS has issued this press release:


Hurricane Camille
August 17, 1969

Late in the evening on August 17 in 1969, Hurricane Camille made landfall along the Mississippi Gulf Coast near Waveland, MS. Camille is one of only FOUR Category 5 hurricanes ever to make landfall in the continental United States (Atlantic Basin) – the others being the 1935 Labor Day Hurricane, which impacted the Florida Keys; Hurricane Andrew in 1992, which impacted south Florida; and Hurricane Michael in 2018, which impacted the Florida panhandle. (Note: It is worth mentioning that the 1928 San Felipe Hurricane made landfall as a Category 5 Hurricane on Puerto Rico)

Camille ranks as the 2nd most intense hurricane to strike the continental US with 900 mb pressure and landfall intensity of 150 knots. Camille ranks just below the 1935 Labor Day Hurricane with 892 mb and 160 knots, while slightly stronger than Hurricane Andrew with 922 mb and 145 knots and Hurricane Michael with 919 mb and 140 knots. The actual maximum sustained winds of Hurricane Camille are not known as the hurricane destroyed all the wind-recording instruments in the landfall area. Re-analysis data found peak winds of 150 knots (roughly 175 mph) along the coast. A devastating storm tide of 24.6 feet occurred west of our area in Pass Christian, MS.

Fire from Ice: A Case Study of Methane Hydrates in the Eastern Mediterranean

by E. Zogopoulos, August 13, 2019 in EnergyIndustryeView


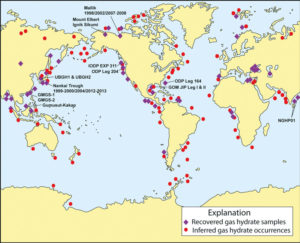
Methane hydrates is a source of methane gas which is found in crystalline formation that look like ice and can be found in permafrost regions or under the sea in outer continental margins.

We are living in times of fundamental changes in the energy landscape, driven by uncertainty, unstable energy prices, disruptive technologies, geopolitical gambits and subsequent attempts for regulatory interventions. While governments and corporations are trying to adjust to the new landscape and guess the name of the game, they need reliable sources of power to make predictions and critical strategic decisions.

Historical & geopolitical context

The era of hydrocarbons does not seem to be over, but there might be some indications in the horizon. We like it or not, they will still account for the vast majority of the global energy mix by 2050, despite significant breakthroughs in renewables. Many new players come in the energy market with the elusive promise of additional and cheaper resources and the will to disrupt the game – and eventually make money out of it.

Furthermore, the growing tension between public policy and private initiatives has been boiling and has been more than just an understatement for decades. The under-investment that we observe now due to lower prices and risks could become chronic and the global output of energy resources could lead to secure supply deficit.

Gas is believed to gradually replace coal, which is a source of distress for some existing players. The world is facing a proliferation of Liquified Natural Gas (LNG) supplies that are already impacting gas markets and competing with pipeline gas. Some of the largest and most significant consuming nations are contemplating reform or unbundling, which could mean some take or pay contracts become stranded and an increasing oil price is likely to reinforce the price arbitrage between long-term and spot pricing.

There is undeniably a constant call for further investments in renewables, but lower oil, gas and coal prices and increased efficiency (or very effective lobbying) might slow this down. The global players do take into consideration the call for renewables (like solar and wind energy), either for publicity purposes or even because they do believe that this could be the future.


Location of sampled and inferred methane hydrate occurrences in oceanic sediment of outer continental margins and permafrost regions. Most of the recovered methane hydrate samples have been obtained during deep coring projects or shallow seabed coring operations. Most of the inferred methane hydrate occurrences are sites at which bottom simulating reflectors (BSRs) have been observed on available seismic profiles. The methane hydrate research drilling projects and expeditions reviewed in this report have also been highlighted on this map. (Map courtesy of Timothy S. Collett, USGS)

Congo : la découverte des gisements d’Oyo change la donne pour le pays et le Continent

by La Tribune Afrique, 16 août 2019


Le Congo dispose de 2 milliards de barils de réserves de pétrole prouvées provenant d’une vingtaine de champs en cours d’exploitation. La récente découverte de pétrole onshore devrait redessiner le futur de l’industrie congolaise des hydrocarbures.

La récente découverte onshore faite dans le gisement du Delta de la Cuvette en République du Congo change la donne pour le Congo et l’Afrique. La découverte a été annoncée le 10 août par SARPD Oil et PEPA, un consortium congolais travaillant en tant qu’opérateurs du bloc.

Les premières projections indiqueraient que les gisements découverts pourraient produire jusqu’à 359 millions de barils de pétrole, soit 983 000 b/j. Cela pourrait quadrupler la production du Congo, qui se situe actuellement à plus de 330 000 barils/jour, selon les derniers chiffres de l’Opep. Le gouvernement lui s’est fixé comme objectif un volume de production de 400 000 barils/jour d’ici 2020.

«Il s’agit de notre première découverte onshore et elle nous laisse beaucoup d’espoir que nous ferons plus de découvertes, en particulier maintenant que nous allons attribuer plus de blocs pour l’exploration pétrolière dans le cycle de licences en cours», a expliqué Jean-Marc Thystère-Tchicaya, ministre congolais des Hydrocarbures dans une déclaration rapportée par la Chambre africaine de l’Energie.

Troisième producteur du Continent

….

CRYING WOLF OVER THE GREAT BARRIER REEF

by Peter Ridd, August 12, 2019 in GWPF


The scare stories about the Great Barrier Reef started in the 1960’s when scientist first started work on the reef. They have been crying wolf ever since.

Scientists from James Cook University have just published a paper on the bleaching and death of corals on the Great Barrier Reef (GBR) and were surprised that the death rate was less than they expected because of the adaptability of corals to changing temperatures. It appears as though they exaggerated their original claims and are quietly backtracking. To misquote Oscar Wilde, to exaggerate once is a misfortune, to do it twice looks like carelessness, but to do it repeatedly looks like unforgivable systemic unreliability by some of our major science organisations.

It is a well-known phenomenon that corals can adapt very rapidly to high temperatures and that if you heat corals in one year, they tend to be less susceptible in future years to overheating. It is the reason why corals are one of the least likely species to be affected by climate change, irrespective of whether you believe the climate is changing by natural fluctuations or from human influence.

AUSTRALIA HIT BY ANTARCTIC FRONT WITH TOWNS RECEIVING THEIR FIRST SNOW IN DECADES

by Cap Allon, August 12, 2019 in Electroverse


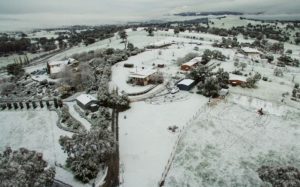
Regions just 90 minutes from Sydney received extremely rare snow over the weekend, as an intense cold front released from the Antarctic pushed north past Tasmania.

Blackheath resident Erica Mann was ecstatic to find fresh white powder falling in her garden, saying it was the most snow she had ever seen there:

“I opened the curtains and I could see a huge amount of snow on top of the water tank — it was so exciting,” she said. “It’s amazing. I went up the street … and all the houses are completely covered in snow.”

Residents in the Riverina also received a dumping of snow, with some towns recording their first falls in decades. Cootamundra local Steve Theobald said the last time he remembered snow there was 1985(solar minimum of cycle 21), while residents in Tumut –just 300 metres above sea level– said it was their first fall since 2000.

Other towns in southern NSW which recorded rare snow include Adelong, Harden and Batlow.

The powder continued falling through Sunday and finally began abating on Monday.

See also here (in French)

Ten years of icy data show the flow of heat from the Arctic seafloor

by US Geological Survey, August 8, 2019 in ScienceDaily


Scientists have taken the temperature of a huge expanse of seafloor in the Arctic Ocean in new research by the U.S. Geological Survey and the Geological Survey of Canada. The study, published in the Journal of Geophysical Research, is accompanied by the release of a large marine heat flow dataset collected by the USGS from an ice island drifting in the Arctic Ocean between 1963 and 1973. These never-before-published data greatly expand the number of marine heat flow measurements in the high Arctic Ocean.

Marine heat flow data use temperatures in near-seafloor sediments as an indication of how hot Earth’s outer layer is. These data can be used to test plate tectonic theories, provide information on oil and gas reservoirs, determine the structure of rock layers and infer fluid circulation patterns through fractures in those rock layers.

Analysis: What’s Really Going On In Greenland

by C. Martz, August 12, 2019 in ClimateChangeDispatch


As I’m sure many of my readers are aware, Europe has been having an odd summer as far as temperatures are concerned. The continent has had two major heatwaves this summer; one was in June and the other was in July.

In addition, Greenland has also seen some exceptional “warmth” and lots of ice melt this summer as compared to more recent years.

So, what’s going on? Is climate change to blame? Or, is this a freak of nature?

As with most complicated things in science, the truth is somewhere in between and is not just one way or the other. I hate saying that as a “black and white” person, but it’s an unfortunate fact. One can not make a preconceived notion based on one weather event without looking at a.) the big picture, b.) mechanism, and c.) long-term trends.

The upper air pattern over Europe and Greenland is opposite of what’s been occurring in much of the United States. The U.S. has only had one major heatwave this year, and that in and of itself caused mass hysteria.

La hausse du niveau de la mer accélère-t-elle l’érosion des côtes? (1/3)

by Y. Battiau-Queney, 15 août 2019 in ScienceClimatEnergie


Il est courant de lire et d’entendre que la hausse du niveau de la mer, l’une des conséquences les plus manifestes du réchauffement climatique, va accélérer l’érosion de nos côtes, menacer de submersion marine de vastes zones littorales urbanisées et faire disparaître nombre d’îles basses habitées. Ces craintes sont-elles justifiées? Comme un consensus ne vaut pas vérité scientifique, on va essayer de démêler le vrai du faux en partant de l’état des connaissances scientifiques sur la hausse du niveau de la mer et analyser ses effets possibles sur les processus d’érosion des côtes.


1/ Que sait-on de la hausse du niveau de la mer ?

1.1. État des connaissances sur les variations passées et présentes du niveau de la mer à l’échelle mondiale

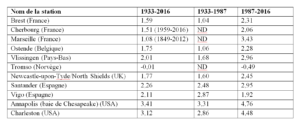
Une bonne synthèse récente sur les causes et l’ampleur de la hausse du niveau de la mer se trouve dans Cazenave et Le Cozannet (2014). On y trouvera une très abondante bibliographie antérieure à 2013. Les méthodes utilisées par les scientifiques pour évaluer la tendance moyenne de l’élévation du niveau de la mer dépendent de la période considérée. A l’échelle du Pléistocène (1 800 000 ans) et de l’Holocène (10 000 ans) on dispose d’archives sédimentologiques (repérage d’anciennes plages “soulevées”, analyse de niveaux tourbeux recouverts de sédiments marins, stratigraphie et datation de récifs coralliens …) et de données archéologiques, particulièrement riches sur les côtes méditerranéennes. On sait qu’à plusieurs reprises, pendant les phases interglaciaires du Pléistocène, le niveau de la mer a été supérieur à l’actuel de 5 à 10 m au moins (Planton et al., 2015). À partir du milieu du 19ème siècle, on utilise les données souvent précises des marégraphes installés principalement dans les ports de l’hémisphère nord. Elles fournissent les altitudes relatives du niveau de la mer par rapport aux terres émergées. Depuis 1993, les données satellitaires fournissent des altitudes absolues du niveau de la mer par rapport à l’ellipsoïde terrestre de référence et permettent d’avoir une vision beaucoup plus globale des variations du niveau des océans à toutes les latitudes et longitudes.

Tableau 1 : variations du niveau de la mer indiquées par les marégraphes (sources: SONEL et GLOSS; Wöppelmann et al., 2014 pour Marseille) (ND= non documenté). Les données dans les colonnes sont exprimées en mm/an.

MOSCOW ON TRACK FOR COLDEST AUGUST ON RECORD IN BOOKS DATING BACK 150+ YEARS

by Cap Allon, August 13, 2019 in Electroverse


Eastern Europe has been experiencing a miserable summer so far, with temperatures holding well-below average for the majority of the season. And now, following a cold and wet June and July (in which many new daily low temperature records were set), Moscow is currently on course for it’s coldest August in recorded history.

The first week of August in Moscow was pretty chilly, with an average air temperature of just 13C (55.4F) — some 5C below the norm.

The city’s coldest August on record was way back in 1884, when the average daily air temperature for the month was some 4C below the norm. In fact, that August turned out to be colder than the May.

According to www.hmn.ru, the beginning of August in Moscow has been characterized by unusual weather in terms of not only the cold, but also of abundant rainfall and a lack of sunshine.

After the first 7 days, precipitation is already at average levels for the entire month, while the chronic lack of sunshine is within touching distance of Aug 2001’s record-low 181 hours (avg. sun hours for the month of August are 238 hours).

The cold times are returning, clouds are nucleating, all in line with historically low solar activity:


Why A ‘Super’ Grand Solar Minimum Is Upon Us

by Cap Allon, November 19, 2018 in PrincipiaScientificInternational


Professor Valentina Zharkova explains and confirms why a “Super” Grand Solar Minimum is upon us: “If the world was looking for an Epiphany moment, this should be it.”

Professor  Zharkova gave a presentation of her Climate and the Solar Magnetic Field hypothesis at the Global Warming Policy Foundation in October, 2018. Even if you believe the IPCC’s worst case scenario, Zharkova’s analysis blows any ‘warming’ out of the water.

Lee Wheelbarger sums it up: even if the IPCC’s worst case scenarios are seen, that’s only a 1.5 watts per square meter increase. Zharkova’s analysis shows a 8 watts per square meter decrease in TSI to the planet.

The information she unveiled should shake/wake you up. Zharkova was one of the few that correctly predicted solar cycle 24 would be weaker than cycle 23 – only 2 out of 150 models predicted this. Her models have run at a 93% accuracy and her findings suggest a SuperGrand Solar Minimum is on the cards beginning 2020 and running for 350-400 years.

Greenland’s ‘Record Temperature’ denied – the data was wrong

by Anthony Watts, August 12, 2019 in WUWT


From the “But, but, wait! Our algorithms can adjust for that!” department comes this tale of alarmist woe. Greenland’s all-time record temperature wasn’t a record at all, and it never got above freezing there.


First, the wailing from news media:

NYT: https://www.nytimes.com/2019/08/02/climate/european-heatwave-climate-change.html

WAPO: https://www.washingtonpost.com/news/capital-weather-gang/wp/2016/06/10/greenland-witnessed-its-highest-june-temperature-ever-recorded-on-thursday/

Climate Progress: https://thinkprogress.org/greenland-hits-record-75-f-sets-melt-record-as-globe-aims-at-hottest-year-e34e534e533e/

Polar Portal: http://polarportal.dk/en/news/news/record-high-temperature-for-june-in-greenland/


Now from the Danish Meteorological Institute (DMI), via the news website The Local, the cooler reality:

It’s raining plastic: microscopic fibers fall from the sky in Rocky Mountains

by The Guardian, August 13, 2019


Plastic was the furthest thing from Gregory Wetherbee’s mind when he began analyzing rainwater samples collected from the Rocky Mountains. “I guess I expected to see mostly soil and mineral particles,” said the US Geological Survey researcher. Instead, he found multicolored microscopic plastic fibers.

The discovery, published in a recent study (pdf) titled “It is raining plastic”, raises new questions about the amount of plastic waste permeating the air, water, and soil virtually everywhere on Earth.

“I think the most important result that we can share with the American public is that there’s more plastic out there than meets the eye,” said Wetherbee. “It’s in the rain, it’s in the snow. It’s a part of our environment now.”

Rainwater samples collected across Colorado and analyzed under a microscope contained a rainbow of plastic fibers, as well as beads and shards. The findings shocked Wetherbee, who had been collecting the samples in order to study nitrogen pollution.

Rainwater samples collected across Colorado and analyzed under a microscope contained a rainbow of plastic fibers. Photograph: USGS

Ten Causes of Warming: The Layperson’s Checklist

by Jim Steele, August 8, 2019 in WUWT


All temperatures are not created equally. Rising temperatures have many causes. Good science demands we explore alternative hypotheses before reaching any conclusions. Below is a list of common causes of warming trends and heat events that everyone should consider in addition to any possible increased greenhouse effect.

1. Heat trapping surfaces: Asphalt and cement not only heat up much faster than natural habitat during the day, those materials hold the heat longer, increasing temperatures at weather stations situated near buildings and near asphalt. More asphalt, more warming, more record temperatures.

2. Loss of Vegetation: During the summer the temperature of a dry dirt road can be 60°F higher at noon, than ground shaded by trees. That’s why our pets instinctively seek the shade. Plants also bring moisture from below the ground that cools the air by evaporative cooling. Increasing deforestation or lost vegetation due to landscape changes cause regional warming trends.

3. Transport of heat: Natural climate oscillations alter air and ocean circulation patterns that can drive more heat from the tropics towards the poles. Europe’s recent heat wave was largely caused by air heated over the baking Sahara Desert and then driven into Europe. Similarly, the latest research finds variations in Arctic sea ice has been dominated by transport of warm Atlantic water heated in the tropics and transported northward via the Gulf Stream.

4. Less cloud cover: Recent research suggests a trend of less cloud cover resulted in increased solar heating of land and oceans. The added solar energy normally reflected by clouds was 2 times greater than what’s believed to be added by increasing carbon dioxide. Two decades of declining cloud cover was similarly shown to cause Greenland’s rapid ice melt between 1995 and 2012.

5. Less Cooling: Windy conditions cool the oceans. The unusually warm ocean conditions that occurred in the northwestern Pacific Ocean, known as the Blob, were caused by decreased winds that reduced normal cooling.

6-10: ….

….

AccuWeather Founder/CEO: No Evidence Heatwaves More Common From ‘Climate Change’

by Dr. J. N. Myers, Auhsut 8, 2019 in ClimateChangeDispatch


First, and most importantly, we warn people all the time in plain language on our apps and on AccuWeather.com about the dangers of extreme heat, as well as all hazards.

Furthermore, that is the reason we developed and patented the AccuWeather RealFeel® Temperature and our recently expanded AccuWeather RealFeel® Temperature Guide, to help people maximize their health, safety and comfort when outdoors and prepare and protect themselves from weather extremes.

The AccuWeather RealFeel Temperature Guide is the only tool that properly takes into account all atmospheric conditions and translates them into actionable behavior choices for people.

Second, although average temperatures have been higher in recent years, there is no evidence so far that extreme heatwaves are becoming more common because of climate change, especially when you consider how many heatwaves occurred historically compared to recent history.

New York City has not had a daily high temperature above 100 degrees since 2012, and it has had only five such days since 2002.

However, in a previous 18-year span from 1984 through 2001, New York City had nine days at 100 degrees or higher.

STRANGE CORAL SPAWNING IMPROVING GREAT BARRIER REEF’S RESILIENCE

by University of Queensland, August 7, 2019 in GWPF


The discovery was made by University of Queensland and CSIRO researchers investigating whether corals that split their spawning over multiple months are more successful at spreading their offspring across different reefs.

Dr Karlo Hock, from UQ’s School of Biological Sciences, said coral mass spawning events are one of the most spectacular events in the oceans.

“They’re incredibly beautiful,” Dr Hock said.

“On Australia’s Great Barrier Reef, all coral colonies typically spawn only once per year, over several nights after the full moon, as the water warms up in late spring.”

Study co-author Dr Christopher Doropoulos from the CSIRO Oceans & Atmosphere said sometimes however, coral split their spawning over two successive months.

“This helps them synchronise their reproduction to the best environmental conditions and moon phases,” he said.

“While reproductive success during split spawning may be lower than usual because it can lead to reduced fertilisation, we found that the release of eggs in two separate smaller events gives the corals a second and improved chance of finding a new home reef.”

The research team brought together multi-disciplinary skills in modelling, coral biology, ecology, and oceanography, simulating the dispersal of coral larvae during these split spawning events, among the more than 3800 reefs that make up the Great Barrier Reef.

Malfeasant Omissions? German Flagship ARD Broadcasting One-Sided, Drama-Making Sea Level Reporting

by Dr. S. Lüning, August 9, 2019 in NoTricksZone


What follows is another example of the tricks the mainstream media use to produce fake drama and urgency concerning sea level rise and climate change – namely omissions – and how geologist Sebastian Lüning held their feet to the fire.

Dr. Sebastian Lüning wrote a complaint to German ARD public broadcasting concerning its December 2, 2018, one-sided reporting of the Indian island of Ghoramara and the sea level rise it is allegedly experiencing. The €6.9 billion euro publicly funded, 22,612-employee ARD is the German equivalent to the UK’s BBC.

What follows is the exchange between Lüning and the ARD editorial staff:

Anthropocene: “it will be the rocks that have the final say” about this fake word.

by David Middleton, August 7, 2019 in WUWT


The fake geologic epoch known as the “Anthropocene” just won’t die… It’s like a zombie from a bad science fiction movie.

Despite being populated with activists like Naomi Oreskes, it has taken the AWG ten years to vote on what their conclusion will be and to start looking for evidence to support their conclusion… And the vote wasn’t unanimous.

Here’s where the Anthropocene dies…


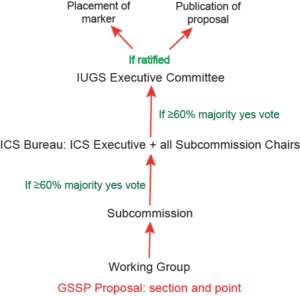
Figure 4 from Finney & Edwards.  “Workflow for approval and ratification of a Global Standard Stratotype Section and Point (GSSP) proposal. Extensive discussion and evaluation occurs at the level of the working group, subcommission, and International Commission on Stratigraphy (ICS) Bureau. If approved at these successive levels, a proposal is forwarded to the International Union of Geological Sciences (IUGS) for ratification. This process is also followed for other ICS decisions on standardization, such as approval of names of formal units, of revisions to the units, and to revision or replacement of GSSPs.”

Slowest start to Atlantic Hurricane season since 2004

by Anthony Watts, August 7, 2019 in WUWT


Watching the current maps and models, it appears the 2019 Atlantic Hurricane Season is off to a slow start. For people that the depend on disaster porn (climate alarmists, media) that means no weather events to claim as being climate driven.


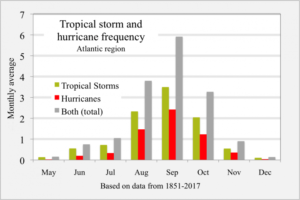
Graph of tropical storm and hurricane frequency, Atlantic region, monthly, based on data from 1851-2017. Data from NOAA at http://www.aoml.noaa.gov/hrd/tcfaq/E17.html Landsea, Chris (contributor from the NHC). “Total and Average Number of Tropical Cylones by Month (1851-2017)”. aoml.noaa.gov. National Oceanic and Atmospheric Administration, Atlantic Oceanographic and Meteorological Laboratory. Archived from the original on September 1, 2018.  Graph from RCraig.