Archives de catégorie : climate-debate

Britain’s Wild Weather–1940 Style

by P. Homewood, Dec 12, 2020 in NotaLotoPeopleKnowThat


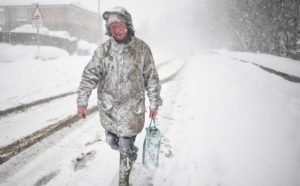
The Winter of 1939/40

https://visitmarple.co.uk/photos/displayimage.php?album=123&pid=6858


According to the BBC/Met Office, Britain’s weather has been wild this year, and it is getting wilder. And their evidence?

A wet February, dry May and a couple of hot days in August. Statistically of course, you are likely to get one of two of these sort of events every year, with records going back 150 years or so.

So let’s go back and compare 2020 with some earlier years on record. Far from cherry picking years, I am only going to look at years ending in a zero, starting with 1940. The years 1950 and 1960 will follow later.

The year started with what was the coldest January on record at the time, a record which has only been beaten since by the infamous winter of 1962/63.

Sea surface skin temperature

by A. May, Dec 9, 2020 in WUWT


In previous posts, see here and here, I’ve tried to show that because the oceans cover 71% of Earth and they contain 99% of the thermal energy stored on the Earth’s surface, they dominate the speed and magnitude of climate changes. In all my posts the Earth’s surface is defined as everything from the ocean floor to the top of the atmosphere. The details of the calculation of ocean and atmospheric heat content is detailed in this spreadsheet. The ocean’s huge heat capacity prevents large temperature swings and dampens and delays those that do occur.

Attempting to show the direction, speed, and magnitude of climate change by measuring and averaging atmospheric surface temperatures is pointless, in my opinion. The record we have of atmospheric and ocean surface temperatures is too short and far too inaccurate to provide us with useful trends on a climatic (30 years +) time scale. Further, these records are sporadic measurements in a chaotic surface zone that has large temperature swings. In Montana, United States, for example, recent minimum/maximum temperatures have been as low as -70°F (-57°C) and as high as 117°F (47°C). These enormous swings make measuring year-to-year global average differences of 0.1°C exceedingly difficult. Yet, this is the precision demanded if we are to properly characterize a climate that is only warming at a rate of roughly 1.4°C/century, which is 0.014°C per year and 0.14°C/decade.

New sunspot cycle could be one of the strongest on record, new research predicts

by National Center for Atmospheric Research/University Corporation for Atmospheric Research, Dec 7, 2020 in ScienceDaily


In direct contradiction to the official forecast, a team of scientists led by the National Center for Atmospheric Research (NCAR) is predicting that the Sunspot Cycle that started this fall could be one of the strongest since record-keeping began.

In a new article published in Solar Physics, the research team predicts that Sunspot Cycle 25 will peak with a maximum sunspot number somewhere between approximately 210 and 260, which would put the new cycle in the company of the top few ever observed.

The cycle that just ended, Sunspot Cycle 24, peaked with a sunspot number of 116, and the consensus forecast from a panel of experts convened by the National Aeronautics and Space Administration (NASA) and the National Oceanic and Atmospheric Administration (NOAA) is predicting that Sunspot Cycle 25 will be similarly weak. The panel predicts a peak sunspot number of 115.

L’effet de serre et le bilan énergétique de la Terre

by G. Gueskens, Dec 11, 2020 in ScienceClimatEnergie


Dans presque toutes les sciences, les notions élémentaires sont les plus difficiles et elles sont parfois mal comprises. Par la suite, elles sont souvent  négligées car elles ne s’opposent pas à la publication d’articles dans des domaines spécialisés où les auteurs, à la recherche de notoriété ou de subsides, sont jugés par leurs pairs. La climatologie, science récente et pluridisciplinaire par essence, n’échappe pas à cette règle. C’est ainsi que beaucoup de climatologues, réputés tels ou simples amateurs, développent des théories dont les hypothèses sont contraires aux principes fondamentaux de la chimie et de la physique. Néanmoins,  sur la base de ces théories mal étayées, des modèles informatiques sont élaborés qui conduisent, avec une précision rassurante, à des prévisions alarmantes. Dans cette note nous rappellerons d’abord quelques notions élémentaires concernant l’émission et l’absorption de rayonnements par la Terre et par les gaz atmosphériques avant de revoir d’un point de vue critique les notions généralement admises à propos de l’effet de serre et du bilan énergétique de la Terre.

1. Deux types de rayonnement à ne pas confondre.

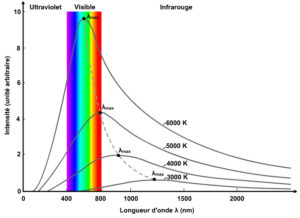
Fig. 1 Rayonnement thermique d’un corps solide à différentes températures

SUMMER SNOW FALLING IN NEW ZEALAND + GLOBAL COOLING

by Cap Allon, Dec 11, 2020 in Electroverse


A ‘white Christmas’ is an absurd prospect in New Zealand, but Southlanders could be forgiven for placing a bet or two this year after rare summer snow blanketed regions below 200m (650ft) Friday, December 11.

As originally reported by stuff.co.nz, temperatures plummeted overnight and snow, quite substantial in some parts, was falling in Northern Southland Friday morning–on State Highway 6 between Lumsden and Kingston, on Gorge Hill between Te Anau and Mossburn, and in hill country in the province.

There was also snow on the Remarkables mountain range in Queenstown, and flakes had settled in Arrowtown and in Garston. Photos of the snowfall were posted on the South Proud NZ Facebook Page with the caption: “Garston having a bit of a snow day today! So much for Summer huh?”


The natural ‘Himalayan aerosol factory’ can affect climate

by University of Helsinki, Dec 10, 2020 in WUWT


Large amounts of new particles can form in the valleys of the Himalayas from naturally emitted gases and can be transported to high altitudes by the mountain winds and injected into the upper atmosphere.

The emitted particles may eventually affect climate by acting as nuclei for cloud condensation. These new findings about particles formation and sources will contribute to a better understanding of past and future climate.

“To understand how the climate has changed over the last century we need to know as reliably as possible the natural atmospheric conditions before the industrialization,” says Associate Professor Federico Bianchi from the University of Helsinki’s Institute for Atmospheric and Earth System Research (INAR).

In order to do that scientists are looking for pristine locations around the world where human influence is minimal. An international group of researchers has now completed a comprehensive study at the Nepal Climate Observatory at Pyramid station, located in the proximity of the Everest base camp at 5050 m above sea level. There, they were able to investigate the formation of atmospheric particles far from human activities. The results were published today in the prestigious journal Nature Geoscience.

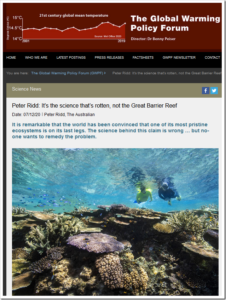
Peter Ridd: It’s the science that’s rotten, not the Great Barrier Reef

by P. Homewood, Dec 7, 2020 in NotaLotofPeopleKnowThat


The International Union for Conservation of Nature has released its latest report on the state of the Great Barrier Reef. It has turned up the volume by one notch, claiming the threat to the reef has gone from “significant concern” to “critical”. It blames climate change, agricultural pollution, coastal development, industry, mining, shipping, overfishing, disease, problematic native species, coal dust — you name it, it is killing the reef.

But the report is just a rehash of old, mostly wrong or misleading information produced by generally untrustworthy scientific institutions with an activist agenda and no commitment to quality assurance.

It is remarkable that the world has been convinced that one of its most pristine ecosystems is on its last legs. Part of the problem is that, being underwater and a long way from the coast, very few people visit the reef. The truth is hidden. Those of us in North Queensland living adjacent to the reef, and tourists from elsewhere, can report the water is iridescent clear blue and totally unpolluted. The fish and coral are fabulous.

CO2 Coalition: “The Global Mean Temperature Anomaly Record How it works and why it is misleading”

by D. Middleton,  Dec 8, 2020 in WUWT


Our friends at the CO2 Coalition have published another excellent report.

This white paper by Richard Lindzen and John Christy explores the global mean temperature anomaly record. Their focus isn’t on whether it’s right or wrong; it’s on its significance relative to natural variability and its inherently low signal-to-noise ratio. Here’s the executive summary:

STUDIES AND RESOURCES, WHITE PAPERS AND OTHER PUBLICATIONS

4 DEC, 2020
The Global Mean Temperature Anomaly Record
How it works and why it is misleading

by Richard S. Lindzen and John R. Christy

The CO2 Coalition is honored to present this Climate Issues in Depth paper by two of America’s most respected and prolific atmospheric physicists, MIT professor emeritus Richard Lindzen, who is a longtime member of the Coalition, and University of Alabama in Huntsville professor John Christy.

Professor Lindzen has published over 200 scientific articles and books over a five-decade career. He has held professorships at the University of Chicago, Harvard University and MIT. He is a fellow and award recipient of the American Meteorological Society and the American Geophysical Union. He is also a member of the National Academy of Science and was a lead author of the UN IPCC’s third assessment report’s scientific volume. His research has highlighted the scientific uncertainties about the impact of carbon dioxide emissions on temperature and climate more generally.

Professor Christy, the director of the Earth System Science Center at The University of Alabama in Huntsville, began studying global climate issues in 1987. He has been Alabama’s State Climatologist since 2000 and a fellow of the American Meteorological Society since 2002. He and CO2 Coalition member Dr. Roy W. Spencer developed and have maintained one of the key global temperature data sets relied on by scientists and government bodies, using microwave data observed in the troposphere from satellites since 1979. For this achievement, they were awarded NASA’s Medal for Exceptional Scientific Achievement.

The purpose of this paper is to explain how the data set that is referred to by policy-makers and the media as the global surface temperature record is actually obtained, and where it fits into the popular narrative associated with climate alarm.

Executive Summary
At the center of most discussions of global warming is the record of the global mean surface temperature anomaly—often somewhat misleadingly referred to as the global mean temperature record. This paper addresses two aspects of this record. First, we note that this record is only one link in a fairly long chain of inference leading to the claimed need for worldwide reduction in CO2 emissions. Second, we explore the implications of the way the record is constructed and presented, and show why the record is misleading.

This is because the record is often treated as a kind of single, direct instrumental measurement. However, as the late Stan Grotch of the Laurence Livermore Laboratory pointed out 30 years ago, it is really the average of widely scattered station data, where the actual data points are almost evenly spread between large positive and negative values.

The average is simply the small difference of these positive and negative excursions, with the usual problem associated with small differences of large numbers: at least thus far, the one-degree Celsius increase in the global mean since 1900 is swamped by the normal variations at individual stations, and so bears little relation to what is actually going on at a particular one.

Climate Activism: How Democracy Dies

by Donna Laframboise, Dec 6, 2020 in BigPicturesNews


Tomorrow night, Friends of Science will broadcast my speech, Climate Activism: Undermining Free Speech, Free Thought & Free Choice. Click here for details. (If you aren’t able to tune in then, purchasing a ticket will permit you to stream the event later, at your convenience.)

40 minutes in length, this talk explores how prominent members of the establishment have worked to shut down climate-related dialogue and debate. Those who express minority opinions have been cast as defective, depraved individuals on a par with Holocaust deniers.

The people fueling this incredible intolerance are prime ministers, vice presidents, UN officials, Nobel laureates, and Pulitzer Prize winners. There’s nothing admirable about silencing non-conformist perspectives. That’s how democracy dies.

The cancel culture now on full display on social media, in newsrooms, and on university campuses took root early in the climate world. Perhaps if more people had objected – loudly and on principal – to that improper behaviour, we’d be in a healthier, more tolerant place today.

Here’s a quote from my speech:

Claim: The climate changed rapidly alongside sea ice decline in the north

by University of Copenhagen, Dec 6, 2020 in WUWT


Researchers from the Niels Bohr Institute, University of Copenhagen have, in collaboration with Norwegian researchers in the ERC Synergy project, ICE2ICE, shown that abrupt climate change occurred as a result of widespread decrease of sea ice. This scientific breakthrough concludes a long-lasting debate on the mechanisms causing abrupt climate change during the glacial period. It also documents that the cause of the swiftness and extent of sudden climate change must be found in the oceans.

Scientific evidence for abrupt climate change in the past finally achieved

During the last glacial period, app. 10,000 – 110,000 years ago the northern hemisphere was covered in glacial ice and extensive sea ice, covering the Nordic seas. The cold glacial climate was interrupted by periods of fast warmup of up to 16.5 degrees Celsius over the Greenland ice sheet, the so called Dansgaard Oeschger events (D-O).

These rapid glacial climate fluctuations were discovered in the Greenland ice core drillings decades ago, but the cause of them have been hotly contested. D-O events are of particular significance today as the rate of warming seems to be very much like what can be observed in large parts of the Arctic nowadays. The new results show that the abrupt climate change in the past was closely linked to the quick and extensive decline in sea ice cover in the Nordic seas. Very important knowledge as sea ice is presently decreasing each year.

“Our, up until now, most extensive and detailed reconstruction of sea ice documents the importance of the rapid decrease of sea ice cover and the connected feedback mechanisms causing abrupt climate change”, says Henrik Sadatzki, first author of the study.

Sediment core and ice core data were combined in order to achieve the result

No, It Was Not A Record Hurricane Season!

by P. Homewood, Dec 3, 2020 in NotaLotofPeopleKnowThat


Inevitably the busy hurricane season this year is getting blamed on global warming:

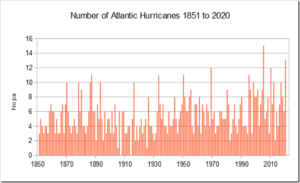
But first of all, let’s get one thing clear – there was not a record number of hurricanes this year in the Atlantic. There were 13 hurricanes, compared to 15 in 2005:

https://www.aoml.noaa.gov/hrd-faq/#tcs-after-1930


It is true that there were more named storms, which includes tropical storms as well as hurricanes, this season than in any other year, but this is quite meaningless. Over the years, reporting practices have drastically changed, so that more storms are spotted and named now.


CAGW failed ‘Predictions’

by R. Istvan, Dec 4, 2020 in WUWT


My last ruminating climate guest post compared ‘big’ climate science issues to ‘weeds’. This is a follow on big picture post, from a different perspective, albeit partly overlapping the first. (First perspective was basic science claims, this is resulting predictions.) I am tired of whack-a-mole minutia, and think that detailed rebuttals to garbage climate alarm papers no longer matter in our politicized ‘GND’ environment.

This post incorporates by reference (not by links [lazy me], just by key WUWT search words or other occasional generic mentions) many previous WUWT guest posts plus other writings that relative newbies can review for your selves. All the previous referenced posts and other writings have many linked reference footnotes for your personal follow up. Trolls, beware.

Since the Charney and Hanson 1988 climate alarm proceedings, there have been many dire climate prognostications. NONE have come true.  Lets review some of the most salient. (We skip trivial stuff like Dr. Viner’s since disappeared 1990 prediction that ‘UK children will not know snow’—since they soon did.)

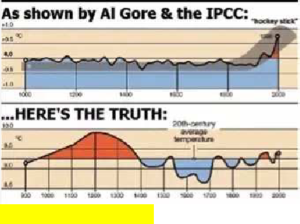
  1. Temperatures have recently suddenly risen. This was the essence of MBH’s 1999 hockey stick, and later 2013’s Marcott’s equivalent. Both ‘observations’ have been fully discredited. (I personally proved Marcott’s academic misconduct in essay ‘High Stick Foul’ in ebook Blowing Smoke in late 2014.)  True, temperatures have risen since the last Thames Ice Fair in 1814, as the world warmed out of the Little Ice Age (LIA). Climate changes… How much, we dunno for three reasons:
    • In the US, early data is sparse, and later data is contaminated by multiple surface station siting issues. The latter issue proven here at WUWT by 2009.
    • Outside the US and Europe, land temp data is worse than just sparse, it often does not exist at all, or only recently.
    • Over oceans comprising 71% of the Earth surface, data is worse than just sparse. It is mostly non-existent (SH). Where it does exist (until ARGO) it is contaminated by trade routes and ladings.
  2. Temperatures will increase unsustainably. This is based on the IPCC nominal ECS of about 3, recently goosed up by forthcoming CMIP6. Except, temps have NOT. As just one example of predictive model falsification, the CMIP4/5 models predicted tropical troposphere hotspot simply does NOT exist. There are several reasons why these models have abjectly failed, explained in several previous posts.
  3. Sea level rise accelerates. Except it hasn’t. And the most accurate SLR dGPS corrected tide gauges not only show no acceleration, they show it with ~closure (thermosteric rise plus ice sheet melt). And, the present rise rate is no different from the peak of the previous interglacial, the Eemian. (Details are in previous WUWT posts and in essay PseudoPrecision in eBook Blowing Smoke)
  4. Polar bears will go extinct from lack of summer sea ice. Except as Dr. Crockford has amply explained, this is an alarmist misconception at two levels. First, polar bears do not depend on summer sea ice. They depend on spring ice during the seal welping season, their main feeding cycle. No one suggests that is diminishing. Second, Arctic sea ice is cyclical, and the notion that it is spiraling ever down (Wadham’s alarm) is just factually wrong. (Essay Northwest Passage in ebook Blowing Smoke covers the Arctic Ice cycle issue in historical detail.)
  5. Extreme weather increases. Except per IPCC SRES (2012) it has NOT, anywhere, in any form. (Climate is rigorously defined as the envelope of weather [like temp, rainfall] over at least 30 years.) All the annual recent climate ‘extremes’ in the press are just weather (like this year’s accurately predicted overactive Atlantic hurricane season). As an example, landfalling US hurricane ACE over 30 years has NOT increased as a recent paper claimed—by falsely including hurricanes that touched land but then went back out to sea and re-intensified.

There are also a lot of unworkable ‘Green New Deal solutions’ to this non-problem. The most prominent are ‘renewable electric generation’ and EV’s.

SUBSTANTIAL EARLY-DECEMBER SNOW FORECAST TO BLANKET THE UK AND EUROPE: 11 FOOT (3.28 METRES) PREDICTED IN THE ALPS

by Cap Allon, Dec 2, 2020 in Electroverse


The UK is set for a flurry of heavy and rare early-December snow this week, with even far southern regions on course for disruptive accumulations.

The first dusting is expected to arrive across the northern half of the UK today, Dec. 2, and more will follow in the coming days, to more southern regions, too, as a descending Arctic blast tightens its grip on the nation.

Heavy snow is likely to have buried vast swathes of the country by Friday, with forecasters suggesting the bitter wintry mix could even rage on until the middle of next week -at least- with hard frosts also expected: “In the clear periods between bands of wintry showers, frosts are likely and these could be sharp or even severe in prolonged clear conditions in north-western parts of the UK,” warns Steve Ramsdale, Chief Meteorologist at the Met Office.

Over the next 5 days alone, latest GFS runs reveal Britain will be hit by a substantial smattering of early-season snow as frigid polar air rides anonymously-far south on the back of a meridional jet streama setup shown to increase during times of low solar activity–such as we’re suffering now:


Covid-19 et émissions de CO2

by Prof. Jean N., Dec. 1, 2020 in ScienceClimatEnergie


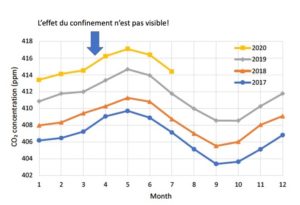
Début avril 2020, sans que personne ne s’en rende compte, une expérience scientifique très intéressante a été menée, et ce de manière involontaire. En effet, 3,9 milliards de personnes dans le monde ont été placées en confinement suite à l’expansion du virus Covid-19. Il en a résulté une très forte diminution du trafic aérien et automobile accompagné d’une fermeture temporaire de nombreuses industries dans le monde entier. Cette expérience a évidemment provoqué une chute drastique des émissions de CO2 anthropique. Mais pendant l’expérience, les détecteurs mesurant le taux de CO2 atmosphérique ont continué à tourner. Nous disposons maintenant des résultats. Cette diminution abrupte des émissions a-t-elle eu un impact sur le taux de CO2 atmosphérique, ou sur la température globale? C’est ce dont nous allons discuter dans le présent article.

1. Bref rappel concernant la mesure du taux de CO2 atmosphérique.

L’observatoire de Mauna Loa à Hawaii est l’un des plus célèbres sites mesurant en continu le taux de CO2 atmosphérique. Ce taux est mesuré avec précision depuis 1959 par une méthode de spectrométrie infra-rouges, et depuis 2019 par la méthode CRDS (Cavity Ring-Down Spectroscopy). La courbe obtenue est croissante avec des oscillations régulières (Figure 1). De ± 320 ppm en 1959 on arrive à ± 410 ppm en 2020. SCE a d’ailleurs publié une suite d’articles sur ce sujet[1].

Figure 3. Taux de CO2 mesuré à Mauna Loa depuis 2017. Source : Koutsoyiannis & Kundzewicz (2020) Sci 2020, 2, 72

….

Internal Multidecadal and Interdecadal Climate Oscillations: Absence of Evidence Is No Evidence of Absence

by G. Müller-Plath, Nov 29, 2020 in WUWT


Introduction

The present paper contributes a critical commentary on the recent finding by Mann, M. E., Steinman, B. A. and Miller, S. K (2020). Absence of internal multidecadal and interdecadal oscillations in climate model simulations. Nat. Commun. 11, 1–9.

Climate oscillations are recurring large-scale fluctuations in the surface temperatures of the oceans in connection with the atmosphere. This commentary focuses on the Pacific Decadal Oscillation (PDO, interdecadal timescale) and the Atlantic Multidecadal Oscillation (AMO, multidecadal timescale), which have been regarded as intrinsic climate drivers on the adjacent continents in numerous studies based on observations and paleoclimate reconstructions (Henley, 2017O’Reilly et al., 2017). In a recent paper, Michael E. Mann and colleagues (Mann et al., 2020, hereafter M20) fail to find a PDO signal in global measured and modeled temperatures that is statistically different from noise. They further propose that the significant AMO-like signal is mainly due to anthropogenic aerosols in the 20th century, and to statistical artifacts before. Therefore they doubt the intrinsic nature of the two oscillations. The present paper shows that M20’s results are largely artifacts themselves with issues ranging from using inadequate data and referencing improper literature on anthropogenic aerosols with regards to the AMO to inappropriately interpreting the results with regards to the PDO.


Physicists: A CO2 Rise To 800 ppm Causes ‘Hypothetical’ 10°C Upper Atmosphere Cooling, 1.4°C Surface Warming

by Wijnagaarden & Happer, Nov 26, 2020 in NoTricksZone


At the current concentrations, the forcing power for greenhouse gases like CO2 (~400 ppm) and CH4 (1.8 ppm) are already saturated. Therefore, even doubling the current greenhouse gas concentrations may only increase their forcings “by a few percent” in the parts of the atmosphere where there are no clouds. When clouds are present, the influence of greenhouse gases is even further minimized.

While the “consensus” model view is that doubling CO2 from 280 ppm to 560 ppm results in a surface forcing of 3.7 W/m², Wijngaarden and Happer find doubling CO2 concentrations from 400 to 800 ppm increases climate forcing by 3 W/m². This warms the surface by 1.4 K as it “hypothetically” cools the upper atmosphere by 10 K.

Equilibrium climate sensitivity (when positive feedback with water vapor is included) is identified as 2.2 K, which is within 10% of multiple other analyses.

In The Climate Debate, It’s Either Fake News, Biased News, Or No News

by Ed Walbroehl, Nov 27, 2020 in ClimateChangeDispatch


Take your pick. The Mainstream Media (MSM) are using all three to stifle debate on climate change just like the current presidential election. What has happened to the American news media in this country?

I can remember a time when the MSM would do a story and would give you both sides of the issue and let the viewer decide what to think.

It’s amazing to see a business so willing to undermine its own credibility to push a certain narrative thinking everybody is stupid and will buy whatever they say.

In the case of the climate change issue, they even went as far as announcing no more so-called climate skeptics would be invited on their shows to give other opinions as is the case with NBC’s Meet the Press for example.

So much for a fair and balanced debate. Oh! I forgot. According to them, the science is settled. By who? That phrase the science is settled is the first clue that tells you a scientist is probably not a real scientist.

Real scientists know that new methods, learning, tools, ideas, and experiments will come about that will change our current knowledge and understanding of many scientific issues.

The MSM are even willing to lose viewers by lying to them. Look how foolish they looked when all this Russian collusion with the president turned out. Many viewers left after they found out they were being lied to.

Look what’s happening now as people start checking the facts on their own about climate change. They’re seeing that they are being lied to once again.

It’s probably why in many polls, the American people rank climate change near the bottom of what worries us, and why trust in the media is so low.

SKEPTICISM RISING – 150+ scientists including 60 Nobel Prize winners doubt that ‘climate change is caused by humans.

by J.G. Matkin, Nov 28, 2020 in AcademiaEdu

Surveys of public opinion show that a significant minority of the population are sceptical about climate change, and many suggest that doubt is increasing. The Internet, in particular the blogosphere, provides a vast and relatively untapped resource of data on the thinking of climate sceptics. This  paper focuses on one particular example where over 150 climate sceptics  provide information on their background, opinion on climate change and reasons for their scepticism. Although this data cannot be regarded as representative of the general public, it provides a useful insight into the reasoning of those who publicly question climate science on the web. Points of note include the high level of educational background, the significant numbers who appear to have been converted from a position of climate concern to one of scepticism, and the influence of blogs on both sides of the climate debate.
 
https://www.academia.edu/12247717/Why_are_people_sceptical_about_climate_change 
 The main concern of this group of sceptics is with the quality of the science, focusing on issues such as statistics, data handling and reliance on models, with the hockey stick picture acting as the icon for the dispute.
https://www.tandfonline.com/doi/… It is behind a paywall but there is a preprint version here: https://ipccreport.files.wordpre… The paper is based on comments that 150 skeptics wrote on a blog thread asking them about their background. Reasons include:
 
Hyped, exaggerated claims in the media
 Previous experience of scare stories that have failed to materialize
Political activism
Climategate
Shoddy science Full detail of survey results below :

The U.S. National Temperature Index, is it based on data? Or corrections?

by Andy May, Nov 24, 2020 in WUWT


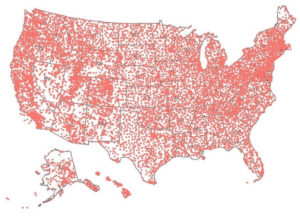
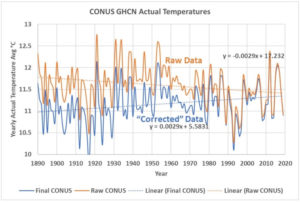
The United States has a very dense population of weather stations, data from them is collected and processed by NOAA/NCEI to compute the National Temperature Index. The index is an average temperature for the nation and used to show if the U.S. is warming. The data is stored by NOAA/NCEI in their GHCN or “Global Historical Climatology Network” database. GHCN-Daily contains the quality-controlled raw data, which is subsequently corrected and then used to populate GHCN-Monthly, a database of monthly averages, both raw and final. I downloaded version 4.0.1 of the GHCN-Monthly database on October 10, 2020. At that time, it had 27,519 stations globally and 12,514 (45%) of them were in the United States, including Alaska and Hawaii. Of the 12,514 U.S. stations, 11,969 of them are in “CONUS,” the conterminous lower 48 states. The current station coverage is shown in Figure 1.

Figure 1. The GHCN weather station coverage in the United States is very good, except for northern Alaska. There are two stations in the western Pacific that are not shown.

igure 4. The orange line is the uncorrected monthly mean temperature, which is “qcu” in NOAA terminology. The blue line is corrected, or NOAA’s “qcf.”

Carbon dioxide levels continue at record levels, despite COVID-19 lockdown

by WMO, Nov 23, 20°20


2020 Trends

The Global Carbon Project estimated that during the most intense period of the shutdown, daily CO2 emissions may have been reduced by up to 17% globally due to the confinement of the population. As the duration and severity of confinement measures remain unclear, the prediction of the total annual emission reduction over 2020 is very uncertain.


“We do not deny climate change”: Rupert Murdoch Responds to Accusations

by E. Worall, Nov 20, 2020 in WUWT


Tolerating diversity of opinion, in the form of providing wildly popular Murdoch Media personalities like Andrew Bolt a platform, does not mean Murdoch agrees with everything those personalities say.

But I guess old fashioned ideas like news managers giving their best journalists editorial freedom are no longer encouraged, at least when it comes to climate change.

Greens can be unforgiving of minor deviations from their dogma, even from people who helped found their movement.

Retired NASA scientist James Hansen, whose 1988 testimony pretty much kick started the climate movement, was accused of being a “denier” in 2015, because he does not think renewables alone will be enough to curb global CO2 emissions.

It is difficult to imagine someone being more alarmist than James Hansen; Hansen thinks the oceans will literally begin to boil if we don’t rapidly curb CO2 emissions. But Hansen still faced accusations of being a “denier”, because he thinks nuclear power should be an important part of the solution to climate change.

Possible 1,000-kilometer-long river running deep below Greenland’s ice sheet

by  Hokkaido University, Nov 12, 2020 in EurekaAlert


Computational models suggest that melting water originating in the deep interior of Greenland could flow the entire length of a subglacial valley and exit at Petermann Fjord, along the northern coast of the island. Updating ice sheet models with this open valley could provide additional insight for future climate change predictions.
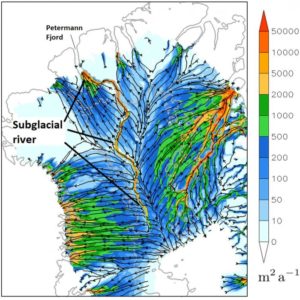
IMAGE: THE SUGGESTED VALLEY AND POSSIBLE RIVER FLOWING FROM THE DEEP INTERIOR OF GREENLAND TO PETERMANN FJORD DEEP BELOW GREENLAND’S ICE SHEET (500 METERS BELOW SEA LEVEL). (CHRISTOPHER CHAMBERS ET AL,… view more 

CREDIT: CHRISTOPHER CHAMBERS ET AL, THE CRYOSPHERE, NOVEMBER 12, 2020.

Radar surveys have previously mapped Greenland’s bedrock buried beneath two to three thousand meters of ice. Mathematical models were used to fill in the gaps in survey data and infer bedrock depths. The surveys revealed the long valley, but suggested it was segmented, preventing water from flowing freely through it. However, the peaks breaking the valley into segments only show up in areas where the mathematical modelling was used to fill in missing data, so could not be real.

Christopher Chambers and Ralf Greve, scientists at Hokkaido University’s Institute of Low Temperature Science, wanted to explore what might happen if the valley is open and melting increases at an area deep in Greenland’s interior known for melting. Collaborating with researchers at the University of Oslo, they ran numerous simulations to compare water dynamics in northern Greenland with and without valley segmentation.

The results, recently published in The Cryosphere, show a dramatic change in how water melting at the base of the ice sheet would flow, if the valley is indeed open. A distinct subglacial watercourse runs all the way from the melting site to Petermann Fjord, which is located more than 1,000 kilometers away on the northern coast of Greenland. The watercourse only appears when valley segmentation is removed; there are no other major changes to the landscape or water dynamics.

“The results are consistent with a long subglacial river,” Chambers says, “but considerable uncertainty remains. For example, we don’t know how much water, if any, is available to flow along the valley, and if it does indeed exit at Petermann Fjord or is refrozen, or escapes the valley, along the way.”

If water is flowing, the model suggests it could traverse the whole length of the valley because the valley is relatively flat, similar to a riverbed. This suggests no parts of the ice sheet form a physical blockade. The simulations also suggested that there was more water flow towards the fjord with a level valley base set at 500 meters below sea level than when set at 100 meters below. In addition, when melting is increased only in the deep interior at a known region of basal melting, the simulated discharge is increased down the entire length of the valley only when the valley is unblocked. This suggests that a quite finely tuned relationship between the valley form and overlying ice can allow a very long down-valley water pathway to develop.

“Additional radar surveys are needed to confirm the simulations are accurate,” says Greve, who has been developing the model used in the study, called Simulation Code for Polythermal Ice Sheets (SICOPOLIS). “This could introduce a fundamentally different hydrological system for the Greenland ice sheet. The correct simulation of such a long subglacial hydrological system could be important for accurate future ice sheet simulations under a changing climate.”

Uncertain Certainty: Germany’s Potsdam Climate Institute Humiliated After One-Year El Nino Forecast Model Flops

by P. Gosselin, Nov 15, 2020 in WUWT


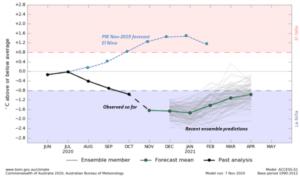
Last year Germany’s Potsdam Institute (PIK) boasted that it had a superior El Niño one-year forecasting model, claiming 80% certainty. Today, a year later, its forecast emerges totally wrong and the prestigious institute is left humiliated. 

Hat-tip: Snowfan

In 2019, Germany’s Potsdam Climate Institute (PIK) boasted that it had a superior El Niño forecasting model, claiming one year in advance and with 80% certainty, there would be an El Niño event late in 2020 (upper curve is just an El Niño illustration). But the PIK model forecast flopped totally. The opposite has in fact emerged. Chart source: BOM (with additions).

One year ago, together with researchers of the Justus Liebig University Giessen (JLU), and Bar-Ilan University in Ramat Gan in Israel, Germany’s alarmist yet highly regarded Potsdam Institute for Climate Research (PIK) boldly declared in a press release there would “probably be another ‘El Niño’ by the end of 2020.”

Modern Climate Change Science

by A. May, Nov 12, 2020 in WUWT


The first modern theoretical estimates of ECS were reported in 1979 in the so-called “Charney Report” (Charney, et al., 1979). They reported, on page 2, a theoretical ECS of 1.5°C to 4.5°C per doubling of the CO2 atmospheric concentration. This estimate included an estimate of water vapor feedbacks, the effect of ice and their assumed uncertainties. Absent any water vapor feedback their computed value was 1°C per doubling of CO2. They also supply a likely value of 2.4°C on page 9, although on page 2 they offer a value “near 3.0.” The page 9 value is not far off from the empirical estimate of 2°C made by Guy Callendar in 1938, but significantly higher than the 1.2°C to 1.95°C (17% to 83% range, best estimate 1.5°C) given by Nic Lewis and Judith Curry (Lewis & Curry, 2018).

The IPCC, in their AR5 report (Bindoff & Stott, 2013), estimate ECS as lying between 1.5°C and 4.5°C and provide no best estimate. This range is precisely the same as the Charney Report made 34 years earlier. While the empirical, observation-based, estimates have narrowed significantly, the theoretical range has not changed, despite thousands of government-funded scientists spending billions of dollars trying to do so. The data is very much the same today and churning it faster with more powerful computers and billions of dollars doesn’t seem to matter. It works the same way with manure.

Digging deeply into the AR5 internals, as Monckton, et al. did in MSLB15, a paper entitled, “Why Models run hot: results from an irreducibly simple climate model” (Monckton, Soon, Legates, & Briggs, 2015), we see that the elements of the AR5 theoretical calculations suggest that the range is narrowing in a downward direction. Given the political environment at the IPCC, one can easily suspect that the politicians do not want to admit the theoretical risks of CO2-caused climate change are lessening. As more empirical estimates of the CO2 effect appear and more theoretical work is done, one wonders how long the politicians can support the clearly inflated range of 1.5°C to 4.5°C?

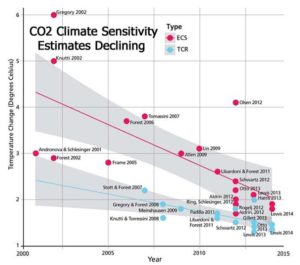
Estimates of ECS have been declining for a long time, as shown in 2017 by Nicola Scafetta and colleagues. Figure 1 is from their paper:

The decline in estimates of ECS from 2000 to 2015. Source: Scafetta, Mirandola, and Bianchini, 2017.

MULTIPLE COLD RECORDS FELL IN CALIFORNIA MONDAY

by Cap Allon, Nov 10, 2020 in Electroverse


After months of EOTW articles regarding California’s summer heat and largely self-inflicted wildfires, record COLD has now swept The Golden State — and the MSM has fallen eerily quiet

Before Monday rewrote the record books in western California, back-to-back weekend storms on Friday and Sunday brought frigid temperatures and heavy snow to much of the state, reports ktvu.com.

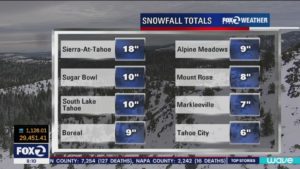
A whopping 18 inches of snow blanketed the Sierra-at-Tahoe ski resort and a healthy 10 inches accumulated at Sugar Bowl over the weekend, prompting a travel advisory throughout the Sierra Nevada.

Weekend Snowfall Totals [ktvu.com].

Forwarding to Monday, a number of low temperature records were broken.

It dropped to 38F (3.3C) at the Oakland Airport Monday morning, a reading that smashed the old record of 41F set in 2009 (solar minimum of cycle 23).

Gilroy, located in Santa Clara County, also set new low Monday — the city’s official reading of 31F (-0.6C) in the early hours of Nov 9 busted the old record of 34F (1.1C) set back in 1986 (solar minimum of cycle 21).