Archives de catégorie : climate-debate

Weather Extremes? Are they caused by global warming?

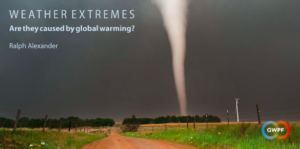
by Ralph Alexander, June 4, 2020 in CO2Colation


Critical Review Confirms IPCC Assessment On Extreme Weather: “No sign that extreme weather events are getting worse”

The paper, by physicist Dr Ralph Alexander, looks at trends in hot and cold weather extremes, floods and droughts, hurricanes and wildfires and finds only a minor increase in cold weather extremes.

According to Dr Alexander, weather extremes is one area where the IPCC has been reasonably empirical and scientific in recent years.

As he explains:

The IPCC stands out, among those who believe that global warming is primarily due to human activity, as a voice of restraint on the issue of extreme weather. My review is in broad agreement with their position: there is little sign things are getting worse.”

In particular, Dr Alexander points to the underreported global reductions in floods, wildfires and hurricanes, but he cautions that many of the changes are likely to be cyclical.

The key driver for many weather extremes is natural ocean cycles like El Nino and the Atlantic Multidecadal Oscillation. Eventually these cycles will turn, and we should be ready. But we shouldn’t be under any illusion that we can prevent extreme weather by changing our lifestyles”.

Weather Extremes: Are They Caused By Global Warming? (pdf)

COVID-19 Global Economic Downturn not Affecting CO2 Rise: May 2020 Update

by Roy Spencer, June 5, 2020 in GlobalWarming


The Mauna Loa atmospheric CO2 concentration data continue to show no reduction in the rate of rise due to the recent global economic slowdown. This demonstrates how difficult it is to reduce global CO2 emissions without causing a major disruption to the global economy and exacerbation of poverty.

After removal of the strong seasonal cycle in Mauna Loa CO2 data, and a first order estimate of the CO2 influence of El Nino and La Nina activity (ENSO), the May 2020 update shows no indication of a reduction in the rate of rise in the last few months, when the reduction in economic activity should have shown up.

I had previously explained why the slowdown would likely not be large enough to affect measured atmospheric CO2 levels compared to natural variations in global sources and sinks of CO2. I calculated that the Energy Information Administration-estimated 11% reductions in CO2 emissions during 2020 would have to be four times larger to stop the rise of atmospheric CO2 over 2019 values (assuming no substantial natural variations in CO2 sources and sinks).

See also

Global Economic Downturn Not Affecting CO2 Rise: May 2020

New Analysis Confirms Extreme Weather Not Getting Worse

by B. Peiser, June 4, 2020 in ClimateChangeDispatch


A new review of the scientific literature on extreme weather events published today by the Global Warming Policy Foundation (GWPF) confirms what IPCC assessment reports have concluded: There is little evidence of any significant changes in most indices.

The paper, by physicist Dr. Ralph Alexander, looks at trends in hot and cold weather extremes, floods and droughts, hurricanes, and wildfires and finds only a minor increase in cold weather extremes.

BBC’s Fake Claim About “Hottest May”

by P. Homewood, June 5, 2020 in NotaLotofPeopleKnowThat


I make no comment about the global numbers, but would simply point out that none of the official agencies have released their data for May. The BBC claim comes from Copernicus, the EU agency, not regarded as a reliable source.

However the BBC claim about the UK is hopelessly wide of the mark. According to the Met Office, last month was only the 15th warmest May since 1884, and was not even as warm as 1893 and 1911!

https://www.metoffice.gov.uk/research/climate/maps-and-data/uk-temperature-rainfall-and-sunshine-time-series

Such sloppy reporting is only too common at the BBC, and not just where climate change is concerned. It only takes a minute to find the Met Office data, and I find it hard to understand why the programme editors did not think it worthwhile checking such an outlandish claim first.

Needless to say, I have filed a complaint, to add to the list of BBC climate lies!!


Models Can’t Accurately Predict Next Week’s Weather, So Why Should We Trust Them To Predict Climate Change?

by D. Turner, June 2, 2020 in WUWT


It’s curious … SpaceX has all the money in the world, and they didn’t hire someone who could have accurately predicted the afternoon weather in Florida on May 27, 2020.  Seems like a huge oversight, doesn’t it?  And to think there are scores of nonprofit leaders and academics in Washington, DC who can accurately predict global temperatures 10, 15, even 50 years into the future.

Oh, stop it with the “climate isn’t weather” rebuttal. It’s trite and silly. The guys who says “food isn’t cuisine” is a food critic, and by default, haughty and obnoxious.

How about this one: science isn’t semantics.

Sunny May–But Only The 48th Warmest

by P. Homewood, June 3, 2020 in NotaLotofPeopleKnowThat


While we’re on with Harrabin’s hysterics about May’s sunny weather being due to climate change, it is appropriate to point out to him that last month was far from being the hottest on record in England:

https://www.metoffice.gov.uk/hadobs/hadcet/data/download.html


In fact there have been 47 hotter Mays since 1659. The hottest was 1833, and the five hottest were all pre 1850.

See also:  UAH Global Temperature Update for May 2020: +0.54 deg. C

Quarantines, Lockdowns Had No Impact On Global CO2 Levels

by Climate at a Glance, June 1, 2020 in ClimateChangeDispatch


The COVID-19, aka Coronavirus pandemic, is causing a worldwide shutdown in economic activity as businesses close, airlines cancel flights, energy production is reduced, and people shelter in their homes and drive less.

Climate activists expected this economic downtown to translate to less energy usage, and therefore less CO2 emissions globally.

While that has indeed happened, with China seeing a 40% emissions drop, and an expected 11% reduction in energy-related CO2 emissions in the U.S. this year, it didn’t translate into the proof they were seeking.

What scientists are looking for is any evidence of a decline in global atmospheric CO2 concentrations that would be strong enough to attribute to the economic downturn.

University of Alabama climate scientist Dr. Roy Spencer used a simple method1 for removing the large seasonal CO2 cycle2, due to plant photosynthesis increases/decreases with seasons, from the Mauna Loa CO2 data, and well as the average effects from El Nino and La Nina events, which change the rate of ocean outgassing of CO2.

The result: no obvious downtown in global CO2 levels has been observed3,4.

As can be seen in Figure 1, the latest CO2 data show no downtrend, but instead just a ripple, that is not unlike other ripples in the graph when there was no crisis and resulting economic downturn.

Figure 1: Using a simple method1 for removing the large seasonal cycle from the Mauna Loa CO2 data, and well as the average effects from El Nino and La Nina events, no obvious downtown in global CO2 levels has been observed4. Analysis by Dr. Roy Spencer.


Cook’s 97% Scam Debunked

by P. Homewood, October 29, 2020 in NotaLotofPeopleKonwThat


Yesterday, we saw how easily debunked the original “97% of scientists agree” turned out to be.

There therefore had to be a renewed attempt by the warmist establishment to make the claim stick, so step forward John Cook with a much more sophisticated scam.

Jose Duarte, expert in Social Psychology, Scientific Validity, and Research Methods, has actually called the Cook paper “multiply fraudulent”, and, as far as I know, Cook has taken no action to challenge the claim. This, as much as anything else, shows just what a con trick the whole business was. How many scientists, after all, would accept being called fraudulent without taking action?

See also

https://www.youtube.com/watch?

v=ZZrORkOGdYYhttps://www.youtube.com/watch?v=p1KoCMUYL20


WASHINGTON, D.C. JUST SUFFERED ITS COLDEST MAY SINCE 2005

by Cap Allon, June 2, 2020 in Electroverse


Like April, May was cooler than average across the District,” admits filthy warm-mongers the washingtonpost.com in a recent article. The month officially logged an average temperature of just 63.8F, which is 2.2F below the 30-year average, and made for Washington’s coldest May in 15 years.

The average temperature more closely matched a typical May in New York City, points out the Southeast Regional Climate Center. And with NYC located some 200 miles north of Washington, May 2020 serves as a great illustration of how the GSM is driving the COLD LINE south.

The past two months also marked the first time since 2003 that both April and May were colder than average across the District.

In addition, May 9’s daily high of 52F was the lowest-high during the month of May since May 12, 2008 (solar minimum of cycle 23), and the chill even brought a few snow flurries to Washington’s far north and west suburbs. That 52F on May 9 also matched the record lowest-high for the date which was set way back in 1877 (solar minimum of cycle 11).

Many more all-time cold-records fell across the District that day; including Dulles smashing its record for min-high from 1977 (solar minimum of cycle 20), and Baltimore toppling both its all-time min-low from 1966 (solar minimum of cycle 19) as well as its min-high set back in 1977 (solar min of cycle 20)and 1947 (solar min of cycle 17).

Destroying the environment to save it

by Ch. Rotter, May 31, 2020 in WUWT


Pseudo-green energy will wreak devastation, pretending to prevent exaggerated climate harm

Paul Driessen

“We had to destroy the village in order to save it.” The infamous Vietnam era quotation may or may not have been uttered by an anonymous US Army major. It may have been misquoted, revised, apocryphal or invented. But it quickly morphed into an anti-war mantra that reflected attitudes of the time.

For Virginians and others forced to travel the path of “clean, green, renewable, sustainable” energy, it will redound in modern politics as “We had to destroy the environment in order to save it.”

Weeks after Governor Ralph Northam signed Virginia’s “Clean Economy Act,” which had been rushed through a partisan Democrat legislature, Dominion Energy Virginia announced it would reach “net zero” greenhouse gas emissions by 2050. To do so, the utility company will raise family, business, hospital and school electricity bills by 3% every year for the next ten years – as these customers and state and local governments struggle to climb out of the financial holes created by the ongoing Coronavirus lockdown.

Just as bad, renewable energy mandates and commitments from the new law and Dominion’s “integrated resource plan” will have major adverse impacts on Virginia and world environmental values. In reality, Virginia’s new “clean” economy exists only in fantasy land – and only if we ignore “clean” energy CO2 emissions, air and water pollution, and other environmental degradation around the world.

Dominion Energy plans to expand the state’s offshore wind, onshore solar and battery storage capacity by some 24,000 megawatts of new “renewable” energy by 2035, and far more after that. It will retain just 9,700 MW of existing natural gas generation, and only through 2045, build no new gas-fired units, and retire 6,200 megawatts of coal-fired generation. This will reduce in-state carbon dioxide emissions, but certainly won’t do so globally. The company intends to keep its four existing nuclear units operating.

To “replace” some of its abundant, reliable, affordable fossil fuel electricity, Dominion intends to build at least 31,400 megawatts of expensive, unreliable solar capacity by 2045. The company estimates that will require a land area some 25% larger than 250,000-acre Fairfax County, west of Washington, DC. That means Dominion Energy’s new solar facilities will blanket 490 square miles (313,000 acres) of beautiful croplands, scenic areas and habitats that now teem with wildlife.

Arctique géologique, part 2

by Van Vliet-Lanoë B. and Préat A., 29 mai 2020 in ScienceClimatEnergie


4/ Les cycles glaciaires  arctiques (Pliocène/Pléistocène)

4.1. Introduction : le forçage orbital et l’englaciation

Le climat de la Terre est géré à un premier niveau par l’apport énergétique lié à l’apport solaire, en fonction de l’évolution cyclique de la forme de l’orbite de notre planète autour du soleil. Ce forçage s’appelle forçage orbital et a toujours existé depuis que notre système planétaire existe.  Ce forçage présente une cyclicité parfaitement calculable en fonction des interactions par attraction entre les différentes planètes du système solaire et le soleil. Elle varie relativement peu au cours du temps. Par contre, l’orbite terrestre est une ellipse dont l’élongation varie au cours du temps, nous éloignant ou nous rapprochant du soleil, c’est ce que nous appelons l’excentricité.  De plus, l’axe de rotation de la Terre n’est pas vertical sur le plan orbital ou d’écliptique et oscille également, permettant un déficit en énergie reçue au niveau des pôles, géré par son obliquité. Enfin la Terre ne parcourt pas son orbite en exactement un an : les saisons pourront être en avance ou en retard sur l’orbite par rapport au minimum ou au maximum d’insolation : ceci s’appelle la précession des équinoxes.

L’englaciation Cénozoïque débute en position polaire sous contrôle de la tectonique des plaques, de l’évolution des océans, de la circulation océanique et des reliefs orogéniques disponibles pour stocker de la glace. Elle apparaît donc en premier sur l’Antarctique puis au Néogène, sur l’Arctique Canadien en période de faible obliquité. Ensuite, elle descendra en latitude au fur et à mesure de l’évolution de l’ère glaciaire.

Fig. 24 : LGM ou Last Glacial Maximum, c’est-à-dire la glaciation du ‘Dernier Glaciaire’ dans l’hémisphère nord avec des plateformes de glaces débordant sur l’océan Arctique recouvert de banquise (image CLIMAP). La glace qui recouvrait une grande partie de l’Amérique du Nord, du nord de l’Europe et une partie de l’Asie était épaisse de 3 à 4 km et le niveau marin plus bas de 120 m par rapport à l’Actuel, ce qui permit des passages terrestres, inexistants aujourd’hui suite à la remontée du niveau marin lors de la déglaciation. Cette situation est aussi à l’origine d’une aridification intense (non discutée dans cet article). Les glaces se mirent en place vers 33 ka et leur extension maximale est comprise entre 26,5 ka et 20-19 ka (Clark et al. 2009).


THE SUN UNLEASHES STRONGEST SOLAR FLARE IN 3 YEARS — GSM + MAGNETIC EXCURSION = BYE-BYE EMPIRE MODEL

by Cap Allon, May 30, 2020 in Electroverse


Earth’s magnetosphere continues to weaken (due to an intensifying GSM AND a magnetic excursion/reversal), but at the same time the Sun’s next cycle (25) is showing signs of stirring– this combo spells bad news for all those reliant on the electrical grid, and could deliver a civilization-resetting one-two knockout.

Yesterday (May 29), in the pits of the deepest Solar Minimum of the past 100+ years, the sun unleashed a flurry of spectacular solar flares:

Germany’s DWD National Weather Service Denies Station Siting Problem: “Dubious” All-Time Record Temperature Allowed To Stand

by P. Gosselin, May 26, 2020 in NoTricksZone


Leading German daily Bild here reports on the controversy, which still continues to swirl, over Germany’s all-time record high temperature recorded last year in North Germany near the Dutch border.

Independent meteorologists say the readings needs to be thrown out

Last year on July 25th, the Lingen thermometer reached a whopping 42.6°C, far eclipsing the old German all-time record of 40.3°C. But that recording quickly came under fire by independent weather experts who say the station data were  corrupted by siting issues. The Lingen station is located in a depression in the earth, near a parking lot, and shielded by trees from the wind, thus creating the ideal conditions for trapping heat.

Comparison to nearby stations shows huge anomaly

Last year NTZ reported on the controversial record here noting that surrounding stations did not even come close to record reading in Lingen. What follows is a comparison of the Lingen’s readings to those of 6 nearby stations over the five day period, July 23 – July 27:

New Study: Arctic Waters Were 4°C Warmer Than Today And Nearly Sea-Ice Free Year-Round ~4100 Years Ago

by Brice et al., May 28, 2020 in NoTricksZone


Today, the region north of Svalbard is encrusted with sea ice for all but a few weeks per year and summer sea surface temperatures (SSTs) hover near 0°C.  Scientists (Brice et al., 2020) have determined this same region had sea ice-free conditions last about 10 months per year while SSTs reached 4°C just ~4100 years ago.

In early September, 2019, Arctic explorers once again needed to be rescued from the “disappearing” sea ice that had captured their ship in central Svalbard. This region is presently free of sea ice for only a few weeks per year (late August).

Image Source: electroverse.net

SOUTH AFRICA: 14 ALL-TIME MONTHLY LOW TEMPERATURE RECORDS FELL YESTERDAY (MAY 28), WITH “WIDESPREAD SNOW” ACCOMPANYING THE FREEZE

by Cap Allon, May 29, 2020 in Electroverse


According to preliminary data from the South African Weather Service, a total of 14 new all-time monthly LOW temperature records were busted yesterday (May 28), versus the 0 for record high.

These record low May temperatures were set ACROSS the southernmost tip of Africa, although the east appears to have been disproportionately hit.

The “II AGR” weather station in Buffelspoort –located NW of Johannesburg– set a new “Lowest Minimum” temperature on Thursday, May 28 of -2C (35.6F) — a reading which comfortably usurped the station’s previous all-time lowest May minimum of 0.9C (33.6F) set back on May 10, 1970.

Secunda –located amidst the coalfields of the Mpumalanga province– was another region to suffer its lowest May temperature on record. The town logged a bone-chilling -3.9C (25F) on Thursday morning, which surpassed the old record of -3.3C (26F) from May 29, 1994.

Exceptional snowfall has been accompanying the low temps.

“We’ve got ground-level snow in quite a few places,” said Richard le Sueur of SnowReportSA while on popular SA radio show CapeTalk on May 27.

“The front swept in from the west and has gone right across the country … We’ve had snow on the Western Cape mountains, the Southwestern Cape and through the Southern Cape and into the Eastern Cape … also, in Lesotho and the Northern Cape … So, pretty much widespread snow,” said le Sueur.

“We’re going to see a chilly winter,” he concluded.

The Yin and Yang of Holocene Polar Regions Andy May / 1 day ago May 27, 2020

by R. Hannon/A. May, May 27, 2020 in WUWT


Introduction

The Arctic and Antarctic regions are different and yet similar in many ways. The Arctic has ocean surrounded by land and the Antarctic is a continent surrounded by water. Both are cold, glaciated and located at Earth’s poles some 11,000 miles apart. While sea ice has been retreating in the Arctic, it has been relatively stable in the Antarctic. This post examines surface temperature trends, solar insolation, and CO2 at the polar Arctic and Antarctic regions during the Holocene interglacial period.


Continuer la lecture de The Yin and Yang of Holocene Polar Regions Andy May / 1 day ago May 27, 2020

Solar wind driven particle precipitation affects winter climate in polar regions

by University of Oulu, March 18, 2020


Changes in space climate driven by long-term changes in solar activity have a significant impact on Earth’s atmosphere and climate. Understanding the complex system requires cooperation between space physics and climate science.


On the right, a picture of the Sun taken at the wavelength of visible light, i.e. like a regular camera at very short shutter speed, visible sunspot groups. The time series in the image illustrate a few long series of data used in space air research.
On green: approximately 40 years of direct satellite measurements, a combination of energetic electrons coming into the Earth’s atmosphere.
In red: from geomagnetic measurements reconstructed estimate of the speed of the solar wind in the last hundred years.
With purple: the longest unified time series for geomagnetic activity (the so-called AA index), starting from 1868 and continuing to the present day.
In blue: 400 year series of sunspots. This set of data is the longest indicator of solar activity based on direct measurements.


Michael Moore film Planet of the Humans removed from YouTube

by P. Homewood, May 27, 2020 in NotaLotofPeopleKnowThat


YouTube has taken down the controversial Michael Moore-produced documentary, Planet of the Humans in response to a copyright infringement claim by a British environmental photographer.

The movie, which has been condemned as inaccurate and misleading by climate scientists and activists, allegedly includes a clip used without the permission of the owner Toby Smith, who does not approve of the context in which his material is being used.

In response, the filmmakers denied violating fair usage rules and accused their critics of politically motivated censorship.

Smith filed the complaint to YouTube on 23 May after discovering Planet of the Humans used several seconds of footage from his Rare Earthenware project detailing the journey of rare earth minerals from Inner Mongolia.

Smith, who has previously worked on energy and environmental issues, said he did not want his work associated with something he disagreed with. “I went directly to YouTube rather than approaching the filmmakers because I wasn’t interested in negotiation. I don’t support the documentary, I don’t agree with its message and I don’t like the misleading use of facts in its narrative.”

Planet of the Humans director Jeff Gibbs said he was working with YouTube to resolve the issue and have the film back up as soon as possible.

https://www.msn.com/en-gb/entertainment/movies/michael-moore-film-planet-of-the-humans-removed-from-youtube/ar-BB14zOSN

Tiny plankton drive processes in the ocean that capture twice as much carbon as scientists though

by K. Buesseler, May 2020 in TheConversion


The big idea

The ocean plays a major role in the global carbon cycle. The driving force comes from tiny plankton that produce organic carbon through photosynthesis, like plants on land.

When plankton die or are consumed, a set of processes known as the biological carbon pump carries sinking particles of carbon from the surface to the deep ocean in a process known as marine snowfall. Naturalist and writer Rachel Carson called it the “most stupendous snowfall on Earth.”

Some of this carbon is consumed by sea life, and a portion is chemically broken down. Much of it is carried to deep waters, where it can remain for hundreds to thousands of years. If the deep oceans didn’t store so much carbon, the Earth would be even warmer than it is today.

What still isn’t known

Our study reveals that scientists need to use using a more systematic approach to defining the ocean’s vertical boundaries for organic carbon production and loss. This finding is timely, because the international oceanographic community is calling for more and better studies of the biological carbon pump and the ocean twilight zone.

The twilight zone could be profoundly affected if nations seek to develop new midwater fisheries, mine the seafloor for minerals or use it as a dumping ground for waste. Scientists are forming a collaborative effort called the Joint Exploration of the Twilight Zone Ocean Network, or JETZON, to set research priorities, promote new technologies and better coordinate twilight zone studies.

To compare these studies, researchers need a common set of metrics. For the biological carbon pump, we need to better understand how big this flow of carbon is, and how efficiently it is transported into deeper water for long-term storage. These processes will affect how Earth responds to rising greenhouse gas emissions and the warming they cause.

The Global CO2 lockdown problem

by Sherrington G., May 22, 2020 in WUWT


The global problem.

In response to the threat of a global viral epidemic, countries announced lockdowns at various times near 25th March 2020. https://en.wikipedia.org/wiki/COVID-19_pandemic_lockdowns

This caused a reduction of industrial activity and hence a lower rate of emission of anthropogenic carbon dioxide to the atmosphere. An example of reduction from aircraft is given at https://en.wikipedia.org/wiki/Impact_of_the_COVID-19_pandemic_on_aviation

Numerous sources asked if the reduction in CO2 emission could be detected in analysis of air for CO2 content, which had been done for decades. Early questions and speculative answers came from many sources including –

https://www.esrl.noaa.gov/gmd/ccgg/covid2.html

https://www.aljazeera.com/news/2020/03/coronavirus-lockdown-leads-improved-air-quality-200322094404592.html

By late May 2020, the emerging consensus was that the reduction would be too small to show at the main measuring stations such as Mauna Loa, Hawaii.

What You Should Know About Ice Ages & Climate Change

by D.W. Euring, May 20, 2020 in PrincipiaScientificInternational


It became apparent from investigation of the Variability of the Gravitational Constant that Jupiter’s orbit is affecting the Sun’s surface temperature and driving the Sunspot Cycle which appear to be triggered at its Aphelion and suppressed at Perihelion.

Saturn has even greater eccentricity than Jupiter and it is noted that it was at Perihelion at the end of 1972 which seems to account for the Low Solar Maximum at that time and a particular dip after the main peak. So, whilst cycle periods are not influenced by Saturn, it does impact on their magnitude, and it seems likely that it will have augmented in 1957-58 as well as 1990.

Earth’s Mean Temperature Falling, Planetary Alignment Suspected As Driver Of The 11-Year Solar Cycle

by F. Vahrenholt, May 9, 2020 in NoTricksZone


The global mean temperature in April 2020 was again significantly lower than in February and March, at 0.38°C above the average from 1981 to 2010. The average temperature increase on the globe from 1981 to February 2020 was 0.14°C per decade. The further development promises to be interesting, especially since a number of research institutes expect a higher probability of a cooling La Nina in the Pacific towards the end of the year. March’s solar activity was very low with a sunspot number of 1.5.  Activity in April rose slightly to 5.4. The first sunspots of the new cycle are showing.

What causes the sun to have an 11-year cycle?

Since the Dessau pharmacist Heinrich Samuel Schwabe discovered in 1843 that the sunspots of the sun increase and decrease in an 11-year cycle, science has been puzzling over the reason why this cycle lasts 11 years and why the solar magnetic field also changes its polarity in this rhythm: the north pole becomes the south pole and vice versa.

In July last year, scientists at the Helmholtz Centre in Dresden Rossendorf made a little-noticed but exciting discovery. Every 11.07 years, the planets Venus, Earth and Jupiter are aligned quite precisely. At this point in time, their gravitational force acts jointly in one direction on the Sun.

Image: NASA Earth Observatory. Public Domain

Why the Current Economic Slowdown Won’t Show Up in the Atmospheric CO2 Record

by Rotter, from Spencer, May 15, 2020 in WUWT


May 15th, 2020 by Roy W. Spencer, Ph. D.

[UPDATE: MISSING IMAGES INSERTED]

Summary: Atmospheric levels of carbon dioxide (CO2) continue to increase with no sign of the global economic slowdown in response to the spread of COVID-19. This is because the estimated reductions in CO2 emissions (around -11% globally during 2020) is too small a reduction to be noticed against a background of large natural variability. The reduction in economic activity would have to be 4 times larger than 11% to halt the rise in atmospheric CO2.

Changes in the atmospheric reservoir of CO2 occur when there is an imbalance between surface sources and sinks of CO2. While the global land and ocean areas emit approximately 30 times as much CO2 into the atmosphere as humans produce from burning of fossil fuels, they also absorb about an equal amount of CO2. This is the global carbon cycle, driven mostly by biological activity.

Fig. 2. Monthly CO2 data since 2015 from Mauna Loa, HI after the average seasonal cycle is statistically removed.

ADDENDUM: How much of a decrease in CO2 emissions would be required to stop the atmospheric rise in CO2?


Continuer la lecture de Why the Current Economic Slowdown Won’t Show Up in the Atmospheric CO2 Record