In this post, we’re going to present monthly mean TMIN and TMAX Near-Land Surface Air Temperatures (not in anomaly form) for a group of ten (10) Countries in an effort to add a little perspective to global warming. The list of countries, which follows, will, hopefully, reflect the home countries of recent visitors to WattsUpWithThat. The list is based on the number of visitors per country to my blog ClimateObservations during my peak year of 2014.
And, as always with my posts, as part of the text, there are hyperlinks to the data that were used to prepare the graphs. Just click on the links if you’re looking for the data.
This series of posts are logged under the Category of “Global Warming in Perspective” at WattsUpWithThat, with the link to that category here. The category link at my blog ClimateObservations is here.
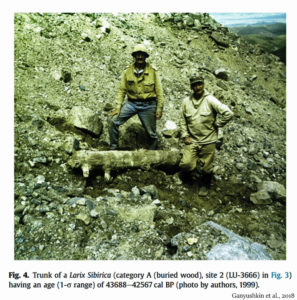
Between 60 and 40 thousand years ago, during the middle of the last glacial, atmospheric CO2 levels hovered around 200 ppm – half of today’s concentration.
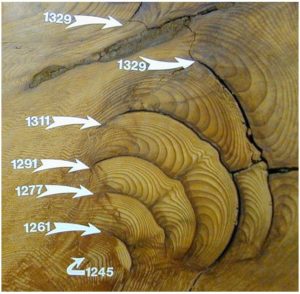
Tree remains dated to this period have been discovered 600-700 meters atop the modern treeline in the Russian Altai mountains. This suggests surface air temperatures were between 2°C and 3°C warmer than today during this glacial period.
Tree trunks dating to the Early Holocene (between 10.6 and 6.2 thousand years ago) have been found about 350 meters higher than the modern treeline edge. This suggests summer temperatures were between 2°C and 2.5°C warmer than today during the Early Holocene, when CO2 concentrations ranged between about 250 and 270 ppm.
None of this paleoclimate treeline or temperature evidence correlates with a CO2-driven climate.
Liberal MP and climate sceptic Craig Kelly made headlines in November when he was caught on tape mocking “lefties” for exaggerating the effects of climate change.
Speaking at a local party event, audio of which was leaked to the Guardian, Mr Kelly set out to debunk several justifications for climate change action, including the argument that Tuvalu, the Pacific island nation, was slipping beneath the sea.
“The science tells us that Tuvalu, which I often hear about, is actually growing not sinking,” he told colleagues.
Is Tuvalu growing? RMIT ABC Fact Check investigates.
The verdict
Mr Kelly’s claim checks out.
In the four decades to 2014, Tuvalu’s total land area grew by 73 hectares, or 2.9 per cent.
By Dr. Dietrich E. Koelle
(German text translated/edited by P Gosselin)
Once again – for the 24th time – a mass climate conference with over 20,000 participants (400 of them from Guinea alone) has come to an end and the politicians and climate officials involved praised its success: “Once again the earth was saved”. It’s all actually quite simple: you only need to reduce CO2 emissions and global temperature drops.
“Strongly decelerated warming”
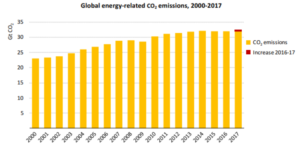
Reductions have been decided at every conference for 24 years – and emissions have always risen the following year, and done so for 24 years now.
Source: IEA-Report für 2017
But nobody is interested in the fact that despite this, there has hardly been a global rise in temperature in 16 years (since 2002) and record emissions of 500 billion tons of CO2 in this period. Instead there has been a strongly decelerated warming, sometimes even called a “hiatus”. But acknowledging this would possibly jeopardize next year’s planned climate conference.
The truth about climate change is nuanced: it is real, and in the long term it will be a problem, but its impact is less than we might believe. And yet we are too eager to believe the problem is far worse than science shows, and – conversely – that our solutions are far easier than reality dictates.
BRUSSELS – The latest global climate summit in Poland has generated familiar predictions of doom and disaster from environmental activists. Climate change seems to freeze our capacity for critical thinking: we are too eager to believe the problem is far worse than science shows, and – conversely – that our solutions are far easier than reality dictates.
For those still blindly banging the ‘97%’ drum, here is a in-no-way-comprehensive list of the SCIENTISTS who publicly disagree with the current consensus on climate change –namely the IPCC’s catastrophic conclusions.
There are currently 85 names on the list. Though it is embryonic and dynamic.
Suggestions for omissions and/or additions can be added to the comment section below and, if validated, will serve to update the list.
SCIENTISTS ARGUING THAT GLOBAL WARMING IS PRIMARILY CAUSED BY NATURAL PROCESSES
— scientists that have called the observed warming attributable to natural causes, i.e. the high solar activity witnessed over the last few decades.
The ‘urban heat island’ arises because air temperatures measured in urban cities can be different to those of the rural city surroundings. Thermometers were and still are more often found in cities than surroundings. City temperatures have a synthetic, man-made component that needs to be subtracted to match the surrounding rural temperatures, which are the items of interest for climate studies.
Failure to subtract the UHI effect will lead to false results for temperature trends such as those used to claim global warming. The question arises whether rural and urban temperatures have adequate accuracy to provide reasonable results after the subtraction. This essay argues that historic Australian rural temperature records are unfit for this purpose; that global temperature records are likely to be similarly inadequate; and that as a consequence, all past estimates of UHI derived from land surface temperatures by thermometry are invalid or questionable.
In short, all past estimates of UHI magnitude before the satellite era are incorrect for reasons given. The actual rates of global temperature changes over the past century are likely to be wrong by a significant amount, of similar magnitude to the global warming claimed at about 1°C per century.
More recent estimates are being made with temperatures from instruments on satellites, which help the future path to better understanding.
La COP24 est enfin terminée et, comme à chaque fois, sans aucun résultat concret pour la diminution des émissions de CO2 malgré les cris d’alarmes des ONG environnementales, du Secrétaire général des Nations Unies et des foules de citoyens. Et pourtant dans un an, on va de nouveau nous bassiner les oreilles avec la 25ème COP tandis qu’on observera encore une fois l’augmentation des émissions. Comme à chaque fois, par l’entremise des media, on nous rappelle que notre planète va devenir un enfer comme Vénus, que le niveau de la mer va nous engloutir et que la biodiversité va disparaître.
Rappelons tout d’abord ce fait : aujourd’hui l’Union Européenne ne représente que 11 % des émissions mondiales de CO2, la Chine 28 %, les États-Unis 15 %, l’Inde 7 %, la France 1 % et la Belgique 0,4 %.
The significance of this new GWPF report by Prof Ray Bates of the Meteorology and Climate Centre at University College Dublin cannot really be overstated:
London, 20 December: One of Europe’s most eminent climate scientists has documented the main scientific reasons why the recent UN climate summit failed to welcome the IPCC’s report on global warming of 1.5°C.
In a paper published today by the Global Warming Policy Foundation Professor Ray Bates of University College Dublin explains the main reasons for the significant controversy about the latest IPCC report within the international community.
The IPCC’s Special Report on a Global Warming of 1.5°C (SR1.5) was released by the Intergovernmental Panel on Climate Change (IPCC) in advance of the recent COP24 meeting in Katowice, Poland, but was not adopted by the meeting due to objections by a number of governments.
by P. Homewood, December 18, 2018 in NotaLotofPeopleKnowThat
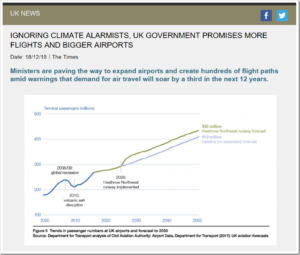
The Department for Transport publishes a long-awaited aviation strategy today that pledges to deliver “greater capacity at UK airports”.
It raises the prospect of airports other than Heathrow growing and accepting more flights if tough environmental and noise restrictions are met.
The strategy also outlines plans for the biggest overhaul of Britain’s airspace in more than 50 years to create new flight paths into the biggest airports. GPS-style technology will allow aircraft to fly along more accurate paths below 30,000ft instead of being led by ground beacons, which space planes out over a wide arc several miles across.
It will mean a considerable increase to the 600 or so dedicated flight paths that are in operation today
Jochem Marotzke, director of Germany’s Max Planck Institute for Meteorology (MPIM), wondered whether CO2 savings could really have a direct influence on the temperature in the near future. In a new paper (Marotzke 2018), the Hamburg-based climate researcher simulates the temperature profile of the 2030s predicted by climate models and uses once again a conventional emission profile (Scenario RCP 4.5), and once a politically reduced emission scenario.
Conclusion: Most likely, there would probably be no difference as natural climate variability prevails over these time scales. The paper was published in WIRE’s Climate Change and can be downloaded free of charge as a pdf:
Over the last 40 years global-mean surface air temperature – ‘global temperature’ for short – has gained an extraordinary role in the science, politics and public discourse of climate change. What was once a number crudely calculated through averaging together a few dozen reasonably well-spaced meteorological time series, has become reified as an objective entitythat simultaneously measures Earth System behaviour, reveals the future, regulates geopolitical negotiations and disciplines the human imagination. Apart perhaps from GDP rarely can so constructed an abstract entity have gained such power over the human world.
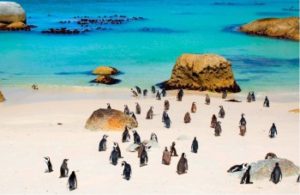
You may recall the BBC’s news story a couple of months ago, claiming that African penguin populations were declining because of climate change.
The report from South Africa, which then followed, made no mention of climate change at all but instead laid the blame fairly and squarely on overfishing.
Wavelet analyses of modern global temperature anomalies provides an excellent visualization tool of temperature signal characteristics and patterns over the past 150 years. Scafetta recognized key temperature oscillations of about 9, 20 and 60-years using power spectra of global surface temperature anomalies. There has been much discussion about the 60-year quasi-oscillation both in WUWT and publications.
Detrending the temperature time series and removing the 60-year underlying trend enables insights into the interplay of interannual and decadal scales. Wavelet analyses reveals these periodic signals have distinguished patterns and characteristics that repeat over time suggesting natural external and internal influences. Interannual wavelet patterns that consist of 9-year and 3 to 5-year quasi-oscillations are repeated and dominate over 70% of the instrumental record. The 3 to 5-year discontinuous breakouts are coincident to El Niño and La Niña events of the El Niño-Southern Oscillation (ENSO). A period of quiescence from 1925 to 1960 is devoid of most wavelet signals suggesting different or transitional climate processes.
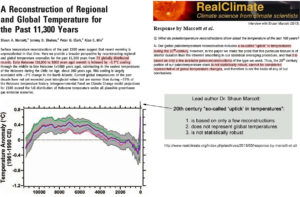
Almost immediately after it was introduced to the public, the lead author of Marcott et al. (2013) squelched the narrative that said the hockey-stick-shaped reconstruction he and his colleagues produced is a robust representation of modern global-scale temperature changes.
In an interview with Marcott published by RealClimate.org, it was acknowledged that the “uptick” does not represent a global-scale reconstruction, as it is based on only a few proxy records and lacks statistical significance.
…
Despite this admitted lack of supporting evidence for the 20th century’s “uptick”, the Marcott et al. (2013) “hockey stick”-shaped graph has nonetheless been unskeptically cited by other authors nearly 700 times.
On December 14, 2008, former presidential candidate Al Gore predicted the North Polar Ice Cap would be completely ice free in five years. As reported on WUWT, Gore made the prediction to a German TV audience at the COP15 Climate Conference:
In this post, we’re going to present graphs that show the annual lowest TMIN and highest TMAX Near-Land Surface Air Temperatures (not in anomaly form) for ten (10) Countries in an effort to add some perspective to global warming. The list of countries, which follows, includes the countries with the highest populations.
And, as always with my posts, as part of the text, there are hyperlinks to the data that were used to prepare the graphs. Just click on the links if you’re looking for the data.
INITIAL NOTES
First of all, TMIN is described by Berkeley Earth as the “Mean of Daily Low Temperatures”, while TMAX is described as the “Mean of Daily High Temperatures”. Berkeley Earth provides monthly TMIN and TMAX data until partway through 2013. The start month for these individual-country datasets at Berkeley Earth depends on data availability from the individual country. Sometimes they start in the early 1800s, maybe even the mid-to-late 1700s for countries to be included in future posts (like the United Kingdom), and other times they start in the mid-to-late 1800s, so I’ve chosen 1900 as the start year for this post. The year 1900 is the end year of the IPCC’s new definition of “pre-industrial” times, so starting the graphs in 1900 is also appropriate in that respect.
La COP est une conférence internationale qui depuis 24 ans tient chaque année la réunion de la dernière chance pour sauver la planète. Vous croyez peut-être que la planète avait été sauvée lors de la COP21 à Paris. Erreur. Tout reste à faire. C’est ce qui justifie la COP24, qui se tient cette année en Pologne. Le secrétariat de la COP24 publie en ligne la liste de ses participants, sur près de 1100 pages.
Plus de 21 000 participants. Sans compter les 1500 journalistes accrédités, qui sont rémunérés par leurs médias, pas par les contribuables. Ces 21 000 participants sont pour 14000 des délégués des gouvernements, et pour 6000 des représentants d’ONGs prétendument intéressées et compétentes. (Le solde est composé de membres d’organisations du système des Nations-Unies).
Le coût de la fête est élevé. Les seuls frais de déplacement et de séjour pour cette COP de 15 jours s’élèvent sans doute (sur la base de 10000 € par participant) à plus de 200 millions d’euros. On pourrait y ajouter le coût du temps passé par les participants. S’ils y passent en moyenne une semaine, cela fait 21000 semaines, soit environ 500 personnes-années. A 50000 euros/an, 25 millions d’euros, qui s’ajoutent aux frais de déplacement. C’est de quoi doubler le niveau de vie annuel de 2 ou 3 millions d’enfants au Malawi.
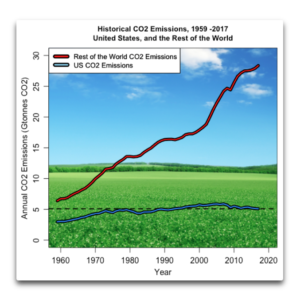
I keep reading about all kinds of crazy schemes to reduce US CO2 emissions. Now, I don’t think that CO2 is the secret knob that controls the climate. I think that the earth has a host of emergent thermoregulatory mechanisms that act to keep the temperature within narrow limits (e.g. 0.6°C temperature change over the entire 20th Century). I don’t believe the claims that the modern changes in CO2 will affect the temperature.
But solely for the purposes of this post, let’s assume that the alarmists are correct. And for purposes of discussion only, let’s assume that the Earth’s temperature is free to go up and down any amount. Let’s assume that CO2 is, in fact, the secret control knob that controls the temperature of the earth. And let’s further assume that the pundits are right that the “climate sensitivity” is three degrees of warming for every doubling of CO2.
And finally, let’s assume that in 2018 the US magically stopped emitting any CO2 at all.
With all of those assumptions as prologue, here’s the question of interest.
Other things being equal, if the US stopped emitting CO2 entirely in 2018, and stayed at zero CO2 emissions indefinitely, how much cooler would that make the planet in the year 2050?
Five degrees cooler? Two degrees? One degree?
…
Figure 1. Historical CO2 emissions. Data from CDIAC and BP Statistical Review of World Energy
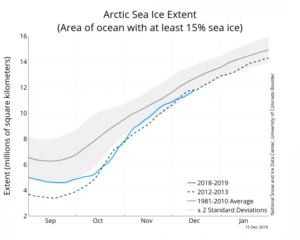
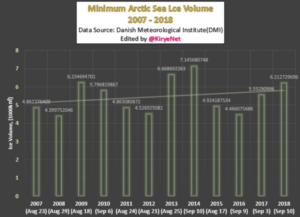
The media, alarmist scientists and many leading policymakers often tell the public “the Arctic is rapidly melting”. And if a poll were done today, a vast majority of the people in Japan and elsewhere would say this is true. Unfortunately they have become the victims of “fake news”.
Luckily we have some hard data from the Arctic. And if one looks at them, it is true that sea ice has seen a declining trend – if we go back 40 years.
Yet, if we look at the past 12 years, we see that the trend for minimum has stopped, and one could argue even reversed:

