by Tony Heller, August 0, 2018 in ClimateChangeDispatch
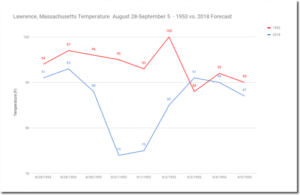
The US had an unprecedented late summer heat wave from August 24 to September 6, 1953. The animation below shows the progression of the heat wave.
…

by Tony Heller, August 0, 2018 in ClimateChangeDispatch
The US had an unprecedented late summer heat wave from August 24 to September 6, 1953. The animation below shows the progression of the heat wave.
…
by Javier, August 29, 2018 in WUWT
A no-assumptions look at the global warming evidence helps clarify the possibilities.
The planet’s surface has been warming since the depths of the Little Ice Age, and particularly since ~ 1850 AD. The surface temperature record, however incomplete or uncertain, reflects this warming. Hypotheses about why the warming is taking place can be grouped into three general categories:
A combination of these categories cannot be ruled out.
Whatever causes the temperature change must necessarily affect its rate of change, the velocity at which temperature changes over time, measured in °C/decade. A velocity that varies continuously and can be positive (warming) or negative (cooling).
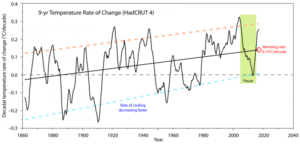
Figure 1. 9-year global surface temperature rate of change (4-year averaged) in °C/decade. The Pause is indicated by the khaki box. Source: Met Office UK, HadCRUT 4.
…
by Andy May, August 29, 2018 in WUWT
In June of this year, Howard Dewhirst, a fellow of The Geological Society (London), wrote a letter to the President of the Society voicing the concern of 33 current and former fellows of the society, as well as other concerned geoscientists, that the Society’s position on climate change is outdated and one-sided. As of this writing, receipt of the letter has been acknowledged, but no reply has been received. Given the long period of time, Howard has sent a second letter to the Society, it is reproduced below.
Dear President
We understand that the council is reviewing the The Geological Society’s 2010 and 2013 position papers on climate change which was the subject of the letter we wrote to the society in early June. We also understand that despite the clear interest amongst Fellows – and other scientists, that the society will not be publishing further letters until the new position paper has been agreed. If true, we (the contributors to the first letter) think this is unfortunate, as now would be the very time to solicit informed opinion from Fellows and others as there clearly is not a consensus. …
by H. Harde, May 2017 in GlobalPanetaryChange
Highlights
- • We present a carbon cycle with an uptake proportional to the CO2 concentration.
- • Temperature dependent natural emission and absorption rates are considered.
- • The average residence time of CO2 in the atmosphere is found to be 4 years.
- • Paleoclimatic CO2 variations and the actual CO2 growth rate are well reproduced.
- • Human emissions only contribute 15 % to the CO2 increase over the Industrial Era.
by K. Richard, August 27, 2018 in ClimateChangeDispatch
A 2017 peer-reviewed paper authored by physicist Dr. Hermann Harde drew considerable response upon its publication in the journal Global and Planetary Change.
Harde’s conclusion that less than 15% of the increase in CO2 concentration since the 19th century could be attributed to anthropogenic emissions was deemed unacceptable by gatekeepers of the anthropogenic global warming (AGW) viewpoint.
A critical reply to the paper was consequently published, but it included assumptive errors and misrepresentations of the original points …
by Anthony Watts, August 27, 2018 in WUWT
Via Reuters:
Merkel says EU should meet existing emissions aims, not set new ones
A proliferation of extreme weather events around the world provides ample evidence that climate change is a reality, German Chancellor Angela Merkel said on Sunday, but she rejected calls for more ambitious climate protection goals.
But Merkel said such calls, most recently from the European Commission’s climate chief Miguel Arias Canete, for swifter cuts to harmful carbon dioxide emissions would be counterproductive, adding that setting new goals made little sense when European countries were already struggling to meet their cuts targets.
…
by Kip Hansen, August 27, 2018 in WUWT
Note: Please read Part 1 before reading this — this is a continuation of that essay (a rather long continuation….).
…
Readers will have heard the line “multiple lines of evidence” attached to the attribution of anthropogenic causes. However, that phrase is used only once in AR5 SPM as “Multiple lines of evidence indicate a strong, consistent, almost linear relationship between cumulative CO2 emissions and projected global temperature change to the year 2100….” I’m sure I don’t need to point out that there is never ever evidence about the future…..They do not claim in the Summary for Policy Makers that there are multiple lines of evidence for the attribution statement that apply to the past-to-present.
by H.J. Lüdecke and C.O. Weiss, April 27, 2017 in TheOpenAtm.Sci.J.
Abstract
The Sun as climate driver is repeatedly discussed in the literature but proofs are often weak. In order to elucidate the solar influence, we have used a large number of temperature proxies worldwide to construct a global temperature mean G7 over the last 2000 years. The Fourier spectrum of G7 shows the strongest components as ~1000-, ~460-, and ~190 – year periods whereas other cycles of the individual proxies are considerably weaker. The G7 temperature extrema coincide with the Roman, medieval, and present optima as well as the well-known minimum of AD 1450 during the Little Ice Age. We have constructed by reverse Fourier transform a representation of G7 using only these three sine functions, which shows a remarkable Pearson correlation of 0.84 with the 31-year running average of G7. The three cycles are also found dominant in the production rates of the solar-induced cosmogenic nuclides 14C and 10Be, most strongly in the ~190 – year period being known as the De Vries/Suess cycle. By wavelet analysis, a new proof has been provided that at least the ~190-year climate cycle has a solar origin.
…
by Ralph Ellis, August 2018 in FriendsofScience
Why do ice ages occur? Surprisingly, even after many decades of paleoclimatic research we simply do not know for sure. Most scientists will agree that ice age cycles have something to do with precession: the slow wobble of the axis of the Earth. The ancient Egyptians and Greeks knew of precession and called it the Great Year, because it gives warm and cool seasons over its approximate 23,000-year cycle. But there is a problem with invoking the Great Year as the regulator of ice ages, because we should really get an interglacial warming every 23,000 years or so. And we don’t – they only happen every fourth or fifth Great Year.
But why should the global climate give a selective response to orbital warming and cooling? (Called ‘forcing’ in the climate trade.) This is one of the great unknowns of modern science.
…
by Kip Hansen, August 25, 2018 in WUWT
I have often been asked “Why do you deny climate change?” I am always stumped by the question. It is rather like being asked “Why do you torture innocent animals?” The questioner is not merely asking for information, they are always making an accusation — an accusation that they consider very serious and a threat to themselves and others.
The reason it stumps me is that, as you have guessed already, I do not deny climate change (and I do not torture innocent animals — nor even guilty ones). And there is nothing about me or my behavior, present or past, that I am aware of, that would lead any reasonable person to think such a thing of me.
I am thoroughly guilty though of being very skeptical of what is generally referred to as the Climate Consensus — usually said to be represented by the latest reports and policy recommendations put out by the Intergovernmental Panel on Climate Change (IPCC) and its supporters; political, ideological and scientific. I suppose it is this that leads to the false accusation of “denying climate change”.
And there is the crux of the matter — it is something in the mind of the accuser, not any action of the accused, which leads to the false accusation.
…
by Edinburgh University, August 24, 2018 in ScienceDaily
The findings highlight the extent to which humans are impacting one of the world’s major ecosystems — the Miombo woodlands, which cover 2.5 million square kilometres, across countries including Angola, Zambia, Tanzania and Mozambique.
At the same time, however, the growing number of trees in remote parts of these woodlands is helping to offset the emissions, researchers say.
The study is the first to provide an in-depth analysis of areas gaining carbon while also losing it through degradation — a process where some, but not all, trees are removed, usually as a result of logging and fire.
…
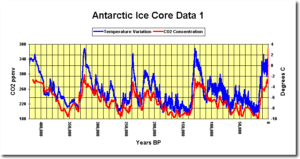
by Tony Heller, from Mc. Hogg, August 24,2018 in TheDeplorableClimateScienceBlog
Climate scientists acknowledge that CO2 follows rather than leads temperature, but they insist that feedback loops drive the transitions from glacial to interglacial conditions.
….
…
by P. Gosselin, August 24, 2018 in NoTricksZone
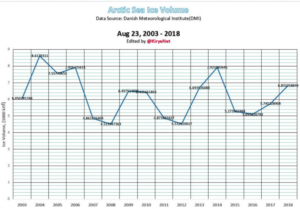
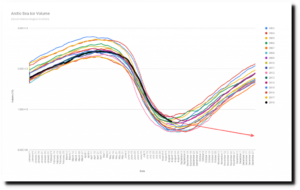
As the Arctic summer ice melt approaches its peak, we can say with high certainty that this year’s ice melt will extend the trend of a rebounding Arctic ice mass by another year.
Arctic summer sea ice now growing 12 years
Our Japanese skeptic blogger and good friend Kirye reports using the data from the Danish Meteorological Institute (DMI) that peak summer Arctic sea ice volume upward growth trend has been extended yet another year – now 12 years.
Chart by Kirye. Data source: Danish Meteorology Institute (DMI).
…
by Anthony Watts, August 23, 2018 in WUWT
The world is on fire. Or so it appears in this image from NASA’s Worldview. The red points overlaid on the image designate those areas that by using thermal bands detect actively burning fires. Africa seems to have the most concentrated fires. This could be due to the fact that these are most likely agricultural fires. The location, widespread nature, and number of fires suggest that these fires were deliberately set to manage land. Farmers often use fire to return nutrients to the soil and to clear the ground of unwanted plants. While fire helps enhance crops and grasses for pasture, the fires also produce smoke that degrades air quality.
…
by Chris Money, September 2, 2015 in TheWashingtonPost
In a blockbuster study released Wednesday in Nature, a team of 38 scientists finds that the planet is home to 3.04 trillion trees, blowing away the previously estimate of 400 billion. That means, the researchers say, that there are 422 trees for every person on Earth.
However, in no way do the researchers consider this good news. The study also finds that there are 46 percent fewer trees on Earth than there were before humans started the lengthy, but recently accelerating, process of deforestation.
“We can now say that there’s less trees than at any point in human civilization,” says Thomas Crowther, a postdoctoral researcher at the Yale School of Forestry and Environmental Studies who is the lead author on the research. “Since the spread of human influence, we’ve reduced the number almost by half, which is an astronomical thing.”
…
by P. Homewood, July 1, 2018 in NotaLotofPeopleKnowThat
As we all know, Greenland is warming up rapidly, causing the ice sheet to melt faster and faster.
Well, according to the BBC and New York Times, at least.
Only one slight problem – the temperature record shows quite a different story.
…
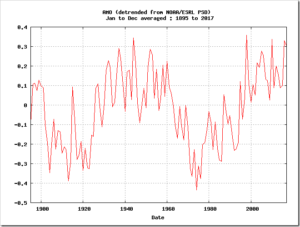
There is certainly no evidence of rising temperature trends, and every likelihood that temperatures will plummet again when the AMO turns cold again.
…
by P. Homewood, August 22, 2018 in NotaLotofPeopleKnowThat
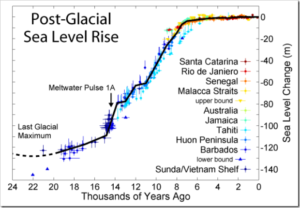
There seems to be a general acceptance about overall sea level trends during the Holocene.
There was naturally a very rapid rise in sea levels at the end of the ice age, until 6000 years ago, since when the rise has been much more gradual. Some research puts the rate of rise in the last 2000 years at 0.07mm/yr, and this reflects the fact that ice caps left over from the ice age are still melting, rather than that the world is warmer than before.
However, the impression is often given that, until the 20thC, this rate of rise has been pretty steady. This is despite the fact some of the authors of the above studies have warned of the existence of significant short-term fluctuations in sea level such that the sea level curve might oscillate up and down about this ~1 kyr mean state. [The above graph is based around 1000 year averages].
HH Lamb looked carefully at many expert studies in his day, and wrote about the very significant fluctuations they found. The following excerpts come from “Climate, History and the Modern World”:
1) The most rapid phases [of sea level rise] were between 8000 and 5000 BC, and that the rise of general water level was effectively over by about 2000 BC, when it may have stood a metre or two higher than today.
2) …
….
https://commons.wikimedia.org/wiki/File:Holocene_Sea_Level.png
by Anthony Watts, August 20, 2018 in WUWT
From ETH Zurich and the “slow as molasses in winter” department.
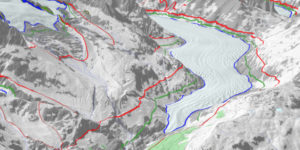
Hot summers cause glaciers to melt. That not only changes the makeup of the landscape and hence the maps of Switzerland, it also affects every area of society. A new, dynamic glacier inventory makes the impact of climate change and the changing landscape visible.
The last time Swiss glaciers managed to grow at all was in 2001. Since then, the country’s 1,500 glaciers – as well as others elsewhere – have been suffering a slow but inexorable death. Until now, though, we have understood only partially how quickly they are really disappearing, and what effect that has on the landscape, people and animals. That is about to change, thanks to the Glacier Monitoring in Switzerland (GLAMOS) project. GLAMOS is working on behalf of various Swiss federal offices to put together a comprehensive inventory of the country’s glaciers – at an unprecedented level of detail.
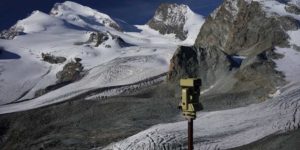
Glacier observation under the spell of several Valais four-thousand-metre peaks. (Photograph: GLAMOS)
by Stephen Moore, August 20, 2018 in ClimateChangeDispatch
Take a wild guess what country is reducing its greenhouse gas emissions the most? Canada? Britain? France? India? Germany? Japan? No, no, no, no, no and no.
The answer to that question is the United States of America. Wow! How can that be? This must be a misprint. Fake news. America never signed the Kyoto Protocol some two decades ago.
…
by Tony Heller, August 20, 2018 in TheDeporableClimateScienceBolg
Arctic sea ice melt dropped to its lowest level since May 12 yesterday, and now the Arctic won’t be ice-free until July 20 of next year, 12:01 am.
…
by Ole Humlum, August 20, 2018 in Climate4You
CONTENTS
July 2018 global surface air temperature overview
Comments to the July 2018 global surface air temperature overview Temperature quality class 1: Lower troposphere temperature from satellites Temperature quality class 2: HadCRUT global surface air temperature Temperature quality class 3: GISS and NCDC global surface air temperature Comparing global surface air temperature and satellite-based temperatures Global air temperature linear trends
Global temperatures: All in one, Quality Class 1, 2 and 3
Global sea surface temperature
Ocean temperature in uppermost 100 m
North Atlantic heat content uppermost 700 m
North Atlantic temperatures 0-800 m depth along 59N, 30-0W
Global ocean temperature 0-1900 m depth summary
Global ocean net temperature change since 2004 at different depths
La Niña and El Niño episodes
Troposphere and stratosphere temperatures from satellites
Zonal lower troposphere temperatures from satellites
Arctic and Antarctic lower troposphere temperatures from satellites Temperature over land versus over oceans
Arctic and Antarctic surface air temperatures
Arctic and Antarctic sea ice
Sea level in general
Global sea level from satellite altimetry
Global sea level from tide gauges
Northern Hemisphere weekly and seasonal snow cover
Atmospheric specific humidity
Atmospheric CO2
The phase relation between atmospheric CO2 and global temperature
Global air temperature and atmospheric CO2
Latest 20-year QC1 global monthly air temperature change
Sunspot activity and QC1 average satellite global air temperature
Climate and history: 1728: Vitus Bering and the non-discovery of Bering Strait
by P. Homewood, August 19, 2018 in NotaLotofPeopleKnowThat
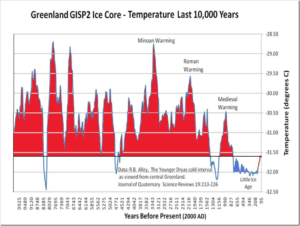
Booker commented the other day how one scientist claimed last week that we now have “the highest temperatures on Earth since the last ice age”. The BBC failed to even challenge this statement.
This certainly is not the first time I have heard claims (presented as fact) to this effect.
We have already seen concerted attempts to disappear the MWP, so it is time to reclaim the Holocene Optimum (so named for good reason), which is generally accepted to have run from about 9000 to 5000 years ago
Obviously we had no thermometers around in those days, so nobody knows what the average temperature of the Earth was then. There again, nobody really knows now either.
But there is plentiful evidence that many places were significantly warmer than now. I present some of this evidence below, though this is probably only skimming the surface: …
See also here
by Dr. S. Lüning and Prof. F. Vahrenholt, August 19, 2018 in NoTricksZone
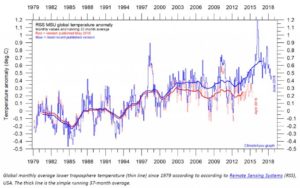
Temperatures can be measured from the ground and from satellites. Satellite data have two versions, UAH and RSS. The version of UAH (University of Alabama, Huntsville) makes a solid impression. The RSS version shows larger deviations and suggests a stronger warming.
How come?
Doping the data
Both datasets surely get their data from similar satellites. The explanation lies in a “post-processing” of the measured values by the RSS group. In the chart below you can see the old version in red.
Global temperature based on RSS satellite measurements. From Climate4You Newsletter June 2018.
…
by Tim Ball, August 18, 2018 in WUWT
…
All the trillions of dollars spent on AGW have not improved forecasting one bit. Instead, it diverted money that could have helped those large, primary sectors of society and economy that need better and more appropriate information. It is time to close all government weather offices or at least reduce their function to data collection determined by the end users.
…
by Eric Worrall, August 18, 2018 in WUWT
With the growing likelihood of an open party revolt and a leadership challenge, Australian Prime Minister Malcolm Turnbull has been forced into a humiliating backdown over his efforts to enshrine Australia’s Paris Agreement pledges into legislation.
…