The plots of the Seinfeld TV show often revolved around trivializing important things and blowing trivial things out of proportion. While not a Seinfeld fanatic (I’m more of a Frasierfanatic), I thought the comedy routines were generally brilliant and quite effective.
Peak Oil, abiotic oil and EROEI (energy returned on energy invested) are largely academic concepts. They are the subject of books, academic publications and Internet “debates” The “debates” about Peak Oil, abiotic oil and EROEI are a lot like the Seinfeld show. They magnify the trivial and trivialize things that actually matter. The “debates” often divide into two camps:
It’s the end of the world (Peak Oil, EROEI).
It’s our salvation from the end of the world (Abiotic oil).
While all three of these energy-related topics are, at least to some extent, real, none of them have the slightest relevance to energy production… except for Peak Oil… But the relevance is generally missed by both sides in Internet “debates.”
I had originally intended on combining Peak Oil, abiotic oil and EROEI into one post; but realized that it would have been longer than Tolstoy’s War and Peace. So, this post will be limited to Peak Oil. Part Deux will deal briefly with abiotic oil and Part Trois will deal more extensively with EROEI.
Peak Oil: A Real Thing That Doesn’t Matter
What is Peak Oil?
…
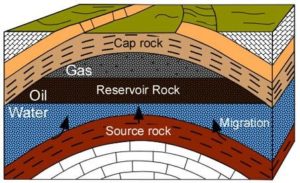
Figure 4. Generalized oil & gas reservoir. (Petropedia)
Yesterday I wrote here how some scientists misrepresent the observed data concerning Greenland ice melt in order to get the alarming results they want. There we see that Greenland has been melting, but recently much more slowly than what we are often led to believe.
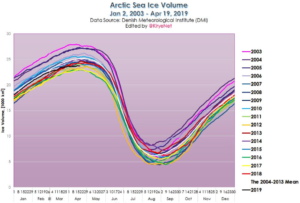
Looking at the latest Greenland ice volume data from the Danish Meteorological Institute (DMI), we see that currently the ice volume is below normal, but well within the range of the past 17 years:
Data source: Danish Meteorological Institute. Chart by Kirye.
Also Tony Heller at Real Science here plotted Arctic ice volume for the past 12 years in succession. Here’s how all the media-claimed rapid Arctic melting really looks
I thought about making this my last article on climate for this or any other website except my own. I planned the action some time ago, but it was the recent headline in the Telegraph that triggered this penultimate move. It said, “Climate change is a risk investors can’t ignore: Black Rock latest to sound the alarm on environment.”
Climate change is not a risk factor. Current climate and climate changes are normal and well within the pattern of change over history, certainly the last 10,000 years. The world believes otherwise, despite efforts by me and others to make the correct information available.
This means that after 50 years (1968-2019) of trying to educate the public about the weather, global warming, and climate change I achieved little or no change in understanding, attitude, or most importantly, policy on the world stage. My attempts to counter the massive deception that began as human-caused global warming (AGW) and later shifted to human-caused climate change, fell short. The deception is now what people accept, although they don’t necessarily believe. Because of that it is now the underlying reason for all policy on energy and environment that are the mainstay of these business-world views, indeed all views.
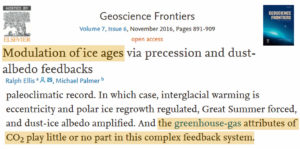
According to the calculations of Dr. James Hansen, the radiative influence derived from the increase in CO2 during the last deglaciation was so negligible that it equated to “a third of energy required to power a honey bee in flight” (Ellis and Palmer, 2016).
by Todd Royal, April 17, 2019 in ClimateChangeDispatch
When pollsters realized that the public and elected officials weren’t buying global warming as a concept or policy, in a brilliant political move, they came up with the phrase “climate change.”
This helped sell the theory of man-made global warming. Weather is politicized, and computer models are only predictions that have been used as pawns in elections and justifying increased government budgets.
The global warming/climate change (GWCC) narrative has made Al Gore a rich man peddling unrealized fear.
In January 2012, sixteen eminent scientists published an article in the Wall Street Journal, titled, “No Need to Panic About Global Warming.” If mankind is causing global warming, then how do you explain this?
Today’s CO2 concentrations worldwide average about 380 parts per million. This level of CO2 concentration is trivial compared with the concentrations during earlier geologic periods.
For example, 460 million years ago, during the Ordovician Period, CO2 concentrations were 4,400 ppm, and temperatures then were about the same as they are today. With such high levels of CO2 the Earth should have been boiling.
It seems more reasonable to be agnostic based upon this fact:
The idea of replacing petroleum products with alternative fuels produced from agriculture dates back to the 1973 and 1979 oil crises. But apart from the development of bioethanol from cane sugar in Brazil, the idea had not come to fruition because it was not economically viable. It was the frenzy for some kind of sustainable development in the mid-2000s, combined with a perfect storm of realities, that led to the emergence of a political interest in biofuels.
by Jean N., 17 avril 2019 in Science-Climat-Energie
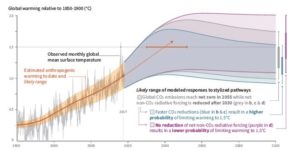
Cet article s’inscrit dans le cadre de l’activité actuelle médiatique tout azimut en Belgique, notamment relayée par les marches hebdomadaires des étudiants pour le climat. Comme vous le savez peut-être si vous êtes un lecteur fidèle de SCE, nous avons démontré dans plusieurs articles que l’hypothèse de l’effet de serre radiatif ne tient pas la route (ici, ici et ici) et n’explique pas le léger réchauffement actuel de la basse atmosphère. Les fins connaisseurs savent également qu’il existe de nombreuses publications scientifiques remettant en cause l’hypothèse de l’effet de serre radiatif (plus de 500 publications rien que pour 2018), toutes écrites par des physiciens, des chimistes, des géologues ou des climatologues. Si cette somme d’évidences vous a convaincu, le GIEC aurait alors tort sur toute la ligne et le CO2 d’origine anthropique n’aurait aucun rôle majeur déterminant la température de la basse troposphère. Cependant, admettons un instant que vous ne soyez pas convaincu et admettons donc que le GIEC ait raison. Tout ce qui est écrit dans son dernier rapport spécial devrait alors être vrai… Quelle serait alors la part de la Belgique dans le réchauffement? Asseyez-vous pour ne pas tomber, vous allez être surpris.
Figure 1. Extrait de la Figure SPM.1 du résumé pour décideurs (SPM) du rapport spécial publié par le GIEC fin 2018. Cette figure se trouve en page 8 du rapport du GIEC.
Proteins help organisms form or inhibit ice crystals
Contrary to what you may have been taught, water doesn’t always freeze to ice at 32 degrees F (zero degrees C). Knowing, or controlling, at what temperature water will freeze (starting with a process called nucleation) is critically important to answering questions such as whether or not there will be enough snow on the ski slopes or whether or not it will rain tomorrow.
Nature has come up with ways to control the formation of ice, though, and in a paper published today in the Journal of the American Chemical Society University of Utah professor Valeria Molinero and her colleagues show how key proteins produced in bacteria and insects can either promote or inhibit the formation of ice, based on their length and their ability to team up to form large ice-binding surfaces. The results have wide application, particularly in understanding precipitation in clouds.
“We’re now able to predict the temperature at which the bacterium is going to nucleate ice depending on how many ice-nucleating proteins it has,” Molinero says, “and we’re able to predict the temperature at which the antifreeze proteins, which are very small and typically don’t work at very low temperatures, can nucleate ice.”
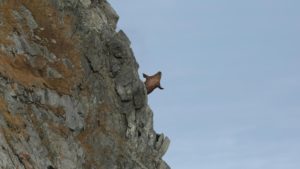
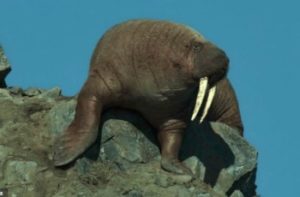
In the autumn of 2017, about 250 walruses in Russia, having climbed up to rocky slopes overlooking a beach, just walked over the edge.
Usually, gravity is no enemy of the walrus. When these animals encounter hard surfaces, they rise up to meet them, hauling their two-ton bulks onto floating pieces of ice. When they fall, they flop off those low platforms into the accommodating water. So you might imagine that a walrus, peering off a tall cliff, doesn’t really understand what will happen to it when it steps off. It doesn’t expect to plummet for 260 feet, cartwheel through the air, bounce off the rocks, and crash abruptly. Climb, plummet, cartwheel, bounce: These are not walrus-associated verbs.
…
A walrus falls down a 60m cliff face, from where it has been resting in the absence of sea-ice. Hundreds of walrus died falling from these cliffs in 2017.
A walrus falls from a cliff overlooking a Russian beach.SOPHIE LANFEAR
SCE fête son premier anniversaire avec 70 articles, près de 300 commentaires publiés (questions et réponses) et plus de 260 000 visiteurs.
Ce succès, il le doit à ses lecteurs car nous pensons qu’ils y trouvent une analyse critique des thèmes qui ne cessent d’occuper le devant de la scène médiatique nous montrant une dérive climatique tous azimuts symboliquement illustrée par la marche des lycéens, cautionnée par le monde politique et hélas aussi scientifique.
Notre site ne veut pas attiser la polémique mais bien susciter le débat car notre ligne directrice est l’argumentation et la discussion constructive en dehors de tous propos haineux, injurieux ou fantaisistes. Pas besoin de faire une dessin sur ce genre de propos que nous nous appliquons à ‘filtrer’ pour éviter les dérives qui sont monnaie courante sur les réseaux sociaux, mais finalement seulement moins de 5 % des commentaires sont refusés. Les commentaires argumentés qui contestent notre analyse sont bien entendu aussi publiés et c’est ainsi l’occasion de développer un débat serein, de mise au point réciproque. Tout le monde y gagne en clarté et compréhension. Nous ne prétendons pas détenir la vérité mais nos compétences nous permettent de discuter des problèmes climatiques et souvent de fournir un autre point de vue que celui relayé dans les médias.
L’hystérie climatique, vous l’aurez remarqué est hors norme, elle a récemment atteint des sommets que personne n’avait imaginé il y a seulement quelques années, et le ‘politiquement correct’ est devenu la règle de base pour qui ne veut pas d’ennuis. Combien de lycéens, de politiques, parfois même de scientifiques ont-ils lu les rapports du GIEC ? Connaissent-ils seulement les concentrations actuelle et passées du CO2, la composition de l’atmosphère… ? On peut en douter.
by T.M. Bonnicksen, November 12, 2018 in San FranciscoChronicle
The reason wildfires are burning California with unprecedented ferocity this year is because our public forests are so thick. It is our fault. We don’t manage our forests, we just let them grow. That is the simple truth. However, it is easier to deny the truth and blame a warming climate instead of admitting our guilt and taking action to prevent wildfires.
German climate skepticism may have awakened, and ironically it may in large part be an unintended consequence of the “Greta demonstrations”. Germans may be finally getting fed up with the hysteria that has emptied out schools and turned into an ambush on their industrial jobs.
German geologist Dr. Sebastian Lüning, who together with Prof. Fritz Vahrenholt runs German climate skeptic site Die kalte Sonne, was recently interviewed by the conservative Junge Freiheit TV in Berlin (In German).
While the mainstream media focus almost exclusively on the ultra-alarmist climate scenarios, Lüning takes a far more moderate, non-alarmist view of climate and man’s impact on it.
In Lüning’s view, natural factors play an as big, or even bigger. role on climate than humans do.
Recent warming “not unusual”
In the interview, Lüning explains how the assumptions made by the CO2 alarmists fall apart when tested against the observations of the past. The experienced German geologist explains why the modern 20th century warming is nothing unusual and that the same has already occurred numerous times over the past 10,000 years.
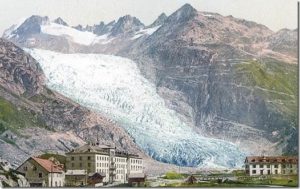
Start of industrialization coincided with end of Little Ice Age
One problem, Lüning says, is that scientists like to begin their temperature charts right before industrialization began in earnest, which happens to coincide near the temperature low point of the Holocene. He says that the term “pre-industrial” has been the source of “lots of confusion”.
by Graham Lloyd, April 10, 2019 in ClimateChangeDispatch
Netflix’s acclaimed Our Planet series has come under fire for “tragedy porn” over images of walruses falling to their deaths from cliff tops, allegedly because of climate change.
The Our Planet footage, narrated by David Attenborough, showed dozens of the animals climbing up 80-meter-high outcrops in northeast Russia because of a lack of sea ice.
They were shown plunging onto the rocks below, with hundreds of dead animals piled on the shoreline. A voice-over by Attenborough claimed their poor eyesight made it hard for them to return safely to the ocean.
But a Canadian zoologist has dismissed the claims as “contrived nonsense” and said the walruses were most likely driven over the cliffs by polar bears.
Susan Crockford, of the University of Victoria in British Columbia, Canada, told The Telegraph UK: “This powerful story is fiction and emotional manipulation at its worst.”
The polar bear expert said that at the time the footage was shot in 2017 at Kozhevnikova Cape, Ryrkaypiy, in eastern Russia, the town was being besieged by polar bears.
According to The Siberian Times, 20 bears had surrounded the town, attracted by 5,000 walruses that had appeared at a local protection zone.
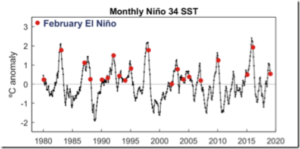
CFAN’s 2019 ENSO forecast is for a transition away from El Niño conditions as the summer progresses. The forecast for Sept-Oct-Nov 2019 calls for 60% probability of ENSO neutral conditions, with 40% probability of weak El Niño conditions. – Forecast issued 3/25/19
Introduction
CFAN’s early season ENSO forecast is motivated by preparing our seasonal forecast for Atlantic hurricane activity. ENSO forecasts made in spring have traditionally had very low skill owing to the ENSO ‘spring predictability barrier.’
During fall 2018, there was warming in the Central Equatorial Pacific, leading to a weak El Niño Modoki pattern, which impacted the latter part of the Atlantic hurricane season. This transitioned to a weak (conventional) El Niño in February 2019 and the atmospheric anomalies became more consistent with a conventional El Niño pattern.
NOAA’s latest forecast: Weak El Niño conditions are likely to continue through the Northern Hemisphere spring 2019 (~80% chance) and summer (~60% chance).
CFAN’s ENSO forecast analysis is guided by the ECMWF SEAS5 seasonal forecast system and a newly developed statistical forecast scheme based on global climate dynamics analysis.
ENSO statistics
…
Figure 1 illustrates the recent ENSO history as depicted by monthly Niño 3.4 anomalies from 1980 to February 2019.
As young people rightly demand real solutions to climate change, the question is not what to do — eliminate fossil fuels by 2050 — but how. Beyond decarbonizing today’s electric grid, we must use clean electricity to replace fossil fuels in transportation, industry and heating. We must provide for the fast-growing energy needs of poorer countries and extend the grid to a billion people who now lack electricity. And still more electricity will be needed to remove excess carbon dioxide from the atmosphere by midcentury.
Summary:The monthly anomalies in Australia-average surface versus satellite deep-layer lower-tropospheric temperatures correlate at 0.70 (with a 0.57 deg. C standard deviation of their difference), increasing to 0.80 correlation (with a 0.48 deg. C standard deviation of their difference) after accounting for precipitation effects on the relationship. The 40-year trends (1979-2019) are similar for the raw anomalies (+0.21 C/decade for Tsfc, +0.18 deg. C for satellite), but if the satellite and rainfall data are used to estimate Tsfc through a regression relationship, the adjusted satellite data then has a reduced trend of +0.15 C/decade. Thus, those who compare the UAH monthly anomalies to the BOM surface temperature anomalies should expect routine disagreements of 0.5 deg. C or more, due to the inherently different nature of surface versus tropospheric temperature measurements.
…
…
Conclusions
The UAH tropospheric temperatures and BOM surface temperatures in Australia are correlated, with similar variability (0.70 correlation).
Accounting for anomalous rainfall conditions increases the correlation to 0.80. The Tsfc trends have a slightly greater warming trend than the tropospheric temperatures, but the reasons for this are unclear. Users of the UAH data should expect monthly differences between the UAH and BOM data of 0.6 deg. C or so on a rather routine basis (after correcting for their different 30-year baselines used for anomalies: BOM uses 1961-1990 and UAH uses 1981-2010).
Leftists like Bill McKibben of 350.org suffer from irrational fantasies that lead them to believe that we can move society forward without all the benefits that petroleum brings to our modern society.
They’re dead wrong of course, and this short humorous video illustrates just what life might be like without the many products and energy sources that are derived from petroleum. My favorite is ink, which if we didn’t get from petroleum, we wouldn’t have to see print editions of NYT, WaPo, and the Lost Angeles Times, to name a few.
You also wouldn’t be able to read this article, because the very keyboard I am typing this on is made from plastic, which you guessed it, is derived from petroleum.
Depuis plusieurs années un des combats mené par les écologistes dans différents pays européens (Allemagne, France, Belgique, ..) fut et reste celui du nucléaire mené actuellement en parallèle avec celui de la réduction des gaz à effet de serre (GES). Les « verts » allemands ont obtenu la fermeture de presque toutes les centrales nucléaires et l’Allemagne a toujours une exploitation importante de centrales gaz-charbon. L’Allemagne est ainsi le plus grand émetteur de CO2 en Europe. Il en est de même des pays de l’Est et de la Russie qui exploitent essentiellement des centrales gaz-charbon. En Belgique, la fermeture définitive des centrales nucléaires est prévue pour 2025.
Are values of equilibrium climate sensitivity > 4.5 C plausible?
For background, see these previous posts on climate sensitivity [link]
Here are some possibilistic arguments related to climate sensitivity. I don’t think the ECS example is the best one to illustrate these ideas [see previous post], and I probably won’t include this example in anything I try to publish on this topic (my draft paper is getting too long anyways). But possibilistic thinking does point you in some different directions when pondering the upper bound of plausible ECS values.
5. Climate sensitivity
Equilibrium climate sensitivity (ECS) is defined as the amount of temperature change in response to a doubling of atmospheric CO2 concentrations, after the climate system has reached equilibrium. The issue with regards to ECS is not scenario discovery; rather, the challenge is to clarify the upper bounds of possible and plausible worst cases.
The IPCC assessments of ECS have focused on a ‘likely’ (> 66% probability) range, which has mostly been unchanged since Charney et al. (1979), to be between 1.5 and 4.5 oC. The IPCC AR4 (2007) did not provide any insight into a worst-case value of ECS, stating that values substantially higher than 4.5 oC cannot be excluded, with tail values in Figure 9.20 exceeding 10 oC. The IPCC AR5 (2013) more clearly defined the upper range, with a 10% probability of exceeding 6 oC.
Since the IPCC AR5, there has been considerable debate as to whether ECS is on the lower end of the likely range (e.g., < 3 oC) or the higher end of the likely range (for a summary, see Lewis and Curry, 2018). The analysis here bypasses that particular debate and focuses on the upper extreme values of ECS.
Extreme scientists and politicians warn we will suffer catastrophic climate change if the earth’s average temperature rises 2.7°F above the Little Ice Age average. They claim we are in a climate crisis because average temperature has already warmed by 1.5°F since 1850 AD. Guided by climate fear, politicians fund whacky engineering schemes to shade the earth with mirrors or aerosols to lower temperatures. But the cooler Little Ice Age endured a much more disastrous climate.
The Little Ice Age coincides with the pre-industrial period. The Little Ice Age spanned a period from 1300 AD to 1850 AD, but the exact timing varies. It was a time of great droughts, retreating tree lines, and agricultural failures leading to massive global famines and rampant epidemics. Meanwhile advancing glaciers demolished European villages and farms and extensive sea ice blocked harbors and prevented trade.
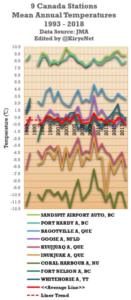
Canada’s CBC here recently cited “a leaked report” which claimed Canada is “warming at twice the global rate.”
According to the “leaked report”, Canada’s annual average temperature over land has warmed 1.7 C when looking at the data since 1948. But that claim is misleading when recent data is considered.
Over the past 25 years, since scientists began to warn that the planet was warming in earnest, there has not been any warming when one looks at the untampered data provided by the Japan meteorology Agency (JMA) that were measured by 9 different stations across Canada. These 9 stations have the data dating back to around 1983 or 1986, so I used their datasats.
Looking at the JMA database and plotting the stations with longer term recording, we have the following chart:
A number of scientists from the alarmist camp like to insist that there had never been such a hiatus. The latest paper contradicts that claim.
The new study states that many published analyses show that lightning activity is responsive to temperature on time scales ranging from the diurnal to the decadal and that the hiatus in global warming earlier this century can be seen in several global datasets.
Scientists found that the statistically flat behavior of the global lightning record from the NASA Lightning Imaging Sensor over the same decadal period is consistent with this hiatus in global warming.
What follows is the paper’s abstract:
Multiple records of global temperature contain periods of decadal length with flat or declining temperature trend, often termed a ‘hiatus’. Towards assessing the physical reality of two such periods (1940–1972 and 1998–2014), lightning data are examined. Lightning activity is of particular interest because on many different time scales it has been shown to be non-linearly dependent on temperature. During the earlier hiatus, declining trends in regional thunder days have been documented. During the more recent hiatus, lightning observations from the Lightning Imaging Sensor in space show no trend in flash rate. Surface-based, radiosonde-based and satellite-based estimates of global temperature have all been examined to support the veracity of the hiatus in global warming over the time interval of the satellite-based lightning record. Future measurements are needed to capture the total global lightning activity on a continuous basis.”
…
La géologie, une science plus que passionnante … et diverse