Archives par mot-clé : Fun?/Discussion

Distorting the view of our climate future: The misuse and abuse of climate pathways and scenarios

by R. Pielke & J. Richtie, 2020 in EnergyRes&SocScience


Abstract

Climate science research and assessments under the umbrella of the Intergovernmental Panel on Climate Change (IPCC) have misused scenarios for more than a decade. Symptoms of misuse have included the treatment of an unrealistic, extreme scenario as the world’s most likely future in the absence of climate policy and the illogical comparison of climate projections across inconsistent global development trajectories. Reasons why such misuse arose include (a) competing demands for scenarios from users in diverse academic disciplines that ultimately conflated exploratory and policy relevant pathways, (b) the evolving role of the IPCC – which extended its mandate in a way that creates an inter-relationship between literature assessment and literature coordination, (c) unforeseen consequences of employing a temporary approach to scenario development, (d) maintaining research practices that normalize careless use of scenarios, and (e) the inherent complexity and technicality of scenarios in model-based research and in support of policy. Consequently, much of the climate research community is presently off-track from scientific coherence and policy-relevance. Attempts to address scenario misuse within the community have thus far not worked. The result has been the widespread production of myopic or misleading perspectives on future climate change and climate policy. Until reform is implemented, we can expect the production of such perspectives to continue, threatening the overall credibility of the IPCC and associated climate research. However, because many aspects of climate change discourse are contingent on scenarios, there is considerable momentum that will make such a course correction difficult and contested – even as efforts to improve scenarios have informed research that will be included in the IPCC 6th Assessment.

Climate Change Causation: Was The Medieval Warm Period ‘Regional?’

by F. Menton, Jan 5, 2021 in ClimateChangeDispatch


Some commenters yesterday noted that the climate establishment has not just completely ignored the threat to their orthodoxy posed by the Medieval Warm Period and other similarly-warm pre-human-emissions eras.

Initially, there was a recognition that this issue could be important, and there was definitely some attempt to deal with it.

However, over time, the accumulation of evidence, particularly as to the existence Medieval Warm Period as a global phenomenon, gradually became overwhelming.

So — in the face of evidence that, under the normal precepts of the scientific method, would be deemed to invalidate the hypothesis that only human CO2 emissions could be causing current warming — how can the orthodoxy be kept alive?

The answer, almost entirely, has been to resort to the hand-waving of “detection and attribution” studies, and hope nobody notices. And, to a remarkable extent, nobody notices.

Readers may be interested in a short history of this issue.

See also  A prequel to the Dantean Anomaly: the precipitation seesaw and droughts of 1302 to 1307 in Europe

La fin du réchauffement… Pas du changement climatique!

by B. Van Vliet-Lanoë, Jan 1, 2021 in ScienceClimatEnergie


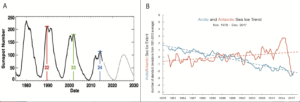
Un hiver froid s’annonce : le premier d’une série qui devrait durer au moins jusqu’en 2053 (Youssef et al., 2009 ; Zharkova et al.  2015 ; Van Vliet, 2019), période où les médias nous assènent une disparition de la banquise estivale, des ours polaires et des phoques ! Ceci est favorisé par l’activité solaire réduite depuis et le minimum solaire actuel (Fig.1). Le cycle solaire suivant (n°25) devrait aussi être faible. Nous y sommes entrés sans un Minimum d’activité aussi profond que celui Dalton (1790-1830) qui a présidé à la « Bérézina ».


Fig. 1: Intensité des cycles solaires depuis 1975 et la prédiction du cycle 25 (calculés avec le nombre de taches solaires  2018 * ANRPFD ).  B) évolution de l’extension en km2 des banquises arctique et antarctique depuis 1978 par rapport à la déviation standard 1981-2010 (NSDIC).

Number Of Global Wild Fires Trending Down Since 2003. Northern Ocean Heat Content Drops Since 2010


In his latest video the veteran geologist looks at wild fires worldwide and the CO2 they emit. He reports that both have been decreasing.

Citing the results of the European Copernicus satellite atmosphere monitoring service (CAMS), total wildfires globally have fallen steadily, along with their corresponding CO2 emissions:

The Middle East Doubles Down on Oil and Gas As the UN Warns of “Climate Emergency”

by T. Doshi, Dec 31, 2020 in WUWT


At the virtual “Climate Ambition Summit” co-hosted by the UN and UK and attended by over 70 world leaders on December 12th, Secretary-General António Guterres issued a stark warning: the world is facing a catastrophe ahead as it is on track to warm by more than 30 C by the end of the century “unless all countries declare climate emergency”. He expressed disappointment at the summit that the G-20 countries are “spending 50% more in their stimulus and rescue packages on sectors linked to fossil fuel production and consumption than on low carbon energy…This is unacceptable”.

The Secretary-General asked earnestly “Can anybody still deny we are facing a dramatic emergency”? The question poses the vast gulf between the policy positions of key Western governments and the oil and gas producers in the Middle East. For the Middle East hydrocarbon producers hit by the ‘double whammy’ of sharply reduced oil and gas price – the mainstay of government revenues — and the impact of Covid-19 lockdowns on domestic economic activity, the strategy for national survival is clear and could not be more opposed to the UN Secretary-General’s: sharply increasing the pace of monetizing the oil and gas reserves that their countries are blessed with.

Middle East To Supply More Oil And Gas

Within two weeks of the UN summit, Saudi Arabia’s energy minister announced on December 27th  the discovery of four new oil and gas fields, including unconventional resources. The discoveries will boost the country’s plans to increase its maximum sustained crude production capacity from the current 12 million b/d to 13 million b/d as well as developing its gas resources to free up more oil for export instead of burning it for power generation.

Egg on Their Faces: 10 Climate Alarmist Predictions for 2020 That Went Horribly Wrong

by T. O’Neil, Dec 28, 2020, in PJMedia


Long before Beto O’Rourke claimed the world only had 10 years left for humans to act against climate change, alarmists had spent decades predicting one doomsday scenario after another, each of which stubbornly failed to materialize. It seems climate armageddon has taken a permanent sabbatical.

Many of those doomsday predictions specifically mentioned the annus horribilus of 2020. Those predictions also failed, some rather spectacularly.

Steve Milloy, a former Trump/Pence EPA transition team member and founder of JunkScience.com, compiled ten climate predictions for 2020 that fell far off the mark.

1. Average global temperature up 3 degrees Celsius

10. Glaciers gone at Glacier National Park

In March 2009, U.S. Geological Survey ecologist Daniel Fagre predicted that the glaciers in Montana’s Glacier National Park would disappear by 2020.

New Climate Models (CMIP6) Offer No Improvement, Model Discrepancies As Large As The Last Version (CMIP5)

by K. Richard, Dec 24, 2020 in NoTricksZone


The “unsatisfactorily large” magnitude of the discrepancies between models in estimating the various radiative contributions to Earth’s energy imbalance serves to undermine confidence that CO2’s small impact could even be detected amid all the uncertainty.

Scientists have engaged in offering their educated guesses, or estimates, of cloud radiative effects for decades.

In the latest models, CMIP6, the top of atmosphere (TOA) net cloud radiative effects (CRE) when considering clouds’ longwave and shortwave combined impact is somewhere between -17 W/m² and -31 W/m² (Wild, 2020). That’s a 14 W/m²spread in CRE modeling.

The discrepancy range between modeled estimates for downward longwave clear-sky radiation is 22.5 W/m². This is the component where CO2’s underwhelming 0.2 W/m² per decade impact (Feldman et al., 2015) is manifested. Modeling discrepancies are thus more than 100 times larger than CO2’s forcing contribution over a 10-year period.

2020 Review: Observational And Modeling Studies Show Temperature Falls As CO2 Rises

by K. Richard, Dec 28, 2020 in NoTricksZone


A 2020 observational study (Zhang et al., 2020) determined “temperatures of atmospheric air with substantially higher CO2 concentration (ranging from 3200 ppm to 16,900 ppm) were lower than that with the lower CO2 concentration (480 ppm)” and a 2020 modeling study (Drotos et al., 2020) assessed that when CO2 goes beyond 4 times preindustrial – 1,120 ppm – “climate sensitivity decreases to nearly zero” because the climate cyclically cools by 10 K.

So the science is settled, right?


….

Greenland Fall Temperatures Unchanged. Proxy Data Show No Warming At 8 Of 9 Antarctic Peninsula Sites Since 1830!

by Kyrie, Dec 29, 2020 in NoTricksZone


Before looking at Antarctica Peninsula, we first take a look at Greenland, which also is considered by the global warming alarmists to be part of the most threatening tipping points. If the ice on Greenland ever melted, like they warn it will, sea levels globally would rise some 6 meters. (Never mind this scenario would take many centuries).

Today we look at the November and autumn trends in Greenland. First we look at November mean temperatures for which the Japan meteorological Agency (JMA) has sufficient data to compute a trend going back to 1999.


Four of the 6 stations examined show cooling or no warming trend.

But that’s only for one month, and so doesn’t really tell us a whole lot. So next we look at autumn mean temperatures for these six stations. If autumn is warming then we no that is not ideal for the overall ice formation season.

Wrong Again: 2020’s Failed Climate Doomsaying

by C. Rotter, Dec 18, 2020 in WUWT


Reposted from JunkScience.com

2020 has been the wildest and most unpredictable year in the memory of most people. But did the climate doom that was predicted to occur in or by 2020 materialize? What follows are 10 predictions made for 2020 and what really happened. As it turns out, climate doomsayers weren’t seeing so 20-20 when it came to 2020.

….

Another warm El Nino year

by GWPF, Dec 3, 2020


2020 is gearing up to be another warm year, strongly affected by natural and regional weather events

It’s that time of the year again when some meteorological organisations predict what the average global temperature might be for the full, current year. Not that we have all the data for 2020, obviously, for most global temperature datasets haven’t even processed November’s data yet. Making a prediction with only just over 80% of the data available is a risky procedure and most sensible scientists would be very circumspect about doing so. But these premature annual announcements are done for political purposes and, in a typical year, always as a precursor to a UN climate conference.

2020 has been a warm year, one of the warmest – and warm years make many people throw caution to the wind, making claims based on select facts they like, ignoring the ones they don’t like.

Let’s go back a few years to the early part of this decade when global temperature had been stagnating for more than ten years and not increasing significantly, as many had predicted. But then came 2014-15 when they started rising again, peaking in 2016. Many voices proclaimed that this was evidence that global temperatures were now accelerating ‘out of control’, something their models had been predicting all along. The climate was making up for all the unchanging years of the so-called global warming hiatus, it was claimed.

Never mind that the sudden rise between 2015 and 2016 was occurring much faster than could be due to greenhouse forcing alone.

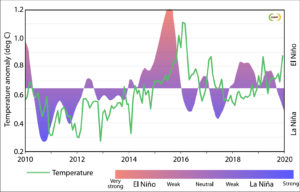
2010 – 2020: HadCrut4 global surface temperature change (green); Oceanic Niño Index (ONI) (red/blues)

However, it was not a coincidence that 2016 experienced a record El Nino. For some commentators, however, an El Nino is a finite event. According to its definition – a specific temperature increase in a certain region of the Pacific – an El Nino is either on or off. Hence, they said that subsequent warm years after 2016 were warm due to greenhouse forcing, not El Nino. They argued that average global temperature since then was not influenced by any El Nino warming.

But that’s clearly not the case. The build-up in temperatures before recent El Ninos is obviously not independent of its peak and neither is the decline afterwards, else why did that increase not continue after the El Nino’s ‘interruption.’ So, a year can still be showing the warming influence of previous El Nino conditions whilst not having an El Nino event, something many journalists and even the General Secretary of the World Meteorological Organisation (WMO), Prof Taalas, prefer to ignore.


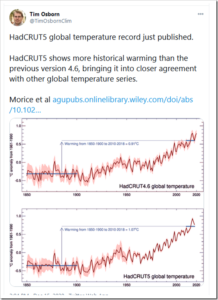
HadCRUT5 Adjusts Temperatures Upwards Again

by P. Homewood, Dec 16, 2020 in NotaLotofPeopleKnowThat


The Morice paper claims the extra warming has come from an improved representation of Arctic warming and a better understanding of evolving biases in sea‐surface temperature measurements from ships.

In fact it is not scientific to average together Arctic temperatures with the rest of the planet, as it is comparing apples with oranges. It all has to do with latent heat and water vapour, as Tony Heller brilliantly explained:

Britain’s Wild Weather–1940 Style

by P. Homewood, Dec 12, 2020 in NotaLotoPeopleKnowThat


The Winter of 1939/40

https://visitmarple.co.uk/photos/displayimage.php?album=123&pid=6858


According to the BBC/Met Office, Britain’s weather has been wild this year, and it is getting wilder. And their evidence?

A wet February, dry May and a couple of hot days in August. Statistically of course, you are likely to get one of two of these sort of events every year, with records going back 150 years or so.

So let’s go back and compare 2020 with some earlier years on record. Far from cherry picking years, I am only going to look at years ending in a zero, starting with 1940. The years 1950 and 1960 will follow later.

The year started with what was the coldest January on record at the time, a record which has only been beaten since by the infamous winter of 1962/63.

Sea surface skin temperature

by A. May, Dec 9, 2020 in WUWT


In previous posts, see here and here, I’ve tried to show that because the oceans cover 71% of Earth and they contain 99% of the thermal energy stored on the Earth’s surface, they dominate the speed and magnitude of climate changes. In all my posts the Earth’s surface is defined as everything from the ocean floor to the top of the atmosphere. The details of the calculation of ocean and atmospheric heat content is detailed in this spreadsheet. The ocean’s huge heat capacity prevents large temperature swings and dampens and delays those that do occur.

Attempting to show the direction, speed, and magnitude of climate change by measuring and averaging atmospheric surface temperatures is pointless, in my opinion. The record we have of atmospheric and ocean surface temperatures is too short and far too inaccurate to provide us with useful trends on a climatic (30 years +) time scale. Further, these records are sporadic measurements in a chaotic surface zone that has large temperature swings. In Montana, United States, for example, recent minimum/maximum temperatures have been as low as -70°F (-57°C) and as high as 117°F (47°C). These enormous swings make measuring year-to-year global average differences of 0.1°C exceedingly difficult. Yet, this is the precision demanded if we are to properly characterize a climate that is only warming at a rate of roughly 1.4°C/century, which is 0.014°C per year and 0.14°C/decade.

L’effet de serre et le bilan énergétique de la Terre

by G. Gueskens, Dec 11, 2020 in ScienceClimatEnergie


Dans presque toutes les sciences, les notions élémentaires sont les plus difficiles et elles sont parfois mal comprises. Par la suite, elles sont souvent  négligées car elles ne s’opposent pas à la publication d’articles dans des domaines spécialisés où les auteurs, à la recherche de notoriété ou de subsides, sont jugés par leurs pairs. La climatologie, science récente et pluridisciplinaire par essence, n’échappe pas à cette règle. C’est ainsi que beaucoup de climatologues, réputés tels ou simples amateurs, développent des théories dont les hypothèses sont contraires aux principes fondamentaux de la chimie et de la physique. Néanmoins,  sur la base de ces théories mal étayées, des modèles informatiques sont élaborés qui conduisent, avec une précision rassurante, à des prévisions alarmantes. Dans cette note nous rappellerons d’abord quelques notions élémentaires concernant l’émission et l’absorption de rayonnements par la Terre et par les gaz atmosphériques avant de revoir d’un point de vue critique les notions généralement admises à propos de l’effet de serre et du bilan énergétique de la Terre.

1. Deux types de rayonnement à ne pas confondre.

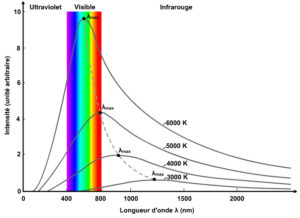
Fig. 1 Rayonnement thermique d’un corps solide à différentes températures

The Guardian: Children Won’t Know what Snow Is – AGAIN

by E. Worall, Dec 8, 2020 in WUWT


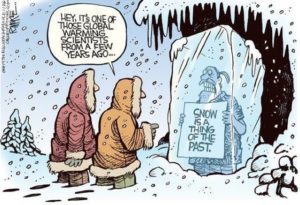
h/t James Delingpole / Breitbart; One of the most widely mocked alarmist predictions ever :- In the year 2000, Dr. David Viner beclowned himself by announcing that thanks to Global Warming, “children just aren’t going to know what snow is” (see the web archive – the original was deleted). Now Dr Lizzie Kendon of the UK MET office has followed Viner’s footsteps, by suggesting “much of the snow will have disappeared entirely” by the end of the century.


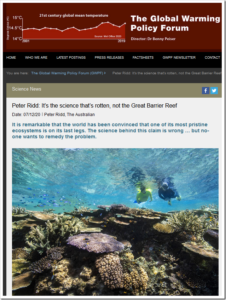
Peter Ridd: It’s the science that’s rotten, not the Great Barrier Reef

by P. Homewood, Dec 7, 2020 in NotaLotofPeopleKnowThat


The International Union for Conservation of Nature has released its latest report on the state of the Great Barrier Reef. It has turned up the volume by one notch, claiming the threat to the reef has gone from “significant concern” to “critical”. It blames climate change, agricultural pollution, coastal development, industry, mining, shipping, overfishing, disease, problematic native species, coal dust — you name it, it is killing the reef.

But the report is just a rehash of old, mostly wrong or misleading information produced by generally untrustworthy scientific institutions with an activist agenda and no commitment to quality assurance.

It is remarkable that the world has been convinced that one of its most pristine ecosystems is on its last legs. Part of the problem is that, being underwater and a long way from the coast, very few people visit the reef. The truth is hidden. Those of us in North Queensland living adjacent to the reef, and tourists from elsewhere, can report the water is iridescent clear blue and totally unpolluted. The fish and coral are fabulous.

CO2 Coalition: “The Global Mean Temperature Anomaly Record How it works and why it is misleading”

by D. Middleton,  Dec 8, 2020 in WUWT


Our friends at the CO2 Coalition have published another excellent report.

This white paper by Richard Lindzen and John Christy explores the global mean temperature anomaly record. Their focus isn’t on whether it’s right or wrong; it’s on its significance relative to natural variability and its inherently low signal-to-noise ratio. Here’s the executive summary:

STUDIES AND RESOURCES, WHITE PAPERS AND OTHER PUBLICATIONS

4 DEC, 2020
The Global Mean Temperature Anomaly Record
How it works and why it is misleading

by Richard S. Lindzen and John R. Christy

The CO2 Coalition is honored to present this Climate Issues in Depth paper by two of America’s most respected and prolific atmospheric physicists, MIT professor emeritus Richard Lindzen, who is a longtime member of the Coalition, and University of Alabama in Huntsville professor John Christy.

Professor Lindzen has published over 200 scientific articles and books over a five-decade career. He has held professorships at the University of Chicago, Harvard University and MIT. He is a fellow and award recipient of the American Meteorological Society and the American Geophysical Union. He is also a member of the National Academy of Science and was a lead author of the UN IPCC’s third assessment report’s scientific volume. His research has highlighted the scientific uncertainties about the impact of carbon dioxide emissions on temperature and climate more generally.

Professor Christy, the director of the Earth System Science Center at The University of Alabama in Huntsville, began studying global climate issues in 1987. He has been Alabama’s State Climatologist since 2000 and a fellow of the American Meteorological Society since 2002. He and CO2 Coalition member Dr. Roy W. Spencer developed and have maintained one of the key global temperature data sets relied on by scientists and government bodies, using microwave data observed in the troposphere from satellites since 1979. For this achievement, they were awarded NASA’s Medal for Exceptional Scientific Achievement.

The purpose of this paper is to explain how the data set that is referred to by policy-makers and the media as the global surface temperature record is actually obtained, and where it fits into the popular narrative associated with climate alarm.

Executive Summary
At the center of most discussions of global warming is the record of the global mean surface temperature anomaly—often somewhat misleadingly referred to as the global mean temperature record. This paper addresses two aspects of this record. First, we note that this record is only one link in a fairly long chain of inference leading to the claimed need for worldwide reduction in CO2 emissions. Second, we explore the implications of the way the record is constructed and presented, and show why the record is misleading.

This is because the record is often treated as a kind of single, direct instrumental measurement. However, as the late Stan Grotch of the Laurence Livermore Laboratory pointed out 30 years ago, it is really the average of widely scattered station data, where the actual data points are almost evenly spread between large positive and negative values.

The average is simply the small difference of these positive and negative excursions, with the usual problem associated with small differences of large numbers: at least thus far, the one-degree Celsius increase in the global mean since 1900 is swamped by the normal variations at individual stations, and so bears little relation to what is actually going on at a particular one.

Climate Activism: How Democracy Dies

by Donna Laframboise, Dec 6, 2020 in BigPicturesNews


Tomorrow night, Friends of Science will broadcast my speech, Climate Activism: Undermining Free Speech, Free Thought & Free Choice. Click here for details. (If you aren’t able to tune in then, purchasing a ticket will permit you to stream the event later, at your convenience.)

40 minutes in length, this talk explores how prominent members of the establishment have worked to shut down climate-related dialogue and debate. Those who express minority opinions have been cast as defective, depraved individuals on a par with Holocaust deniers.

The people fueling this incredible intolerance are prime ministers, vice presidents, UN officials, Nobel laureates, and Pulitzer Prize winners. There’s nothing admirable about silencing non-conformist perspectives. That’s how democracy dies.

The cancel culture now on full display on social media, in newsrooms, and on university campuses took root early in the climate world. Perhaps if more people had objected – loudly and on principal – to that improper behaviour, we’d be in a healthier, more tolerant place today.

Here’s a quote from my speech:

Are governments able to deliver the energy transition?

by S. Furfari, Nov 16, 2020 in EuropeanScientist


On 4 December 2019, in her first Brussels press conference the newly appointed president of the European Commission, Ursula von der Leyen, said she will lead a ‘geopolitical Commission’. One year later, we are still waiting for some ‘geopolitical’ results. Indeed, it is rather a ‘green Commission’, as even the Covid crisis – though its cause is totally unrelated to energy – is used to reinforce the ‘energy transition’, wanted by the German Chancellor. In September 1999, arriving as president of the European Commission Mr Romano Prodi has been convinced that energy was not so important and that it did not deserve to be managed by an energy general directorate. It merged it with the transport energy directorate. What a difference twenty later: energy is now the centre of all interest, not for its own merits, but because it is at the centre of the climate change debate. But are politicians able to drive the vast, complex and multi-dependent energy system? Is their willingness’s able to master it effective?

Not surprisingly, this concept of ‘energy transition’ was invented in Germany in the early 1980s. In a book entitled ‘Energie-Wende, Wachstum und Wohlstand ohne Erdöl und Uran’ published in 1980, researchers from a German environmentalist organisation, the Öko-Institut, proposed to stop using oil and uranium. The simplified term ‘EnergieWende’ was quickly coined to refer to the fight against climate change and the abandonment of nuclear energy. Germany has firmly followed this track since the beginning of the 21st century, aiming at a radical change in its energy policy. The German population has also adhered to this concept because, after 40 years of green nuclear bashing, it has become widely opposed tonuclear energy.

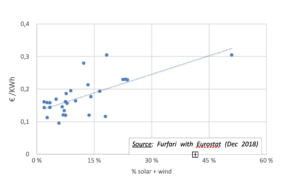
Figure 1Correlation of electricity price for dwellings with intermittent renewable electricity production
...


Covid-19 et émissions de CO2

by Prof. Jean N., Dec. 1, 2020 in ScienceClimatEnergie


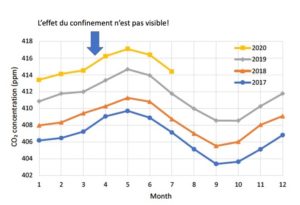
Début avril 2020, sans que personne ne s’en rende compte, une expérience scientifique très intéressante a été menée, et ce de manière involontaire. En effet, 3,9 milliards de personnes dans le monde ont été placées en confinement suite à l’expansion du virus Covid-19. Il en a résulté une très forte diminution du trafic aérien et automobile accompagné d’une fermeture temporaire de nombreuses industries dans le monde entier. Cette expérience a évidemment provoqué une chute drastique des émissions de CO2 anthropique. Mais pendant l’expérience, les détecteurs mesurant le taux de CO2 atmosphérique ont continué à tourner. Nous disposons maintenant des résultats. Cette diminution abrupte des émissions a-t-elle eu un impact sur le taux de CO2 atmosphérique, ou sur la température globale? C’est ce dont nous allons discuter dans le présent article.

1. Bref rappel concernant la mesure du taux de CO2 atmosphérique.

L’observatoire de Mauna Loa à Hawaii est l’un des plus célèbres sites mesurant en continu le taux de CO2 atmosphérique. Ce taux est mesuré avec précision depuis 1959 par une méthode de spectrométrie infra-rouges, et depuis 2019 par la méthode CRDS (Cavity Ring-Down Spectroscopy). La courbe obtenue est croissante avec des oscillations régulières (Figure 1). De ± 320 ppm en 1959 on arrive à ± 410 ppm en 2020. SCE a d’ailleurs publié une suite d’articles sur ce sujet[1].

Figure 3. Taux de CO2 mesuré à Mauna Loa depuis 2017. Source : Koutsoyiannis & Kundzewicz (2020) Sci 2020, 2, 72

….

Internal Multidecadal and Interdecadal Climate Oscillations: Absence of Evidence Is No Evidence of Absence

by G. Müller-Plath, Nov 29, 2020 in WUWT


Introduction

The present paper contributes a critical commentary on the recent finding by Mann, M. E., Steinman, B. A. and Miller, S. K (2020). Absence of internal multidecadal and interdecadal oscillations in climate model simulations. Nat. Commun. 11, 1–9.

Climate oscillations are recurring large-scale fluctuations in the surface temperatures of the oceans in connection with the atmosphere. This commentary focuses on the Pacific Decadal Oscillation (PDO, interdecadal timescale) and the Atlantic Multidecadal Oscillation (AMO, multidecadal timescale), which have been regarded as intrinsic climate drivers on the adjacent continents in numerous studies based on observations and paleoclimate reconstructions (Henley, 2017O’Reilly et al., 2017). In a recent paper, Michael E. Mann and colleagues (Mann et al., 2020, hereafter M20) fail to find a PDO signal in global measured and modeled temperatures that is statistically different from noise. They further propose that the significant AMO-like signal is mainly due to anthropogenic aerosols in the 20th century, and to statistical artifacts before. Therefore they doubt the intrinsic nature of the two oscillations. The present paper shows that M20’s results are largely artifacts themselves with issues ranging from using inadequate data and referencing improper literature on anthropogenic aerosols with regards to the AMO to inappropriately interpreting the results with regards to the PDO.


Énergies renouvelables dans l’UE : de la perception aux réalités

by S. Furfari & E. Mund, 27 Nov 2020 in ConnaissanceEnergies


Nous assistons aujourd’hui à des conversations interminables sur l’« énergie » sans que ce dont on parle soit dûment précisé. Parle-t-on de l’énergie pour chauffer notre maison ou bien de celle nécessaire pour charger un véhicule électrique ? Ce n’est pas indifférent. Beaucoup ignorent les principes fondamentaux, alors que d’autres les connaissent mais évitent soigneusement d’en tenir compte.

L’un de ces principaux fondamentaux est la distinction entre « énergie primaire » et « énergie finale ». Précisons qu’il ne s’agit pas d’une vaine querelle de mots : une bonne compréhension a un impact fondamental en matière de choix de politique énergétique et d’adoption lucide de cette politique par les citoyens concernés.

Lorsque l’on ramène le poids des filières renouvelables intermittentes dans le bilan en énergie primaire de l’UE – l’indicateur fondamental lorsqu’on se préoccupe d’énergie, que ce soit pour les aspects géopolitiques, de balance des paiements et de décarbonation – leur part se limite ainsi à quelques pourcents. En 2018, ces énergies si populaires dans les médias n’ont ainsi compté que pour 2,5% de la consommation d’énergie primaire dans l’UE à 27 (1,4% en France, 1,8% en Belgique et 4,3% en Allemagne)…

Physicists: A CO2 Rise To 800 ppm Causes ‘Hypothetical’ 10°C Upper Atmosphere Cooling, 1.4°C Surface Warming

by Wijnagaarden & Happer, Nov 26, 2020 in NoTricksZone


At the current concentrations, the forcing power for greenhouse gases like CO2 (~400 ppm) and CH4 (1.8 ppm) are already saturated. Therefore, even doubling the current greenhouse gas concentrations may only increase their forcings “by a few percent” in the parts of the atmosphere where there are no clouds. When clouds are present, the influence of greenhouse gases is even further minimized.

While the “consensus” model view is that doubling CO2 from 280 ppm to 560 ppm results in a surface forcing of 3.7 W/m², Wijngaarden and Happer find doubling CO2 concentrations from 400 to 800 ppm increases climate forcing by 3 W/m². This warms the surface by 1.4 K as it “hypothetically” cools the upper atmosphere by 10 K.

Equilibrium climate sensitivity (when positive feedback with water vapor is included) is identified as 2.2 K, which is within 10% of multiple other analyses.