Archives par mot-clé : Global Temperature

The New Pause Lengthens to 8 Years

by C. Monckton of Brenchley,  Oct 6, 2022 in WUWT


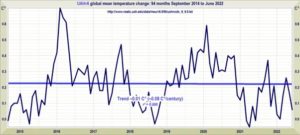
The New Pause, having paused a month ago, has now lengthened again: this time to exactly eight years. As always, the Pause is calculated as the longest period for which the least-squares linear-regression trend up to the most recent month for which the UAH global mean surface temperature anomaly is available is zero.


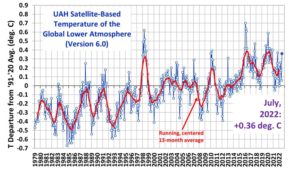
The trend on the entire dataset during the 526 months from December 1978 to September 2022 is 0.95 C°, equivalent to only 1.34 C°/century. So slow a rate of warming is well within the natural variability of the climate, and is proving net-beneficial.

The New Pause has grown to fully eight years in length at a most embarrassing point for true-believers: for the cost to the West of the economically suicidal policies that they have long advocated is now becoming all too painfully apparent, just as it is also ever more evident that the warming since 1990 is well below half the midrange prediction made by IPCC that year.


Global temperature hiatus may not have ended after all, new study suggests

by D. Whitehouse, Sep 23, 2022 in NetZeroWatch


The so-called hiatus in global annual average temperature between 2002 – 2014, once controversial to some but now well-established in the peer-reviewed literature, ended in 2014 with the start of a series of record-breaking El Nino events that spiked global temperature with a subsequent fall-back. Now a new study into the effect of man-made aerosol pollution adds to likely reasons for the end of the hiatus, and may point to lower estimates for future global warming.

An international research team writing in the journal Atmospheric Chemistry and Physics, uses satellite data to show that concentrations of aerosol particles have decreased significantly since 2000. This is good news as cleaner air benefits health, but it also reduces particles’ which have a cooling effect on the terrestrial climate.

According to the Intergovernmental Panel on Climate Change (IPCC), by 2019 the global temperature had risen by 1.1 degrees Celsius compared to pre-industrial levels due to increasing greenhouse gasses from burning fossil fuels. At the same time the combustion of fossil fuels emit aerosols which cool our climate by reflecting sunlight and increasing the reflectivity of clouds.

Professor Johannes Quaas, a meteorologist at Leipzig University, and colleagues from Europe, China, and the US have published robust observational evidence of significant reduction of aerosol pollution and improved global air quality.

Global temperature hiatus may not have ended after all, new study suggests

by Dr D. Whitehouse, Sep 23, 2022 in NetZeroWatch


The so-called hiatus in global annual average temperature between 2002 – 2014, once controversial to some but now well-established in the peer-reviewed literature, ended in 2014 with the start of a series of record-breaking El Nino events that spiked global temperature with a subsequent fall-back. Now a new study into the effect of man-made aerosol pollution adds to likely reasons for the end of the hiatus, and may point to lower estimates for future global warming.

An international research team writing in the journal Atmospheric Chemistry and Physics, uses satellite data to show that concentrations of aerosol particles have decreased significantly since 2000. This is good news as cleaner air benefits health, but it also reduces particles’ which have a cooling effect on the terrestrial climate.

According to the Intergovernmental Panel on Climate Change (IPCC), by 2019 the global temperature had risen by 1.1 degrees Celsius compared to pre-industrial levels due to increasing greenhouse gasses from burning fossil fuels. At the same time the combustion of fossil fuels emit aerosols which cool our climate by reflecting sunlight and increasing the reflectivity of clouds.

Professor Johannes Quaas, a meteorologist at Leipzig University, and colleagues from Europe, China, and the US have published robust observational evidence of significant reduction of aerosol pollution and improved global air quality.

When taken together with a couple of super-strong El Nino events which temporarily drove up global temperature (see graph below), the new findings suggest that the global warming hiatus — clearly evident prior to 2014 — may not have ended yet. If NASA’s satellite data are confirmed, it would suggest that much of the very moderate changes in global temperature this century may have been driven primarily by cleaner air and naturally-occurring El Ninos.

Global temperature changes 2000-2022. Source: Met Office/HadCRUT5

How Can The Globe Be Warming When Most Of The Southern Hemisphere Isn’t?

by K. Richard, Sep 22, 2022 in NoTricksZone


New research continues to document non-warming and even “robust cooling” trends for entire regions of the Southern Hemisphere in recent decades.

Land surface temperature data compilations from the Southern Hemisphere (South America, Southwestern Andes, Tasmania, New Zealand, Australia) indicate that any warming during the 20th century occurred before 1980, with no obvious net warming since (Rezsöhazy et al., 2022).

Sea surface temperature data from the Southeastern Indian Ocean, Tasman Sea, and Great Barrier Reef region indicate no net warming since 1982 (Chapman et al., 2022).

A 2021 study reported a profound cooling trend for most of Antarctica in recent decades, with amplitudes of -2.8°C for East Antarctica and -1.68°C for West Antarctica during 1979-2018.

CMIP6 GCM ensemble members versus global surface temperatures

by N. Scafetta, Sep 18, 2022 in Springer


Abstract

The Coupled Model Intercomparison Project (phase 6) (CMIP6) global circulation models (GCMs) predict equilibrium climate sensitivity (ECS) values ranging between 1.8 and 5.7 C. To narrow this range, we group 38 GCMs into low, medium and high ECS subgroups and test their accuracy and precision in hindcasting the mean global surface warming observed from 1980–1990 to 2011–2021 in the ERA5-T2m, HadCRUT5, GISTEMP v4, and NOAAGlobTemp v5 global surface temperature records. We also compare the GCM hindcasts to the satellite-based UAH-MSU v6 lower troposphere global temperature record. We use 143 GCM ensemble averaged simulations under four slightly different forcing conditions, 688 GCM member simulations, and Monte Carlo modeling of the internal variability of the GCMs under three different model accuracy requirements. We found that the medium and high-ECS GCMs run too hot up to over 95% and 97% of cases, respectively. The low ECS GCM group agrees best with the warming values obtained from the surface temperature records, ranging between 0.52 and 0.58 C. However, when comparing the observed and GCM hindcasted warming on land and ocean regions, the surface-based temperature records appear to exhibit a significant warming bias. Furthermore, if the satellite-based UAH-MSU-lt record is accurate, actual surface warming from 1980 to 2021 may have been around 0.40 C (or less), that is up to about 30% less than what is reported by the surface-based temperature records. The latter situation implies that even the low-ECS models would have produced excessive warming from 1980 to 2021. These results suggest that the actual ECS may be relatively low, i.e. lower than 3 C or even less than 2 C if the 1980–2021 global surface temperature records contain spurious warming, as some alternative studies have already suggested. Therefore, the projected global climate warming over the next few decades could be moderate and probably not particularly alarming.

Climate Scaremongers Take Note: It Was Hotter In 1976!

by P. Homewood, Sep 13, 022 in ClimateChange Dispatch


For weeks we have been told that this year’s warm summer is due to climate change.

The BBC’s Justin Rowlatt was quite clear: ‘We know what is behind this – greenhouse gas emissions caused by our burning of fossil fuels like coal and gas,’ a message amplified across the media and stoked by the Met Office, who delighted in their red warnings and public health alerts. [bold, links added]

It was not only the heat. The Met Office claimed that this summer’s drought is a harbinger of the future we could expect, ably assisted by fraudulently misleading images of ‘dried up reservoirs’ on BBC News.

As many of us suspected all along, the summer of 2022 was not a record breaker at all, as it was much hotter in 1976, as the Central England Temperature Series makes clear:

https://www.metoffice.gov.uk/hadobs/hadcet/data/meantemp_seasonal_totals.txt


Indeed it was hotter in 1826 and 2018, and this summer was no hotter than in 1995 and 2006.

A Much Larger Greenhouse Effect – But Temperatures Dominated by Cooling

by W. Röst, Sep 9, 2022 in WUWT


Abstract

The Earth’s greenhouse effect is much larger than suggested so far. If surface radiation and the greenhouse effect set surface temperatures, our oceans would be boiling. Fortunately, they don’t. Water Earth has a strong water-vapor-based evaporative surface cooling mechanism that effectively sets and stabilizes surface temperatures at a much lower level than cooling by surface radiation emissions can do. Thanks to water vapor our temperature system is far more stable than admitted by the consensus, and thanks to water, water vapor, and clouds surface temperatures are favorable for present life.

Introduction

Early Earth consisted of hot molten lava covered by an extreme greenhouse atmosphere: hardly any surface radiation could reach space, if any. Nevertheless, its surface cooled. Upward convection brought sensible and latent heat from hot surfaces to elevations on the very edge of the atmosphere from where energy effectively could be radiated into space. Despite the near maximal greenhouse effect the surface of Early Earth cooled down and at a certain moment the first oceans developed. Those boiling oceans still resulted in a huge upward convective transport of energy, further cooling the surface. Until now, convective upward transport of energy plays the main role in surface cooling. Convection sets and regulates surface temperatures at actual level. Without evaporative-convective-cloud-cooling, our actual greenhouse atmosphere would theoretically result in a surface temperature of 202.3°C. On the real Earth the greenhouse effect warms the surface, but greenhouse warming does not set and control final surface temperatures. Earth’s H2O-based cooling system does.

Theoretical greenhouse effect


Conclusions

The Earth’s greenhouse effect is huge, much higher than normally assumed. If cooled by ‘surface radiation only’ the surface of a theoretical planet would have had a surface temperature of 202.3°C. But the Earth’s surface temperatures are not set by the strength of Earth’s greenhouse effect. Additional H2O-based cooling systems keep the surface at a much lower temperature, balancing rising surface radiation uptake. At present, that balance is reached at a yearly average of 15 degrees Celsius.

Thanks to H2O-related surface cooling the Earth’s surface temperatures are bound to a narrow range, at a temperature level well suited for life on Earth. Due to its stability, life developed over many hundreds of millions of years.

Temperature regulates the cooling system; the cooling system regulates temperature.

Pre-1970s ‘Global’ Sea Surface Temp Measurements Are No More Reliable Or Accurate Than Guessing

by K. Richard, Sept 8, 2022 in NoTricksZone


The accuracy of the long-term global instrumental temperature record – especially the data obtained before the 1970s – wholly rests on the assumption that sailors obtained precisely reliable temperature measurements as they pulled wooden or canvas buckets out of the water from ships at random depths, locations, and times of day. They didn’t.

It has long been known that pulling a bucket out of the water from a ship is rooted in serious error, rendering the sea surface temperature (SST) data obtained nearly useless. Ashford (1948) summarized some of the more salient reliability problems with this method of measurement.

• The initial temperature of the bucket is generally different from that of the sea.

• The water in the bucket may change its temperature before the reading is taken owing to the processes of heat exchange and evaporation.

• The initial temperature of the thermometer is generally different from that of the sample.

• The thermometer is liable to scale errors.

• Owing to thermal lag, the thermometer may take an appreciable time to indicate the true temperature of the sample.

• If the thermometer is removed from the bucket when taking the reading, it may no longer indicate the true water temperature.

• The temperature may be read incorrectly.

Numbers — Tricky Tricky Numbers: Part 3

by Kip Hansen, Aug 25, 2022 in WUWT


Bottom Lines:

1.  To support a claim that the Earth’s Climate System is “getting hotter” one has to have a long-term time series of measurements of heat in the climate system.

2.  Current Global Mean Temperature data sets do not measure heat and thus can not supply evidence for #1.

3.  The lack of such a time-series doesn’t mean that the Earth’s climate isn’t gaining energy (heat) – it simply means we don’t have any reliable measure of it.

4.  Climate Science may have some evidence of long-term energy gain or what is commonly labelled “Earth’s Energy Budget” — energy in/energy out — but it doesn’t seem to be dominate in the ongoing climate controversy.  The latest paper shows that we can still cannot directly measure instantaneous radiative forcing.  “This fundamental metric has not been directly observed globally and previous estimates have come from models.  In part, this is because current space-based instruments cannot distinguish the instantaneous radiative forcing from the climate’s radiative response.”  It is possible that future satellite missions will be able to measure directly and accurately Earth’s incoming and outgoing energy.

Activist Scientists Have Now Officially Changed A -0.5°C Global Cooling Trend Into A Warming Trend

by K. Richard, Aug 15, 2022 in NotricksZone


Back in the days when data manipulation was still strictly forbidden, scientists reported the globe cooled significantly for decades even as CO₂ concentrations increased.

The global cooling amplitude was -0.5°C from 1960-1965, and 1976 was reported to be the coldest year of any year measured since 1958 (Angell and Korshover, 1978).

Today these recorded 1960-1965 and 1958-1963 cooling trends have been fully erased and replaced with a slight warming or pause.

Was It Hotter In 1911?

by P. Homewood, July 23, 2022 in NotaLotofPeopleKnowThat


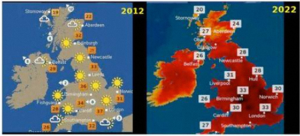
There has inevitably been a lot of apoplectic reporting about this week’s heatwave in Britain. Everybody from the BBC to the Met Office have been blaming it on climate change, with suitably scary colours to ram the message home:

Comparison of TV weather Maps from the BBC in summer 2012, left, and summer 2022 right. Source: BBC

Courtesy of Climate Realism

But so far I have not seen an objective analysis.

So let’s start with a few simple facts:

1) It was extremely hot for a couple of days this week.

2) The heat was the result of an extremely unlikely set of meteorological conditions – a perfect storm, if you like.

We know this because the Met Office told us so. On July 8th, they announced the possibility of a heatwave a week later. The weather model runs produced a wide band of possibilities, with most predicting similar temperatures to the weekend before, and some even forecasting no heatwave at all. At that stage on a couple of models out of the hundreds run predicted 40C temperatures, which were described by the BBC as “a very tiny possibility”.


Climate Monitoring Since The Little Ice Age

by P. Homewood, July 19, 2022 in NotaLotofPeopleKnowThat


Meanwhile the jokers at the Met Office don’t seem to have realised that their temperature records begin at the depth of the Little Ice Age, or appear to have heard about Urban Heat Islands

It is mid July 2022. We are currently experiencing a significant – at the time of writing provisionally record-breaking – heatwave for the UK. Red weather warnings for extreme heat are in force for large parts of England and forecasts indicated a real possibility of temperatures reaching up to 40°C in some areas. Indeed, this temperature has already been exceeded. Whether or not records are broken, a key part of the work that we do at the Met Office is climate monitoring, an important aspect of which is the ability to put current weather into historical context. Climate monitoring serves many functions: It can effectively communicate the relative severity of an event; it can indicate how frequently such extremes are likely to occur; and it can monitor how the character or frequency of extremes are changing over time. In order to properly understand the risks from climate change, a key research question climate monitoring can help us to answer is, ‘What are the current weather and climate hazards, risks and impacts that should be expected in the UK and globally?’. To address this question, we must look to the past, and the scientific effort goes back further than you might think.

Making history

In 1663, Robert Hooke stood before the relatively newly formed Royal Society and proposed ‘A method for making the history of the weather’. Hooke and other notable scientists of the time were actively developing instruments capable of making meteorological measurements of wind, rain, air pressure, humidity and temperature. These were the early anemometers, rain gauges, barometers and thermometers of the time1. In his paper, Hooke recommended what should be measured and how it should be recorded, including ‘a scheme at one view representing to the eye the observations of the weather for a month’ and implored his colleagues to undertake such measurements. From a modern climatologist’s point of view, arguably one of the most important advances by Hooke was his recognition that if systematic and consistent measurements were made across the country, or even across the world, then an international perspective on the weather could be obtained, for the benefit of humankind. 

The Two Degree Limit

by Andy May, July 19, 2022 in WUWT


For decades We have been told that we must not let global warming exceed two degrees Celsius above the “pre-industrial” global average temperature. Recently the IPCC lowered this limit to 1.5°C. In the latest IPCC report, called AR6, pre-industrial is defined as before 1750, but they use global temperatures from 1850-1900 as representative of the period because global average surface temperatures are not available for 1750.[1] The U.S., Europe, and much of Asia were industrialized by 1900, so their numbers are clearly not representative of the period of interest, unless temperatures remained constant from 1750 to 1900, which is unlikely.

Why the focus on 2°? In a 2014 comment in Nature, David Victor and Charles Kennel tell us that there is little scientific basis for the 2°C figure, but it was a simple focal point and it “sounded bold and perhaps feasible.” (Victor & Kennel, 2014). Then they admit the goal is “effectively unachievable.”

What is the “pre-industrial?” Did it have an ideal climate that we wish to return to? The year 1750 was in the coldest and most miserable part of the Little Ice Age (LIA). The LIA was the coldest period in the Holocene Epoch, or since the last glacial period ended about 12,000 years ago, at least in much of the Northern Hemisphere.

Global-Scale Warming Events Of ‘Up To 15 °C Within A Few Decades’ Have Occurred Since The Jurassic

Boulila et al., 2022 in NoTricksZone


A new study (Boulila et al., 2022) suggests “abrupt and severe changes in Earth’s past climate” have been occurring at ~1,500-year periodicities since the iceless Jurassic period.

Warming events of degrees C per within decades or less were at one time thought to have occurred only at locations like Greenland and the North Atlantic during the last glacial period (70 to 12 thousand years ago).

But the evidence has been piling up from locations throughout the globe (e.g., on continents and tropical to high latitude oceans, lakes, and rivers) indicating these warming events have “a global interconnection between the two hemispheres.”

These “abrupt and severe” global warming events with ~1,500-year periodicities can even be traced back to the iceless Jurassic period when Antarctica was a rainforest and 38°C warmer than today. This suggests the driving force for these global warming periods were not dependent on ice sheet dynamics.


Abstract

Earth’s past climate exhibits short-term (1500-year) pronounced fluctuations during the last glacial period, called Dansgaard–Oeschger (DO) glacial events, which have never been detected in pre-Quaternary times. The record of DO equivalent climate variability in Mesozoic strata can provide constraints on understanding these events. Here we highlight a prominent 1500-year cyclicity in a Jurassic (~ 155 Ma) ice-free sedimentary record from the Tethyan Basin. This Jurassic 1500-year cyclicity is encoded in high-resolution magnetic susceptibility (MS) proxy data reflecting detrital variations, and expressed as marl-limestone couplets. Additionally, MS data detect the modulation of these DO-scale couplets by supercouplet sets, reflecting the precession and its harmonics. We suggest that this Jurassic DO-like cyclicity may originate from paleo-monsoon-like system, analogous to the record of DO events in the Pleistocene East Asian monsoon archives. Paleogeographic reconstructions and atmosphere–ocean simulations further support the potential existence of strong, ancient monsoon circulations in the Tethyan Basin during the Jurassic.

New Study: Greenland ‘Must Have Been At Least 3°C Warmer’ Than Today During The Early Holocene

by K. Richard, Jul 4, 2022 in NoTricksZone


These much warmer Greenland temperatures imply that the elevation of the ice sheet was 400 meters lower than it is today from about 6,000 to 10,000 years ago.

Scientists (Westhoff et al., 2022) report that the two largest Greenland melt events in the last few hundred years occurred in 2012 and in 1889 CE – when atmospheric CO2 levels were still under 300 ppm.

The “melt events around the Holocene Climate Optimum were more intense and more frequent” than has been observed during the modern period. And the most prominent melt events of the last 10,000 years centered around the Medieval Warm Period, 986 CE.

Overall, the elevation of the Greenland ice sheet has grown by 0.4 km since the Early Holocene, as “summer temperatures must have been at least 3 ± 0.6°C warmer during the Early Holocene compared to today.”

“We Live In The Coldest Period Of The Last 10.000 Years”

by P. Homewood, Jul 5, 2022 in NotaLotofPeopleKnowThat


Jørgen Peder Steffensen is an Associate Professor at the University of Copenhagen and one of the world’s leading experts on ice cores. Using ice cores from sites in Greenland, he has been able to reconstruct temperatures there for the last 10000 years. So what are his conclusions?

  • Temperatures in Greenland were about 1.5 C warmer 1000 years ago than now.

  • It was perhaps 2.5 C warmer 4000 years ago.

  • The period around 1875, at the lowest point of the Little Ice Age, marked the coldest point in the last 10,000 years.

  • Other evidence from elsewhere in the Northern Hemisphere confirms this picture.

The New Pause Lengthens to 7 Years 10 Months

by C. Monckton of Brenchley, July 2, 2022 in WUWT


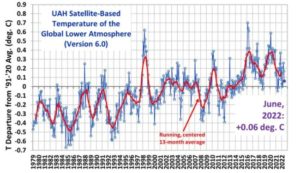
The New Pause paused last month because I was ill. Many apologies for the interruption. Now, however, it resumes – and it has lengthened from 7 years 7 months to the end of April 2022. To the end of June 2022, the New Pause is now 7 years 10 months in length:


This Pause, like its predecessor, which was an impressive 18 years 8 months (UAH), or 18 years 9 months (HadCRUT4), is, as always, not cherry-picked. It is derived from the UAH monthly global mean lower-troposphere temperature anomalies as the period from the earliest month starting with which the least-squares linear-regression trend to the most recent month for which data are available does not exceed zero. Whatever the data show, I show. Or, in the immortal words of Dr Roy Spencer, speaking of his dataset, “It is what it is”. In that splendid dictum speaks all true science.

The least-squares trend, which Professor Jones at the University of East Anglia used to recommend as the simplest and most robust method of deriving global-temperature trends, takes due account of all monthly values, not merely of the starting and ending values.


See also here

German Physicist: Human CO2 Emissions Responsible For 0.05°C Of The Global Warming Since 1750

by H. Harde, June 20,2022 in NoTricksZone


Professor Herman Harde, an environmental physicist, has authored a new position paper on the follies of assuming humans significantly impact the climate.

As detailed in his 2017 paper, Dr. Harde concludes the “anthropogenic contribution to the actual CO2 concentration is found to be 4.3% [a figure derived from IPCC AR5], its fraction to the CO2 increase over the Industrial Era is 15% and the average residence time 4 years.”

The IPCC overestimates the thermal effect of doubling CO2 by a factor of 5, as the consequent surface air temperature increase for a 120 ppm increase in CO2 is less than 0.3°C.

“Since only about 15% of the global CO2 increase is of anthropogenic origin, just 15% of 0.3°C, i.e., less than 0.05°C remains, which can be attributed to humans in the overall balance.”

“Changes of our climate can be traced back to natural interaction processes that exceed our human influence by orders of magnitude.”

Global Sea Surface Temperature Records Suggest Only Modest Warming In The 20th And 21st Centuries

by Dieng et al., 2017 in NoTricksZone


According to Dieng et al., 2017, global sea surface temperatures (SST) cooled slightly (-0.006°C/decade) from 2003 to 2013. This reduced the overall 1950-2014 warming rate to 0.059°C per decade.

Sea and land surface temperatures, ocean heat content, Earth’s
energy imbalance and net radiative forcing over the recent years.

The NCAR/HadCRUT4 global SST record from buoys and ARGO floats also show only modest warming in the last 3 decades. The natural 2015-’16 Super El Nino event is mostly responsible for the overall increasing rate.

AR6 Model Failure Affirmed: ‘No Model Group Succeeds Reproducing Observed Surface Warming Patterns’

by K. Richard, Apr 25, 2022 in NoTricksZone


A new study published in Geophysical Research Lettershighlights the abysmal model performance manifested in the latest Intergovernmental Panel on Climate Change report (AR6). The 38 CMIP6 general circulation models (GCMs) fail to adequately simulate even the most recent (1980-2021) warming patterns over 60 to 81% of the Earth’s surface.

Dr. Scafetta places particular emphasis on the poor performance of the highly uncertain estimates (somewhere between 1.83 and 5.67°C) of equilibrium climate sensitivity (ECS) and their data-model agreement relative to 1980-2021 global warming patterns.

The worst-performing ECS estimates are the ones projecting 3-4.5°C and 4.5-6°C warming in response to doubled CO2 concentrations (to 560 ppm) plus feedbacks, as the 1980-2021 temperature trends are nowhere close to aligning with these trajectories.

Instead, the projected global warming by 2050 (~2°C relative to 1750) associated with the lowest ECS estimates and implied by the warming observed over the last 40+ years is characterized as “unalarming” even with the most extreme greenhouse gas emissions (no mitigation efforts undertaken) growth rate.

In addition to the conclusion that “no model group succeeds reproducing observed surface warming patterns,” poor modeling of heat transfer physics, ocean and atmospheric circulation patterns, polar sea ice processes…is also evident in the latest IPCC report.

“Accurately reproducing regional temperature differences over the past 40+ years is beyond the capability of climate model simulations, and even fails for major ocean basins and continents.”

The fundamental modeling failures in simulating responses to sharply rising greenhouse gas emissions over the last 40+ years “calls into question model-based attribution of climate responses to anthropogenic forcing.”

Follow the Science: But Which Results? Using Same Tree Ring Dataset, 15 Groups Come Up With 15 Different Reconstructions

by P. Gosselin, Apr 19, 2022 in NoTricksZone


A 2021 study appearing in Nature Communications by Buentgen et al reports on the results of a double-blind experiment of 15 different groups that yielded 15 different Northern Hemisphere summer temperature reconstructions. Each group used the same network of regional tree-ring width datasets.

What’s fascinating is that ll groups, though using the same data network, came up with a different result. When it comes to deriving temperatures from tree-rings, it has much to do with individual approach and interpretation. Sure we can follow the science, but whose results?

The 15 groups (referred to as R1–R15) were challenged with the same task of developing the most reliable NH summer temperature reconstruction for the Common Era from nine high-elevation/high-latitude TRW datasets (Fig. 1):Cropped from Figure 1, Buentgen et al 

New Study: 90 Papers Were Published On The ‘Hiatus’ From 2009-2019. Now They Say It Never Happened.

by K. Richard, Apr 18, 2022 in NoTricksZone


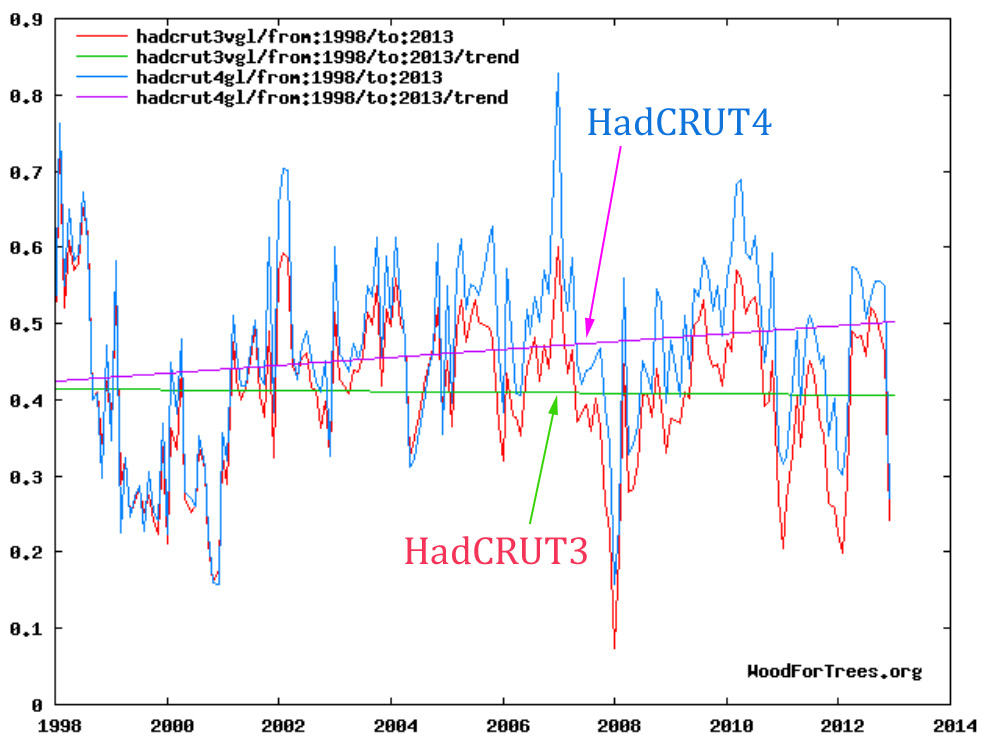
The claimed warming rate during the (1998-2001 to 2012-’13) “hiatus” ranged from -0.07°C to +0.17°C per decade.

In late 2012, the IPCC had an ongoing dilemma about what to do about the uncooperative global temperatures. The HadCRUT3 data set government bureaucrats had been using since the first report in 1990 actually showed the global mean surface temperatures had been declining since 1998. This was not going further the we-must-act-on-global-warming-now narrative, of course.

Enter Phil Jones, the global temperature data set overseer at East Anglia’s Climate Research Unit (CRUTEM). He’s the scientist who famously admitted that when the temperature data doesn’t exist, they are “mostly made up.”


Jones’s CRU and the Met Office (Hadley) then jointly constructed the newer HadCRUT4 version to help advance the narrative. This version changed the data just in time for the 5th IPCC assessment (AR5, 2013). The 1998-2001 temperatures  were allowed to stay the same, but an additional 0.1 to 0.2°C was tacked on to anomalies from 2002 onwards. The effect was to transform the 1998-2012 slight cooling in HadCRUT3 into a 0.04°C per decade−1 warming in HadCRUT4.

Image Source: woodfortrees.org