Archives par mot-clé : Global Temperature

The new Pause lengthens: now 7 years 6 months

by C. Monckton of Brenchley, Apr 3, 2022, in WUWT


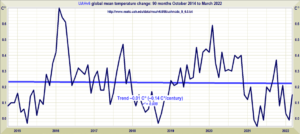
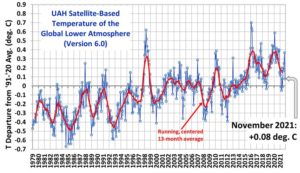
The new Pause has lengthened by another month. On the UAH satellite monthly global mean lower-troposphere temperature dataset, seven and a half years have passed since there was any trend in global warming at all. As always, if anyone has seen this surely not uninteresting fact mentioned in the Marxstream news media, let us know in comments. One of the best-kept secrets in what passes for “journalism” these days is that global temperature has not been rising steadily (or, since October 2014, at all). It has been rising in occasional spurts in response to natural events such as the great Pacific shift of 1976 and the subsequent strong el Niño events, rather than at the somewhat steadier rate that one might expect if our continuing – and continuous – sins of emission were the primary culprit.


UAH Global Temperature Update for March, 2022: +0.15 deg. C

by Dr R. Spencer, Apr 4, 2022 in WUWT


The Version 6.0 global average lower tropospheric temperature (LT) anomaly for March, 2022 was +0.15 deg. C, up from the February, 2022 value of -0.01 deg. C.

The linear warming trend since January, 1979 still stands at +0.13 C/decade (+0.12 C/decade over the global-averaged oceans, and +0.18 C/decade over global-averaged land).

Various regional LT departures from the 30-year (1991-2020) average for the last 15 months are:

YEAR MO GLOBE NHEM. SHEM. TROPIC USA48 ARCTIC AUST 
2021 01  0.12  0.34 -0.09 -0.08  0.36  0.49 -0.52
2021 02  0.20  0.32  0.08 -0.14 -0.66  0.07 -0.27
2021 03 -0.01  0.12 -0.14 -0.29  0.59 -0.78 -0.79
2021 04 -0.05  0.05 -0.15 -0.29 -0.02  0.02  0.29
2021 05  0.08  0.14  0.03  0.06 -0.41 -0.04  0.02
2021 06 -0.01  0.30 -0.32 -0.14  1.44  0.63 -0.76
2021 07  0.20  0.33  0.07  0.13  0.58  0.43  0.80
2021 08  0.17  0.26  0.08  0.07  0.32  0.83 -0.02
2021 09  0.25  0.18  0.33  0.09  0.67  0.02  0.37
2021 10  0.37  0.46  0.27  0.33  0.84  0.63  0.06
2021 11  0.08  0.11  0.06  0.14  0.50 -0.43 -0.29
2021 12  0.21  0.27  0.15  0.03  1.62  0.01 -0.06
2022 01  0.03  0.06  0.00 -0.24 -0.13  0.68  0.09
2022 02 -0.01  0.01 -0.02 -0.24 -0.05 -0.31 -0.50
2022 03  0.15  0.27  0.02 -0.08  0.21  0.74  0.02

The full UAH Global Temperature Report, along with the LT global gridpoint anomaly image for March, 2022 should be available within the next several days here.


Climate Past Far From Settled: 7 Major Temperature Reconstructions Find No Agreement

by P. Gosselin, Mar 29, 2022 in WUWT    


new paper published in open access publishing MDPI looks at seven prominent hemispheric and global temperature reconstructions for the past 2000 years (T2k).

The analysis conducted by the authors found that some reconstructions “differed from each other in some segments by more than 0.5 °C” whilst some show negligible pre-industrial climate variability (“hockey sticks”).

Those showing variability would suggest natural factors playing a greater role than those that claim climate had been rather constant over the past 2000 years.

Abstract: Global mean annual temperature has increased by more than 1 °C during the past 150 years, as documented by thermometer measurements. Such observational data are, unfortunately, not available for the pre-industrial period of the Common Era (CE), for which the climate development is reconstructed using various types of palaeoclimatological proxies. In this analysis, we compared seven prominent hemispheric and global temperature reconstructions for the past 2000 years (T2k) which differed from each other in some segments by more than 0.5 °C. Whilst some T2k show negligible pre-industrial climate variability (“hockey sticks”), others suggest significant temperature fluctuations. We discuss possible sources of error and highlight three criteria that need to be considered to increase the quality and stability of future T2k reconstructions. Temperature proxy series are to be thoroughly validated with regards to (1) reproducibility, (2) seasonal stability, and (3) areal representativeness. The T2k represents key calibration data for climate models. The models need to first reproduce the reconstructed pre-industrial climate history before being validated and cleared for climate projections of the future. Precise attribution of modern warming to anthropogenic and natural causes will not be possible until T2k composites stabilize and are truly representative for a well-defined region and season. The discrepancies between the different T2k reconstructions directly translate into a major challenge with regards to the political interpretation of the climate change risk profile. As a rule of thumb, the larger/smaller the pre-industrial temperature changes, the higher/lower the natural contribution to the current warm period (CWP) will likely be, thus, reducing/increasing the CO2 climate sensitivity and the expected warming until 2100.

Northern and Southern Hemisphere Warming

by A. May, Mar 18, 2022 in WUWT


As shown in Figure 1, the Hadley Climatic Research Unit HadCRUT5 temperature dataset suggests the Northern Hemisphere warmed 0.74°C (1.3° F) more than the Southern Hemisphere from 1979 through 2021. The UAH satellite temperature lower troposphere record is directionally similar but the difference between the hemispheres is much less, as shown in Figure 2. Both figures have identical vertical scales of 1.4°C. The UAH global satellite warming difference, from 1979 to 2021, between the hemispheres is about 0.2°C (0.4° F), less by more than a factor of 3.

Conclusions

The UAH and HadCRUT5 records both show the Northern Hemisphere warming more rapidly than the Southern, but the amount of extra warming in the HadCRUT5 record is anomalous. While the Southern Hemisphere satellite and surface rates are similar, the Northern Hemisphere rates are very different.

The global UAH lower troposphere and HadSST4 warming rates are both 0.14°C/decade from 1979 to 2020, the same to two decimals, as shown in my previous post. The oceans cover 70% of Earth’s surface and the HadSST4 dataset is used in combination with the CRUTEM5 land-surface temperature record to produce the curves in Figure 1. Given this, the large difference in Northern Hemisphere warming rates between Figures 1 and 2 is very hard to explain. Frankly, it suggests there is a problem with CRUTEM5. Figure 3 suggests the problem is getting worse in recent years, not better. This topic is discussed in more detail in my latest book: The Great Climate Change Debate: Karoly v Happer.

Satellite and Surface Temperatures

by A. May, Mar 15, 2022 in WUWT


In the Great Climate Change Debate between Professor David Karoly and Professor Will Happer, Glenn Tamblyn was called upon to finish the consensus side of the debate after Karoly backed out. The details are described in my latest book. The debate contained an illuminating exchange of opinions on satellite versus surface temperature measurements. This is Glenn Tamblyn’s opinion:

“Stitching together raw data from multiple satellites is very complex. Thus, the satellite datasets are much less accurate than the surface temperature datasets.

Professor Happer’s stronger emphasis on satellite temperature measurements does not agree with the experts on the subject.”

(Tamblyn, 2021b, pp. 7-8)

Satellites measure microwave radiation emitted from oxygen atoms in the atmosphere to estimate the “brightness” temperature, which can then be converted to an actual atmospheric temperature. No correlation to any other measurements is required. The measured brightness is compared to the brightness temperature of deep space (-455°F) and a target of known temperature within the satellite to compute the actual temperature in the atmosphere.[1]

Due to interference and clouds, this technique does not work close to the surface, so satellite atmospheric temperatures cannot be directly compared to surface measurements. The satellite measurements are best for measuring air temperatures in the mid-troposphere and the lower stratosphere.

The Hadley Centre has estimated that their best current estimate of global monthly average SST accuracy(sea surface temperature average uncertainty from 2000 to 2021) is about ±0.033°C and David Karoly supplied an estimate of ±0.1°C. This is a bit less accurate than the accuracy Roy Spencer and John Christy estimate for their satellite measurements of ±0.011°C for a monthly average.[1]

Sulfur emissions from consumption by developed and developing countries produce comparable climate impacts

by J. Lin et al., Feb 17, 2022 in Nature


Abstract

Regional consumption activities supported by domestic production and international trade have led to substantial aerosol-related emissions worldwide. Here we quantify sulfur dioxide emissions associated with consumption by developed and developing countries and assess the resulting climate impacts using an Earth system model. We find that although the consumption-associated emissions of developed countries are 40% less than those of developing countries, they lead to similar impacts on global mean surface air temperature and precipitation. This is because the effective radiative forcing induced per emission is greater for developed countries, which we attribute to the emissions being located at higher northern latitudes and being more evenly distributed zonally. Emissions from developing countries have a greater impact on temperature and precipitation over the tropical monsoon regions of China and India. Our results demonstrate the importance of trade and emission region in determining how consumption translates into global climate impact.

German Paper: “A Mild Additional Temperature Rise Of Around 1°K”… Drop Not Excluded By 2100!

by P. Gosselin, Mar 6, 2022 in NoTricksZone


In its most recent video, German site Die kalte Sonne here looks at a paper on CO2 climate forcing by Stefani 2021: Solar and Anthropogenic Influences on Climate: Regression Analysis and Tentative Predictions. The results point to only a moderately warming planet up to the year 2150.

To hype up climate warming alarm, IPCC scientists like to exaggerate CO2’s power to trap heat and warm up the atmosphere. But with every assessment report that the IPCC issues, the estimated value by which CO2 warms the planet steadily gets reduced as the observed warming keeps lagging behind what earlier models predicted.

In his paper, Frank Stefani and his team at the Helmholtz Center, Institute of Fluid Dynamics in Dresden, Germany looked at the impacts by CO2 and solar activity.

On average 1.1°C warming

Using double regression, the scientists evaluated linear combinations of the logarithm of the carbon dioxide concentration and the geomagnetic aa index as a proxy for solar activity. They reproduced the sea surface temperature (HadSST) since the middle of the 19th and ended up with a a climate sensitivity (of TCR type) in the range of 0.6 K until 1.6 K per doubling of CO2. The midpoint of this range is 1.1°C, a value many critical climate scientists have already estimated earlier, and thus far below the IPCC scary estimates.

The paper’s abstract elaborates further:

The Pause Lengthens Again: No Global Warming for 7 Years 5 Months

by C. Monckton of Brenchley, Mar 4, 2022 in WUWT


The drop from 0.03 K to 0.00 K from January to February 2022 in the UAH satellite monthly global mean lower-troposphere dataset has proven enough to lengthen the New Pause to 7 years 5 months, not that you will see this interesting fact anywhere in the Marxstream media

….

UAH Global Temperature Update for February 2022 Was 0.00 deg. C

by Roy Spencer, Mar 2, 2022 in ClimateChangeDispatch


The Version 6.0 global average lower tropospheric temperature (LT) anomaly for February 2022 was 0.00 deg. C, down a little from the January 2022 value of +0.03 deg. C.

The linear warming trend since January 1979 still stands at +0.13 C/decade (+0.12 C/decade over the global-averaged oceans, and +0.18 C/decade over global-averaged land).

Evaluation of the Homogenization Adjustments Applied to European Temperature Records in the Global Historical Climatology Network Dataset

by P. O’Neill et al., Feb 24, 2022 in MPDI


The widely used Global Historical Climatology Network (GHCN) monthly temperature dataset is available in two formats—non-homogenized and homogenized. Since 2011, this homogenized dataset has been updated almost daily by applying the “Pairwise Homogenization Algorithm” (PHA) to the non-homogenized datasets. Previous studies found that the PHA can perform well at correcting synthetic time series when certain artificial biases are introduced. However, its performance with real world data has been less well studied. Therefore, the homogenized GHCN datasets (Version 3 and 4) were downloaded almost daily over a 10-year period (2011–2021) yielding 3689 different updates to the datasets. The different breakpoints identified were analyzed for a set of stations from 24 European countries for which station history metadata were available. A remarkable inconsistency in the identified breakpoints (and hence adjustments applied) was revealed. Of the adjustments applied for GHCN Version 4, 64% (61% for Version 3) were identified on less than 25% of runs, while only 16% of the adjustments (21% for Version 3) were identified consistently for more than 75% of the runs. The consistency of PHA adjustments improved when the breakpoints corresponded to documented station history metadata events. However, only 19% of the breakpoints (18% for Version 3) were associated with a documented event within 1 year, and 67% (69% for Version 3) were not associated with any documented event. Therefore, while the PHA remains a useful tool in the community’s homogenization toolbox, many of the PHA adjustments applied to the homogenized GHCN dataset may have been spurious. Using station metadata to assess the reliability of PHA adjustments might potentially help to identify some of these spurious adjustments. View Full-Text
SEE ALSO HERE : WUWT
SEE ALSO HERE : CERES

New Study: In Northern Poland The Medieval Warm Period Was 3°C Warmer Than Today

by K. Richard, Feb 17,2022 in NoTricksZone


The temperature record for this region also shows today’s temperatures are not much different than they were during the Little Ice Age.

Another chart contained in the study (Pleskot et al., 2022) shows North America’s and Europe’s mean annual temperatures are nearly the lowest of the last 4,500 years.

Solar Update

by D. Archibald, Feb 2, 2022 in WentwothReport


Reports from the current Northern Hemisphere winter include plenty of low temperature records broken, frozen seas off Greece, etc., suggesting that the world is cooling. A correspondent in Missouri writes:

Nearly 800 chill hours here so far … cold forecast for the next 2 weeks. Will hit 1000 easily. The average when we moved here not quite 20 years ago was 5-600 … for the entire winter. (Chill hours refer to the total amount of time a fruit tree needs to be exposed to cold winter temperatures to allow them break dormancy so they will flower and set fruit normally.)

So that is good news for Missouri — they will now be able to grow things like peaches with a high chill hour requirement for fruiting. Confirmation of colder Northern Hemisphere winters is provided by the snow mass trend by the Finnish Meteorlogical Institute:

Another dot on the graphs (Part II)

by Gavin, Feb 2, 2020 in RealClimate


We have now updated the model-observations comparison page for the 2021 SAT and MSU TMT datasets. Mostly this is just ‘another dot on the graphs’ but we have made a couple of updates of note. First, we have updated the observational products to their latest versions (i.e. HadCRUT5, NOAA-STAR 4.1 etc.), though we are still using NOAA’s GlobalTemp v5 – the Interim version will be available later this year. Secondly, we have added a comparison of the observations to the new CMIP6 model ensemble.

As we’ve discussed previously, the CMIP6 ensemble contains a dozen models (out of ~50) with climate sensitivities that are outside the CMIP5 range, and beyond the very likely constraints from the observations. This suggests that comparisons to the observations should be weighted in some way. One reasonable option is to follow the work of Tokarska et al (2020) and others, and restrict the comparison to those models that have a transient climate response (TCR) that is consistent with observations. The likely range of TCR is 1.4ºC to 2.2ºC according to IPCC AR6, and so we plot both the mean and 95% spread over all all models (1 ensemble member per model) (grey) and the TCR-screened subset (pink).

CMIP6 model means and spreads since 1979 (reader friendly version).

….

Germany January Mean Temperatures Falling Since 1988, Contradicting Claims Of Warming

by NoTricksZone, Feb 2, 2022 in WUWT


According to the media and climate alarmists, winters like we used to have in the global cooling days of the 1970s were supposed to be disappearing due to increasing warming from rising CO2.

But that hasn’t really been happening. For example, Stefan Kämpfe at the European Institute for Climate and Energy (EIKE) plotted Germany’s mean January temperature going back to 1988:

Climate Alarmists Conceal Global Temperature Anomaly Measurement Declines Despite Increasing Atmospheric CO2

by L. Hamlin, Jan 17, 2022 in WUWT


OAA published its global climate report for year end 2021 highlighting that its global temperature anomaly measurements showed 2021 being the sixth highest of its recorded measurements. NOAA’s global annual measurement for 2021 was 0.84 degrees C.

NOAA chose to emphasize that the annual 2021 temperature anomaly was in the top ten of its recorded years as follows:

“The year culminated as the sixth warmest year on record for the globe with a temperature that was 0.84°C (1.51°F) above the 20th century average. The years 2013–2021 all rank among the ten warmest years on record.”

What NOAA failed to highlight was that the year-end 2021 global temperature anomaly measurement marked the continuing decline of its global temperature anomaly measurements that have now fallen for the last 6 years since peak year 2016 as shown in their graph below. These declining measurement outcomes make a complete mockery of recent climate alarmists scientifically unsupported politically contrived “climate emergency” propaganda claims.

Decembers 1961 & 1971

by P. Homewood, Jan 7, 2022 in NotaLotofPeopleKnowThat


December 1961 can be summed up in two words – cold and snow. The month was the 9th coldest on record since 1884.

The first week saw widespread snow and severe gales, whilst the Christmas week was one of the coldest of the century, with more heavy snow:

https://digital.nmla.metoffice.gov.uk/SO_7498a04d-6a40-4207-a27f-772663ffd2fc/

In this monthly lookback through the archives, two things are abundantly clear for every month we have checked:

1) Weather was every bit as extreme in the past

2) The weather can vary enormously from one year to another. This can not be better exemplified than the series for December, which has offered up very mild months to very cold ones, very dry ones to very wet, and very snowy ones to very little snow.

New Research: “CO2 Influence On Global Temperature Development Since1860 Only Half As Large As IPCC Estimate!

by  F. Vahrenholt, Dec 14, 2021 in NoTricksZone


On November 3, 2021, the renowned scientific journal Climate published a paper on solar influence on climate.

The paper by the renowned solar researcher Dr. Frank Stefani from the Helmholtz Zentrum Dresden-Rossendorf is entitled: “Solar and Anthropogenic Influences on Climate: A Regression Analysis and Tentative Predictions” and concludes that the influence of CO2 on the development of global temperatures from 1860 until today was only about half as large as the last report of the Intergovernmental Panel on Climate Change (IPCC) assumed.

As a reminder, the IPCC concludes that 98% of the warming ( 1.07 degrees out of 1.09 degrees) is human-induced. According to Stefani’s analysis, the solar influence accounts for 30-70%.

Stefani examined the course of the geomagnetic aa – index, which reflects the strength of the earth’s magnetic field. This index has been measured in Cambridge and Melbourne since 1844 and reflects the influence of solar activity. In earlier publications, Stefani had already been able to prove that the 11-year solar cycle is triggered by the gravitational forces of Venus, Earth and Jupiter, which are in orbital resonance every 11.07 years (here, here and here).

Since the Sun – influenced by all the planets (especially Jupiter and Saturn) – also moves around the center of gravity of the solar system, solar cycles arise that have become known in temperature history as the 193-year Suess-de Vries cycle and the 90-year Gleissberg cycle.

Physicists: Climate Model Error Overestimates CO2 Impact On Global Temps By Factor Of 5

by K. Richard, Nov 22, 2021 in NoTricksZone


A new study suggests CO2 molecules have little consequential impact affecting outgoing radiation, and that climate models attribute global temperature effects to CO2 that are fundamentally erroneous.

Russian physicists (Smirnov and Zhilyaev, 2021) have published a peer-reviewed paper in the Advances in Fundamental Physics Special Issue for the journal Foundations.

They assesses the role of CO2 molecules in the standard atmosphere and assert “we have a contradiction with the results of climatological models in the analysis of the Earth’s greenhouse effect.”

Key points from the paper include the following:

1. Climate model calculations of CO2’s impact on global temperatures are in error by a factor of 5 as a result of “ignoring, in climatological models, the Kirchhoff law” which says radiators are “simultaneously the absorbers.”

2. Change in the concentration of an optically active atmospheric component (like CO2) “would not lead to change in the outgoing radiative flux.”

3. CO2 molecules “are not the main radiator of the atmosphere.” Water vapor molecules are, and thus they “may be responsible for the observed heating of the Earth.”

New Study: Modelers Got Aerosols All Wrong…CO2 Climate Sensitivity Likely Another 0.4°C Overstated!

by P. Gosselin, Nov 26, 2021 in WUWT


Die kalte Sonne reports on a new aerosol study by Liu et al.

The results are a major blow to the high greenhouse-gas climate sensitivity modelers.

IPCC scientists have a favorite wild card they often use to explain serious model discrepancies: aerosols. Mysterious cooling events in the past are often explained away by aerosols from major volcanic eruptions, for example. They act to filter out sunlight.

ccording to IPCC climate models, the mean global temperature should have risen by 1.5°C since 1850 due to the higher CO2 concentrations. But best estimates show that it has instead risen by only 1.1°C. So what about the missing 0.4°C?

Naturally, the missing 0.4°C of warming since 1850 gets explained by the higher 20th century aerosol levels in the atmosphere – due to the burning of fossil fuels. Air pollution by man over the course of the late 19th century and entire 20th century are said to have dimmed the earth, and thus this explains the 0.4°C less warming.

Surprise: global aerosol emissions have been flat over past 250 years

But now results by a new study appearing in the journal Science Advances by Liu et al tells us that the forcing by aerosols had to have been overestimated by climate modelers. IPCC modelers insisted that 20th century aerosol concentrations were higher than during the pre-industrial times, and this is what kept the climate from warming by 1.5°C.

According to the scientists led by Liu, however, atmospheric aerosols in the preindustrial times were just as high as they were just recently. They were in fact more or less constant over the past 250 years. No change means it could not have been aerosols putting the brakes on temperature rise:

That’s a real embarrassment for the IPCC modelers. It means CO2 climate sensitivity has been overestimated.

September Mean Temps In Northern Europe See Little Change Over Past Decades…Snow, Frost Arrive

by P. Gosselin, Oct 17, 2021 in NoTricksZone


Today we look at September mean temperatures at the stations across northern Europe for which the Japan Meteorological Agency (JMA) have enough data. We find fall is not being pushed back as we should expect in a warming world.

The JMA has published the data for September and again we see a continuing warming hiatus.

First we look at the September trends from 6 stations in Ireland since 1991:


4 More New Reconstructions Affirm The Medieval Warm Period Was ‘Warmer Than Today’

by K. Richard, Oct 14, 2021 in NoTricksZone


From Russia to the Indian Ocean to Antarctica, surface temperatures were much warmer than  they are today during Medieval times.

1. The Eastern Russia region was 1.5°C warmer than now during the Medieval Warm Period. The modern warm-up began centuries ago and temperatures have declined in the last few centuries. Relative sea levels were 1 m higher than now 1,000 years ago.

Nazarova et al., 2021

….


2. Scientists use coral fossil evidence to suggest mean sea surface temperatures (SST) during the Medieval Climate Anomaly were “warmer than today”. At the two Indian Ocean study sites, there has been no obvious SST warming since 1982.

Yudawati Cahyarini et al., 2021

3. The modern (1994-2004) surface temperatures in the South China Sea are colder now than any time in the last 6000 years. Except for a brief interval ~500 years ago, SSTs have been consistently 2-4°C warmer than today since the middle Holocene.

Zhou et al., 2021

….

4. Modern sea ice extent for Antarctica’s Ross Sea is more extensive today (and temperatures cooler) than nearly any time in 6000 years.  It was warmer with less sea ice 1.6 to 0.7k years ago. Penguin numbers decline with cooling/increased sea ice.

Xu et al., 2021

“Climate Emergency” – Nothing But Politics And Propaganda Unsupported By Scientific Data

by  L. Hamlin, Oct 6, 2021 in WUWT


The “climate emergency” claim hyped by Scientific American and other political climate alarmist entities is based on the completely fallacious statement that “the planet is heating up way to fast” with that flawed claim representing nothing but politics and propaganda that is disproved by actually measured global temperature anomaly temperature measurements between 1988 and 2021 as well as being directly contradicted by the more than 5 year-long declining global temperature anomaly data presented by all 5 major global temperature anomaly measurement systems between 2016 and 2021.

CET 30-Year Averages

by P. Homewood, Sept 7, 2021 in NotaLotofPeopleKnowThat


The World Meteorological Organisation is clear about defining climate average:

image

It is disappointing then that the Met Office still continues to use the 1981-2010 period as its base. By doing this, of course, it exaggerates temperature increases in the UK.

If we look at the Central England Temperature mean temperatures, for example, we see that both winter and spring this year were colder than average, whilst summer was only 0.3C warmer:


….