Archives par mot-clé : Greenland

Newly discovered Greenland plume drives thermal activities in the Arctic

by Tohoku University, Dec 7, 2020 in ScienceDaily


A team of researchers understands more about the melting of the Greenland ice sheet. They discovered a flow of hot rocks, known as a mantle plume, rising from the core-mantle boundary beneath central Greenland that melts the ice from below.

The results of their two-part study were published in the Journal of Geophysical Research.

“Knowledge about the Greenland plume will bolster our understanding of volcanic activities in these regions and the problematic issue of global sea-level rising caused by the melting of the Greenland ice sheet,” said Dr. Genti Toyokuni, co-author of the studies.

The North Atlantic region is awash with geothermal activity. Iceland and Jan Mayen contain active volcanoes with their own distinct mantle plumes, whilst Svalbard — a Norwegian archipelago in the Arctic Ocean — is a geothermal area. However, the origin of these activities and their interconnectedness has largely been unexplored


Possible 1,000-kilometer-long river running deep below Greenland’s ice sheet

by  Hokkaido University, Nov 12, 2020 in EurekaAlert


Computational models suggest that melting water originating in the deep interior of Greenland could flow the entire length of a subglacial valley and exit at Petermann Fjord, along the northern coast of the island. Updating ice sheet models with this open valley could provide additional insight for future climate change predictions.
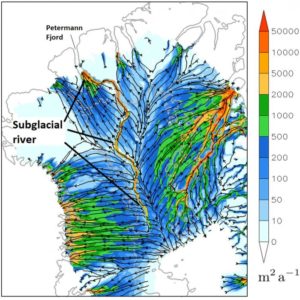
IMAGE: THE SUGGESTED VALLEY AND POSSIBLE RIVER FLOWING FROM THE DEEP INTERIOR OF GREENLAND TO PETERMANN FJORD DEEP BELOW GREENLAND’S ICE SHEET (500 METERS BELOW SEA LEVEL). (CHRISTOPHER CHAMBERS ET AL,… view more 

CREDIT: CHRISTOPHER CHAMBERS ET AL, THE CRYOSPHERE, NOVEMBER 12, 2020.

Radar surveys have previously mapped Greenland’s bedrock buried beneath two to three thousand meters of ice. Mathematical models were used to fill in the gaps in survey data and infer bedrock depths. The surveys revealed the long valley, but suggested it was segmented, preventing water from flowing freely through it. However, the peaks breaking the valley into segments only show up in areas where the mathematical modelling was used to fill in missing data, so could not be real.

Christopher Chambers and Ralf Greve, scientists at Hokkaido University’s Institute of Low Temperature Science, wanted to explore what might happen if the valley is open and melting increases at an area deep in Greenland’s interior known for melting. Collaborating with researchers at the University of Oslo, they ran numerous simulations to compare water dynamics in northern Greenland with and without valley segmentation.

The results, recently published in The Cryosphere, show a dramatic change in how water melting at the base of the ice sheet would flow, if the valley is indeed open. A distinct subglacial watercourse runs all the way from the melting site to Petermann Fjord, which is located more than 1,000 kilometers away on the northern coast of Greenland. The watercourse only appears when valley segmentation is removed; there are no other major changes to the landscape or water dynamics.

“The results are consistent with a long subglacial river,” Chambers says, “but considerable uncertainty remains. For example, we don’t know how much water, if any, is available to flow along the valley, and if it does indeed exit at Petermann Fjord or is refrozen, or escapes the valley, along the way.”

If water is flowing, the model suggests it could traverse the whole length of the valley because the valley is relatively flat, similar to a riverbed. This suggests no parts of the ice sheet form a physical blockade. The simulations also suggested that there was more water flow towards the fjord with a level valley base set at 500 meters below sea level than when set at 100 meters below. In addition, when melting is increased only in the deep interior at a known region of basal melting, the simulated discharge is increased down the entire length of the valley only when the valley is unblocked. This suggests that a quite finely tuned relationship between the valley form and overlying ice can allow a very long down-valley water pathway to develop.

“Additional radar surveys are needed to confirm the simulations are accurate,” says Greve, who has been developing the model used in the study, called Simulation Code for Polythermal Ice Sheets (SICOPOLIS). “This could introduce a fundamentally different hydrological system for the Greenland ice sheet. The correct simulation of such a long subglacial hydrological system could be important for accurate future ice sheet simulations under a changing climate.”

“Low-Fact Propaganda”: Spiegel’s Alarmism Exposed (Again), Greenland Ice Not “Doomed”

by P. Gosselin, August 16, 2020 in NoTricksZone


German skeptic site Die Kalte Sonne here debunks a recent alarmist article appearing in Spiegel aimed at shocking its readers. The reality, it turns out, is not shocking at all.

Greenland ice doomed?

According to Spiegel, the Greenland ice sheet is already doomed (that is unless we skip the usual democratic process and just act immediately).

Spiegel claims Greenland “glaciers are continuously losing huge masses of ice” and that the system there is “dramatically off balance”. The leftist Hamburg-based weekly reported:

The melting of the glaciers on Greenland has apparently passed the point of no return. Even if the global rise in temperature were to stop immediately, the ice sheet would continue to retreat, report researchers led by Michalea King of Ohio State University report in the journal “Communications Earth and Environment“.

Read more at Spiegel

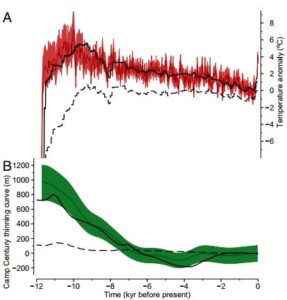
4°C warmer 11,000 years ago

But Die kalte Sonne wondered if this were really so, and needed only 2 mouse clicks to find a recent temperature reconstruction for Greenland’s past (Lecavalier et al. 2017, pdf here). The paper’s Figure 4a  shows the temperatures, with the temperature of 1950 at the far right which in paleo-climatology is always meant as “present”.

Thus, 11,000 years ago, it was up to 4°C warmer than in 1950 over long periods of thousands of years, and today the warming has been about 1°C since then. Since we can see an ice sheet of 2,850,000 km³ (that is roughly Gt) today, the “point of no return” cannot have been exceeded 10,000 years ago. How does the heading then come about? We take a look at the associated work by King et al. 2020:


What Happened To Greenland’s Tipping Point?

by P. Homewood, June 22, 2020 in NotaLotofPeopleKnowThat


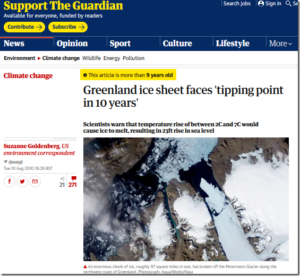
Ten years ago, the Guardian warned us that Greenland would have passed a tipping point by now, with the whole ice sheet due to disappear by the end of the century:

How did that work out then?

The article was written in 2010, which was the warmest on record. Since then, however, Greenland’s temperatures have returned to normal, and are no higher than they were in the 1930s.

Far from being the start of a new trend, 2010 was simply an outlier:


ASTONISHING, RECORD-BREAKING GAINS CONTINUE ACROSS THE GREENLAND ICE SHEET — MSM SILENT

by Cap Allon, June 11, 2020 in Electroverse


The month of June is breaking records across the Greenland ice sheet, and not records for warmth and melt –as the mainstream media have trained you to expect– but new benchmarks for COLD and GAINS.

The SMB gains occurring right now across Greenland are truly astonishing.

Data-driven FACTS reveal vast regions to the south have been GAINING RECORD/NEAR-RECORD LEVELS of snow & ice all month.

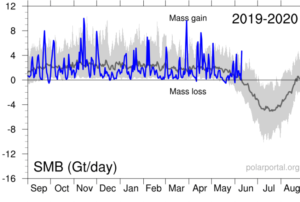
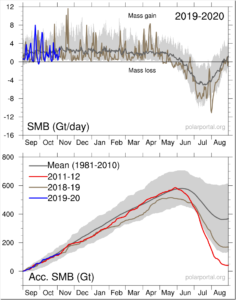
Never before in June has the Greenland ice sheet grown by more than 4 Gigatons in a single day (since 1981 when DMI records began), but now the past week has gone and delivered two such days — June 3, and now yesterday, June 10.

In fact, yesterday’s gains actually neared 5 Gts — you can see from the chart below how anomalous that gain is for the time of year:


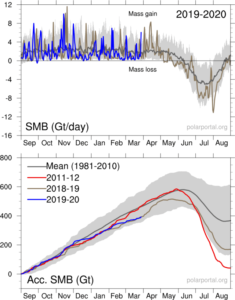
Blue line (Gt/day): total daily contribution to the SMB from the entire ice sheet. Grey line: mean value from 1981-2010 (DMI).

New Studies Show Cloud Cover Changes Have Driven Greenland Warming And Ice Melt Trends Since The 1990s

by K. Richard, April 20, 2020 in NoTricksZone


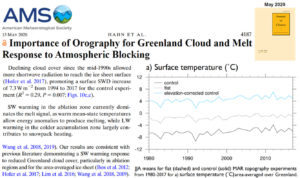
Scientists now acknowledge cloud cover changes “control the Earth’s hydrological cycle”, “regulate the Earth’s climate”, and “dominate the melt signal” for the Greenland ice sheet via modulation of absorbed shortwave radiation.  CO2 goes unmentioned as a contributing factor.


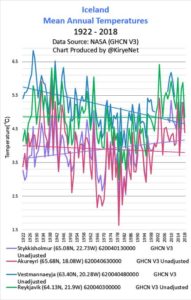
Is Greenland Warming, Melting? Hell No! NASA Data Show No Warming In Nearly 100 Years!

by Kirye & Gosselin, April 3, 2020 in NoTricksZone


But then NASA adjusted the V3 data and called it GHCN V4 “unadjusted”. The chart shown above in my tweet toggles between the prior V3 chart and the “unadjusted” V4. See the difference?

Note how the lack of warming has been removed and now the V4 data show modest warming. The missing heat was found – in the statistics! So in a sense, global warming has been “man-made” – done through statistical fudging and not human activity.

GREENLAND’S SMB GAINED 6 GIGATONS YESTERDAY + NORTHERN HEMISPHERE SNOW MASS SITTING AT 500 GIGAGTONS ABOVE THE NORM

by Cap Allon, March 29, 2020 in Electroverse


Despite decades of doom-and-gloom prophecies, Greenland’s Ice Sheet is currently GAINING monster amounts of “mass”— 6 gigatons yesterday alone (March 28, 2020).

Crucial to the survival of a glacier is its surface mass balance (SMB)–the difference between accumulation and ablation (sublimation and melting). Changes in mass balance control a glacier’s long-term behavior, and are its most sensitive climate indicators (wikipedia.org).

On the back of substantial SMB gains over the past few years, the Greenland ice sheet looks set to continue that trend in 2019-20. On March 28, 2020, the world’s largest island added a monster 6 gigatons to its ice sheet. According to climate alarmists, this simply shouldn’t be happening in a warming world. In fact, it might as well not be happening–developments like this NEVER receive MSM attention, meaning alarmists are NEVER privy to the full and unalarming picture…

polarportal.dk/

In addition, Total Snow Mass for the Northern Hemisphere continues to track WELL-above average with the latest data point (March 27) seeing NH snow at a staggering 500+ gigatons above the norm—another real-world reality we were told should be an impossibility by now: IPCC 2001: “Milder winter temperatures will decrease heavy snowstorms…”

Continuer la lecture de GREENLAND’S SMB GAINED 6 GIGATONS YESTERDAY + NORTHERN HEMISPHERE SNOW MASS SITTING AT 500 GIGAGTONS ABOVE THE NORM

Jan 2020: Coldest ever day in Greenland -65C comes, goes, no one notices

by JoNova, February 2020


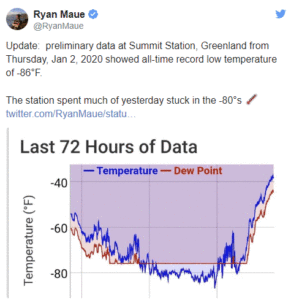
The coldest ever day recorded in Greenland stands at -63.3 C  (minus 81 F).  But on January 2nd in 2020, after Greenland suffered a century of global warming, the thermometer at Summit Camp sunk to at least -64.9C. I say, at least, because it may have been even colder. Sharp eyes of Cap Allon at Electroverse saw it hit minus 66C. Ryan Maue also saw it and predicted there would be cold as the Arctic Oscillation broke down.

I sought confirmation at the time (among the Bushfire days in Australia). I looked for any official tweet even, but couldn’t find any. How’s that work — a new all time record for a whole continent for any month of the year, and no one who was paid to care about these things even writes a paragraph?

Good for Paul Homewood, who wrote to the DMI (Danish Met Institute) and has now confirmed that the NOAA GeoSummit  records showed it got down to -64.9 C, an all time record.

The Insignificance of Greenland’s Ice Mass Loss in Five Easy Charts…

by David Middleton, February 5, 2020 in WUWT


This is a sort of a spin-off of Rutgers University Global Snow Lab and “the Snows of Yesteryear” and A Geological Perspective of the Greenland Ice Sheet. And, yes, there are a lot more than five charts in this post… And, none of them were all that easy.

Introduction

There is a general scientific consensus that the Greenland Ice Sheet (GrIS) has been losing ice mass since the Little Ice Age (LIA). This should come as no surprise, since the LIA was quite likely the coldest climatic episode of the Holocene Epoch. Although it does appear that the GrIS may have gained ice mass during the mid-20th century global cooling crisis.

According to Mouginot et al, 2019, the GrIS was gaining an average of +47 ± 21 Gt/y from 1972–1980, then began to lose ice mass after 1980:

  • -51 ± 17 Gt/y from 1980–1990

  • -41 ± 17 Gt/y from 1990–2000

  • -187 ± 17 Gt/y from 2000–2010

  • -286 ± 20 Gt/y from 2010–2018


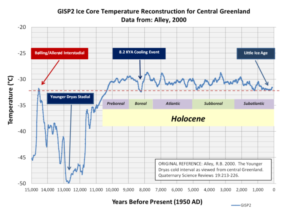
Figure 4. Central Greenland temperature reconstruction (Alley, 2000).

Major Greenland Glacier Is Growing

by NASA (Earth Observatory), June 6, 2019 in NASA.E.Observ.


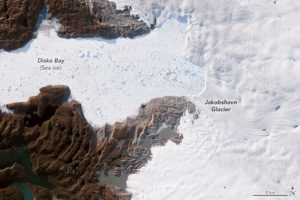
Jakobshavn Glacier in western Greenland is notorious for being the world’s fastest-moving glacier. It is also one of the most active, discharging a tremendous amount of ice from the Greenland Ice Sheet into Ilulissat Icefjord and adjacent Disko Bay—with implications for sea level rise. The image above, acquired on June 6, 2019, by the Operational Land Imager (OLI) on Landsat 8, shows a natural-color view of the glacier.

Jakobshavn has spent decades in retreat—that is, until scientists observed an unexpected advance between 2016 and 2017. In addition to growing toward the ocean, the glacier was found to be slowing and thickening. New data collected in March 2019 confirm that the glacier has grown for the third year in a row, and scientists attribute the change to cool ocean waters.

“The third straight year of thickening of Greenland’s biggest glacier supports our conclusion that the ocean is the culprit,” said Josh Willis, an ocean scientist at NASA’s Jet Propulsion Laboratory and principal investigator of the Oceans Melting Greenland (OMG) mission

Greenland Ice Core CO2 Concentrations Deserve Reconsideration

by Renee Hannon, January 7, 2020, in WUWT


Introduction
Ice cores datasets are important tools when reconstructing Earth’s paleoclimate. Antarctic ice core data are routinely used as proxies for past CO2 concentrations. This is because twenty years ago scientists theorized Greenland ice core CO2 data was unreliable since CO2trapped in air bubbles had potentially been altered by in-situ chemical reactions. As a result, Greenland CO2 datasets are not used in scientific studies to understand Northern and Southern hemispheres interactions and sensitivity of greenhouse gases under various climatic conditions.

This theory was put forward because Greenland CO2 data were more variable and different than Antarctic CO2 measurements located in the opposite polar region about 11,000 miles away. This article re-examines Greenland ice cores to see if they do indeed contain useful CO2 data. The theory of in-situ chemical reactions to explain a surplus and deficit of CO2, relative to Antarctic data, will be shown to be tenuous. The Greenland CO2 data demonstrates a response to the Medieval Warm Period, Little Ice Age, Dansgaard-Oeschger and other past climate change events. This response to past climate changes offers an improved explanation for why Greenland and Antarctic CO2 measurements differ. Further, Greenland CO2 measurements show rapid increases of 100 ppm during warm events in relatively short periods of time.

Atmospheric CO2 is More Variable in Northern Latitudes

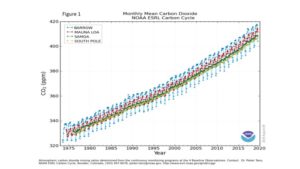
Figure 1, from NOAA, shows atmospheric CO2 concentrations measured from the continuous monitoring program at four key baseline stations spanning from the South Pole to Barrow, Alaska. CO2 has risen from about 330 ppm to over 400 ppm since 1975 and is increasing at approximately 1-2+ ppm/year. Many scientists believe that rapidly increasing CO2 is mostly due to fossil fuel emissions.

Figure 1. Atmospheric CO2 concentrations from NOAA

Failed Serial Doomcasting

by Willis Eschenbach, December 27, 2019 in WUWT


People sometimes ask me why I don’t believe the endless climate/energy use predictions of impending doom and gloom for the year 2050 or 2100. The reason is, neither the climate models nor the energy use models are worth a bucket of warm spit for such predictions. Folks concentrate a lot on the obvious problems with the climate models. But the energy models are just as bad, and the climate models totally depend on the energy models for estimating future emissions. However, consider the following US Energy Information Agency (EIA) predictions of energy use from 2010, quoted from here (emphasis mine):

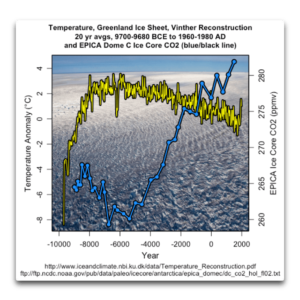
The only thing that seems clear about all of those questions is that the answer is not “CO2”. Here’s another look at Greenland, this time with CO2 overlaid on the temperature:

8000 Years Of Zero Correlation Between CO2 And Temperature, GISP 2 Ice Core Shows – Opposite Is True!

by P. Gosselin, December 20, 2019 in NoTricksZone


A plot of ice core data from Greenland reveals that CO2 does not drive temperatures.

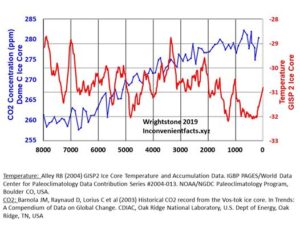
At Facebook, Gregory Wrightstone posted a chart plotting atmospheric CO2 concentration reconstructed from  Dome C Ice Core versus temperature that was reconstructed from the GISP 2 Ice Core.

According to global warming scientists, there’s supposed to be tandem movement between the two magnitudes.

CO2, they say, drives global temperature.

But over the past 8000 years, the data show that temperature in reality has moved in the opposite direction of CO2 and thus of what climate alarmist scientists have told us.


If anything can be drawn from the plotted data, it is that there’s an inverse correlation: As CO2 rises, temperature drops. But of course there’s a lot more to it. CO2 is not that huge major climate driver that alarmists like having us believe it is.

THE DANISH METEOROLOGICAL INSTITUTE ADMITS IT WRONGLY REPORTED GREENLAND’S “RECORD WARM TEMPERATURE” THIS SUMMER

by Cap Allon, November 17, 2019 in Electroverse


The Danish Meteorological Institute (DMI) admitted it wrongly reported Greenland’s record summer warmth, in what it called “good news from a climate perspective”…?

The DMI, a key player in monitoring Greenland’s climate, reported a “shocking” early-August temperature of between 2.7C (37F) and 4.7C (40.5F) at the Summit weather station, located some 3,202m above sea level at the center of the Greenland ice sheet.

This news quickly spread to every corner of the left-leaning web, like some nasty EOTW rash. But just a few days later the DMI posted a tweet retracting that record temp, saying that after a “closer look” (whatever that means exactly) it was revealed that the monitoring equipment had been giving “erroneous results”.

“Was there record-level warmth on the inland ice on Friday?” said the institute’s tweet dated Aug 08. “No! A quality check has confirmed out suspicion that the measurement was too high.”

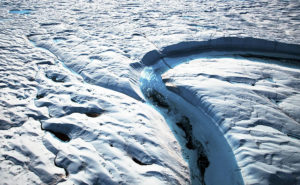
Blue Melt River, Petermann Glacier, in remote northwestern Greenland, on Nares Strait. (Photo by: Dave Walsh/VW Pics/Universal Images Group via Getty Images)

Deep Purple — future biological darkening of the Greenland Ice Sheet

by GFZ GeoForschungsZentrum Potsdam, Helmholtz Centre, October 12, 2019  in WUWT


Purple algae are making the western Greenland Ice Sheet melt faster, as the algae darken the ice surface and make it absorb more sunlight.


The ERC (European Research Council) has awarded an €11 million Euro Synergy grant called DEEP PURPLE to Liane G. Benning at the German Research Centre for Geosciences (GFZ) Potsdam, Germany, Alexandre Anesio at Aarhus University, Denmark and Martyn Tranter at University of Bristol, UK. Their common goal is to examine over the next six years (2020-2026) the role of glacier algae in progressively darkening the Greenland Ice Sheet surface in a warming climate.

The three researchers have already changed our understanding of why the ice darkens during the melt season by identifying the purple-pigmented ice algal blooms in the ice surface. These glacier algae are pigmented deep purple to shield their vital elements from the intense UV radiation in sunlight. During the melt season there are so many of these deep purple algae that they look as black as the soot from tundra fires. They form a dark band that has been progressively growing down the western side of the Greenland Ice Sheet during the summer melt season for the last 20 years, causing increased melting of the darkening ice.

Just why these glacier algae grow so densely is not really known at the moment, and neither is whether they will grow in the new melt zones on the ice sheet surface, to the north and to the ice sheet interior, as the climate continues to warm.

Project DEEP PURPLE

Questions such as this need answering if future sea level rise is to be predicted accurately, since Greenland melt is a major driver of current sea level rise.

Project DEEP PURPLE aims to answer these questions over the next six years, combining curisoity driven science about how the glacier algae grow and interact with their icy habitat, and societally relevant research into the processes that lead to ice surface darkening that are needed by ice melt modellers.

The scientists will work around many different sites in Greenland, making measurements of surface darkening, glacier algae density, how much soot and dust the algae trap on the surface and the physical properties of the melting ice surface to finally understand, how biological darkening occurs, and to predict where and when it will occur in the future.

New Study: Modern Arctic Sea Ice Cover Is Present MONTHS Longer Than Nearly All Of The Last 8000 Years

by Caron et al., 2019, 30 Sep. 2019 in NoTricksZone


A new reconstruction of Arctic (NW Greenland) sea ice cover (Caron et al., 2019) reveals modern day sea ice is present multiple months longer than almost any time in the last 8000 years…and today’s summer sea surface temperatures s are among the coldest of the Holocene.
Yet another new study (Caron et al., 2019) shows today’s Arctic sea ice cover is still quite extensive when compared to the last several thousand years, when CO2 concentrations ranged between 260 and 270 ppm.

Other new Arctic sea ice reconstructions from the north of Iceland (Harning et al., 2019) and Barents Sea (Berben et al., 2019) regions indicate a) modern sea ice extent has changed very little in the last several hundred years, or since the Little Ice Age, and b) the Early Holocene had millennial-scale periods of sea-ice-free and open water conditions, which is in stark contrast to “modern conditions” – the “highest value” or furthest extent of the sea ice record.

[T]he PBIP25 values [proxy for sea ice presence] reach their highest value (0.87) of the record at ca. 0 cal yr BP. An increase in PBIP25 suggests a further extension in sea ice cover, reflecting Arctic Front conditions (Müller et al., 2011), most similar to modern conditions.” (Berben et al., 2019)


What Greenland Heatwave?

by P. Homewood, September 1, 2019 in NotaLotofPeopleKnowThat


Let’s start with Qaanaaq (Thule), which the Mirror reporter visited during w/e 25th August. She wrote:


A heatwave is gripping The Arctic, melting away Greenland’s ice sheet on an unprecedented scale and threatening a global rise in sea levels – an urgent reminder of the climate crisis we are now all facing.

Kids splashing each other in the sea and locals wearing t-shirts were unheard of here in August 10 years ago.

But now, alongside teenage girls wearing skirts to school and increasing mosquitoes, it is a common occurrence for the residents of Qaanaaq, in north-west Greenland, one of the world’s most northerly cities situated 700 miles north of the Arctic Circle.

This is the frontline of climate change…..

The country is also experiencing record-breaking temperatures. In mid-June, along the eastern coast it was 9C warmer than the 1981-2010 average.

Just as western Europe has baked in a heatwave with record temperatures at the end of July, the hot air moved as far north as Greenland with the gauge hitting 22C on August 1. The average high is around 7C….


According to Weather Underground, however, daily maximum temperatures at Qaanaaq never got above 47F that week. The highest temperature of the month was 63F on the 1st.

KNMI confirm that the record temperature at Qaanaaq is 67F, and that a temperature of 63F was also recorded way back in 1959.

Greenland Meltdown Hoax

by P. Homewood, August 29, 2019 in NotaLotofPeopleKnowThat


You will recall those ridiculous stories about Greenland heatwaves and ice sheet meltdown, which were circulating just a couple of weeks ago :

As I pointed out at the time, they were simply not true. And, now the actual data bears this out.

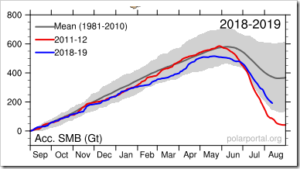
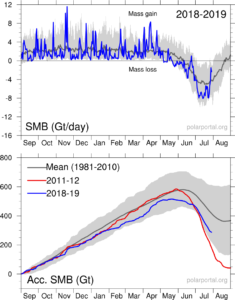
The Surface Mass Balance (SMB) of the ice sheet, while below average is still well above that of 2012, and also within the historical range.. Most of the shortfall this year is because of dry weather during the winter, hence lack of snow.

[The light grey band shows differences from year to year. For any calendar day, the band shows the range over the 30 years (in the period 1981-2010), however with the lowest and highest values for each day omitted. ]

http://polarportal.dk/en/greenland/surface-conditions/

Analysis: What’s Really Going On In Greenland

by C. Martz, August 12, 2019 in ClimateChangeDispatch


As I’m sure many of my readers are aware, Europe has been having an odd summer as far as temperatures are concerned. The continent has had two major heatwaves this summer; one was in June and the other was in July.

In addition, Greenland has also seen some exceptional “warmth” and lots of ice melt this summer as compared to more recent years.

So, what’s going on? Is climate change to blame? Or, is this a freak of nature?

As with most complicated things in science, the truth is somewhere in between and is not just one way or the other. I hate saying that as a “black and white” person, but it’s an unfortunate fact. One can not make a preconceived notion based on one weather event without looking at a.) the big picture, b.) mechanism, and c.) long-term trends.

The upper air pattern over Europe and Greenland is opposite of what’s been occurring in much of the United States. The U.S. has only had one major heatwave this year, and that in and of itself caused mass hysteria.

Greenland’s ‘Record Temperature’ denied – the data was wrong

by Anthony Watts, August 12, 2019 in WUWT


From the “But, but, wait! Our algorithms can adjust for that!” department comes this tale of alarmist woe. Greenland’s all-time record temperature wasn’t a record at all, and it never got above freezing there.


First, the wailing from news media:

NYT: https://www.nytimes.com/2019/08/02/climate/european-heatwave-climate-change.html

WAPO: https://www.washingtonpost.com/news/capital-weather-gang/wp/2016/06/10/greenland-witnessed-its-highest-june-temperature-ever-recorded-on-thursday/

Climate Progress: https://thinkprogress.org/greenland-hits-record-75-f-sets-melt-record-as-globe-aims-at-hottest-year-e34e534e533e/

Polar Portal: http://polarportal.dk/en/news/news/record-high-temperature-for-june-in-greenland/


Now from the Danish Meteorological Institute (DMI), via the news website The Local, the cooler reality:

For Most Of The Last 10,000 Years, Greenland Ice Sheet and Glacier Volume Was Smaller Than Today

by K. Richard, August 5, 2019 in NoTricksZone


A new paper (Axford et al., 2019) reveals NW Greenland’s “outlet glaciers were smaller than today from ~9.4 to 0.2 ka BP” (9,400 to 200 years before 1950), and that “most of the land-based margin reached its maximum Holocene extent in the last millennium and likely the last few hundred years.”

The authors conclude:

“We infer based upon lake sediment organic and biogenic content that in response to declining temperatures, North Ice Cap reached its present-day size ~1850 AD, having been smaller than present through most of the preceding Holocene.”

Furthermore, the authors assert Greenland was 2.5°C to 3°C warmer than modern on average during the Holocene Thermal Maximum, and peak temperatures were 4°C to 7°C warmer.


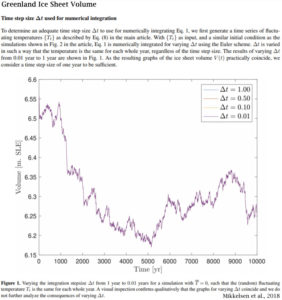
Image Source: Mikkelson et al., 2018

Greenland Ice sheet Meltdown Scare–Except It’s Not True

by P.  Homewood,  August 1, 2019 in NotaLotofPeopleKnowThat


The same heat dome that roasted Europe and broke national temperature records in five countries last week has shifted to Greenland, where it is causing one of the biggest melt events ever observed on the fragile ice sheet.

By some measures, the ice melt is more extreme than during a benchmark record event in July 2012, according to scientists analyzing the latest data. During that event, about 98 percent of the ice sheet experienced some surface melting, speeding up the process of shedding ice into the ocean.

The fate of Greenland’s ice sheet is of critical importance to every coastal resident in the world, since Greenland is already the biggest contributor to modern-day sea level rise. The pace and extent of Greenland ice melt will help determine how high sea levels climb and how quickly….

The Danish Meteorological Institute tweeted that more than half the ice sheet experienced some degree of melting on Tuesday, according to a computer model simulation, which made it the “highest this year by some distance.”

And there is no mention of the fact that the ice sheet grew substantially last year, and also the year before:

The simple fact is that the Greenland ice sheet melts every summer, particularly when the sun shines. That’s what it does. And it grows back again in winter as the snow falls. Indeed, if it did not melt, it would carry on growing year after year.

Inevitably there are some days when the weather is warmer and sunnier than normal, and others when it is colder. To pick an odd day or two is ridiculous and dishonest scaremongering.

See also here and here

Fake “Heatwave for Greenland” Claims

by P. Homewood, July 30, 2019 in NotaLotofPeopleKnowThat


And that Greenland ice? The Surface Mass Balance has been well below normal throughout the winter, because of the dry weather. The rate of summer melt, however, has been pretty much normal, contrary to the fake claims of Ms Nullis.

With only a couple of weeks of melt left, it seems extremely unlikely that, even with the sunshine forecast, that the ice will dip below the 2012 figure (which incidentally is only a “record low” since records began in 1981).

http://polarportal.dk/en/greenland/surface-conditions/