
by P. Homewood, September 1, 2019 in NotaLotofPeopleKnowThat
Let’s start with Qaanaaq (Thule), which the Mirror reporter visited during w/e 25th August. She wrote:
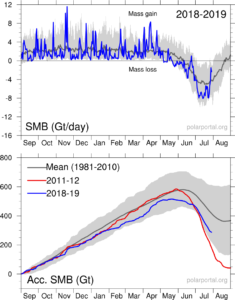
A heatwave is gripping The Arctic, melting away Greenland’s ice sheet on an unprecedented scale and threatening a global rise in sea levels – an urgent reminder of the climate crisis we are now all facing.
Kids splashing each other in the sea and locals wearing t-shirts were unheard of here in August 10 years ago.
But now, alongside teenage girls wearing skirts to school and increasing mosquitoes, it is a common occurrence for the residents of Qaanaaq, in north-west Greenland, one of the world’s most northerly cities situated 700 miles north of the Arctic Circle.
This is the frontline of climate change…..
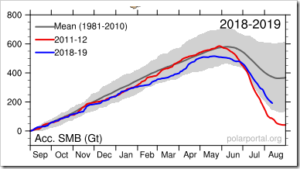
The country is also experiencing record-breaking temperatures. In mid-June, along the eastern coast it was 9C warmer than the 1981-2010 average.
Just as western Europe has baked in a heatwave with record temperatures at the end of July, the hot air moved as far north as Greenland with the gauge hitting 22C on August 1. The average high is around 7C….
According to Weather Underground, however, daily maximum temperatures at Qaanaaq never got above 47F that week. The highest temperature of the month was 63F on the 1st.
KNMI confirm that the record temperature at Qaanaaq is 67F, and that a temperature of 63F was also recorded way back in 1959.
…

