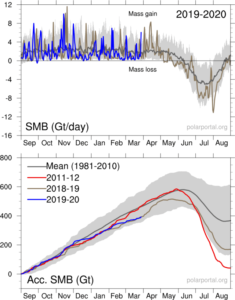
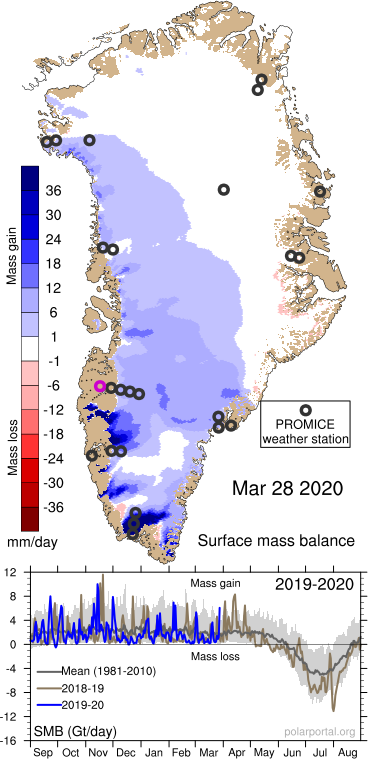
Despite decades of doom-and-gloom prophecies, Greenland’s Ice Sheet is currently GAINING monster amounts of “mass”— 6 gigatons yesterday alone (March 28, 2020).
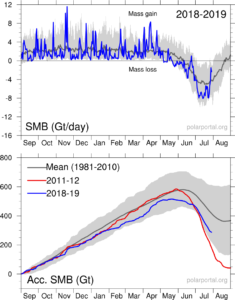
Crucial to the survival of a glacier is its surface mass balance (SMB)–the difference between accumulation and ablation (sublimation and melting). Changes in mass balance control a glacier’s long-term behavior, and are its most sensitive climate indicators (wikipedia.org).
On the back of substantial SMB gains over the past few years, the Greenland ice sheet looks set to continue that trend in 2019-20. On March 28, 2020, the world’s largest island added a monster 6 gigatons to its ice sheet. According to climate alarmists, this simply shouldn’t be happening in a warming world. In fact, it might as well not be happening–developments like this NEVER receive MSM attention, meaning alarmists are NEVER privy to the full and unalarming picture…
In addition, Total Snow Mass for the Northern Hemisphere continues to track WELL-above average with the latest data point (March 27) seeing NH snow at a staggering 500+ gigatons above the norm—another real-world reality we were told should be an impossibility by now: IPCC 2001: “Milder winter temperatures will decrease heavy snowstorms…”
by P. Homewood, March 3, 2020 in NotaLotofPeopleKnowThat
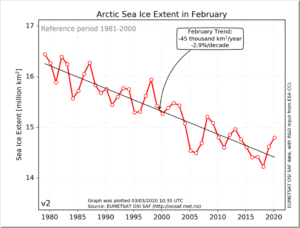
Arctic sea ice extent continues to run well ahead of the last few years, as it has done for most of this year so far, and continues to grow at a time of year when it normally begins to stabilise and recede.
Average extent in February was the highest since 2013, and stands greater than 2005 and 2006:
Greenland’s largest glacier (Jakobshavn) has quite abruptly thickened since 2016. The thickening has been so profound the ice elevations are nearly back to 2010-2011 levels. The nearby ocean has cooled ~1.5°C – a return to 1980s-era temperatures.
The world’s glaciers have not been following along with the CO2-driven catastrophic melting narrative.
Alaska
For example, in a study of 50 Alaskan glaciers for the warming period between 1972-2012, researchers (McNabb and Hock, 2014) found there was
“…no corresponding change in the number of glaciers retreating nor do we see corresponding acceleration of retreat rates. To the contrary, many glaciers in the region have advanced…”
by S. Crockford, February 14, 2020 in PolarbearScience
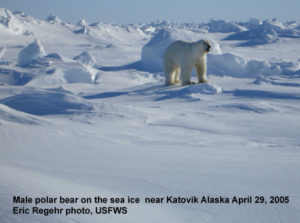
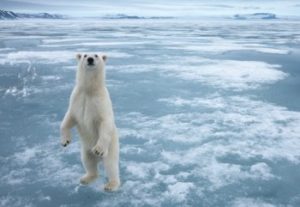
Arctic sea ice at the middle of winter (January-March) is a measure of what’s to come because winter ice is the set-up for early spring, the time when polar bears do most of their feeding on young seals.
[Mid-winter photos of polar bears are hard to come by, partly because the Arctic is still dark for most hours of the day, it’s still bitterly cold, and scientists don’t venture out to do work on polar bears until the end of March at the earliest]
At 12 February this year, the ice was similar in overall extent to 2013 but higher than 2006.
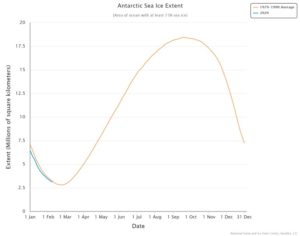
According to official government data from the National Snow & Ice Data Center (NSIDC), Antarctic Sea Ice Extent is currently tracking the 1979-1990 average:
In addition, Jan 2020’s extent exceeded that of 2019, 2018, 2017, 2016, 2011, 2007, 2006, 2005, 2000, 1997, 1993, 1992, 1988, 1985, 1984, 1981, and 1980.
NO CORRELATION BETWEEN CO2 AND SEA ICE EXTENT
Since 1979 — the year sea ice satellite measurements began — CO2 readings taken at the Mauna Loa Observatory in Hawaii have been on an unnaturally linear rise. While, during the same period, Antarctic Sea Ice Extent has been “extremely variable” with “the yearly minimum hitting both record highs and lows” — NOAA (climate.gov)…
Scientists (Syring et al., 2020) find almost sea ice-free conditions pervaded a much warmer northern Greenland region during the Early Holocene. Arctic sea ice extent has “continuously” grown for ~4800 years, with modern conditions a bit lower than the peak of the last few centuries.
In a new paper (Syring et al., 2020), scientists rely on biomarker evidence – (a) the presence of warmth-demanding species Armeria scabra and Mytilus edulis, and (b) IP25, a proxy for the presence or absence of sea ice – to suggest not only were there much warmer (4 to 5°C) northern Greenland temperatures 10,000 to 8500 years ago, but effectively sea ice-free conditions pervaded the region during this time.
The sea ice in the region has been growing “continuously” for the last 4800 years, reaching its peak during the last millennium.
The authors also find decadal- and centennial-scale periodicities in solar activity have coincided with variability in Arctic sea ice (IP25) throughout the Holocene.
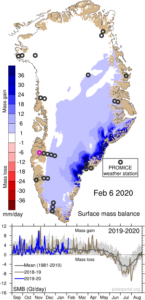
Despite decades of doom-and-gloom prophecies, Greenland’s Ice Sheet is currently GAINING monster amounts of “mass”— 7 gigatons yesterday alone (Feb. 06, 2020).
Crucial to the survival of a glacier is its surface mass balance (SMB)–the difference between accumulation and ablation (sublimation and melting). Changes in mass balance control a glacier’s long-term behavior, and are its most sensitive climate indicators (wikipedia.org).
On the back of substantial SMB gains over the past few years, the Greenland ice sheet looks set to continue that trend in 2019-20. On February 06, 2020, the world’s largest island added a monster 7 gigatons to its ice sheet. According to climate alarmists, this simply shouldn’t be happening in a warming world. In fact, it might as well not be happening–developments like this NEVER receive MSM attention, meaning alarmists are NEVER privy to the full and unalarming picture…
The ice in Antarctica, how is it doing? Is it melting, is it growing? In the following we wishto present the latest literature on the subject. There is a lot to report.
Fasten your seat belt, there’s a lot to cover.
Let’s start with the temperature development because along with snowfall, this is the most important control factor for Antarctic inland ice.
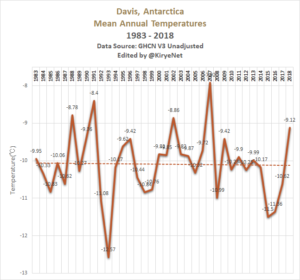
At NoTricksZone, Kirye shows ten coastal stations of Antarctica. None have been warming over the past 10 years. An example follows:
And here’s the temperature development of the entire Antarctic according to UAH and RSS satellite measurements (from Climate4You, via NoTricksZone):
A new mapping effort revealed critical new details of Antarctica’s hidden land.
A new map of the mountains, valleys and canyons hidden under Antarctica‘s ice has revealed the deepest land on Earth, and will help forecast future ice loss.
The frozen southern continent can look pretty flat and featureless from above. But beneath the ice pack that’s accumulated over the eons, there’s an ancient continent, as textured as any other. And that texture turns out to be very important for predicting how and when ice will flow and which regions of ice are most vulnerable in a warming world. The new NASA map, called BedMachine Antarctica, mixes ice movement measurements, seismic measurements, radar and other data points to create the most detailed picture yet of Antarctica’s hidden features.
“Using BedMachine to zoom into particular sectors of Antarctica, you find essential details, such as bumps and hollows beneath the ice that may accelerate, slow down or even stop the retreat of glaciers,” Mathieu Morlighem, an Earth system scientist at the University of California, Irvine and the lead author of a new paper about the map, said in a statement.
The new map, published Dec. 12 in the journal Nature Geoscience, reveals previously unknown topographical features that shape ice flow on the frozen continent.
The previously unknown features have “major implications for glacier response to climate change,” the authors wrote. “For example, glaciers flowing across the Transantarctic Mountains are protected by broad, stabilizing ridges.”
An Antarctic field campaign last winter led by the US and Australia has successfully extracted some of the largest samples of air dating from the 1870s until today. Researchers will use the samples to look for changes in the molecules that scrub the atmosphere of methane and other gases.
…
“It’s probably the most extreme atmospheric chemistry you can do from ice core samples, and the logistics were also extreme,” said Peter Neff, a postdoctoral researcher with dual appointments at the UW and at the University of Rochester.
But the months the team spent camped on the ice at the snowy Law Dome site paid off.
“This is, to my knowledge, the largest air sample from the 1870s that anyone’s ever gotten,” Neff said. His 10 weeks camped on the ice included minus-20 degrees Fahrenheit temperatures and several snowstorms, some of which he shared from Antarctica via Twitter.
Air from deeper ice cores drilled in Antarctica and Greenland has provided a record of carbon dioxide and methane, two greenhouse gases, going back thousands of years. While carbon dioxide has a lifetime of decades to centuries, an even more potent gas, methane, has a lifetime of just nine or 10 years.
by P. Homewood, Nov. 6, 2019 in NotaLotofPeopleKnowThat
…
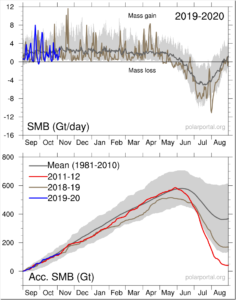
I may not have a fancy art qualification to replicate their info chart, but here is what a proper Greenland factsheet should include:
1) Mass gains and losses of 12bn tonnes a day are not unusual. Over the year, the ice sheet grows by about 600bn tonnes in winter, and loses a similar amount in summer:
by Michaels, P.J., October 22, 2019 in ClimateChangeDispatch
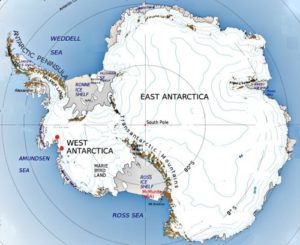
The West Antarctic Ice Sheet is growing, but I bet you didn’t read about it in the news. Nor would you probably be able to find it if you entered “West Antarctic Ice Sheet Growing” in a Google search.
That search would likely uncover one 2015 publication by NASA’s Jay Zwally in the Journal of Glaciology using actual weather data that showed increasing snowfall, primarily over East Antarctica, was adding a small amount of ice.
That report generated a flurry of coverage, but of course in the current era of public shaming of any deviation from the apocalyptic orthodoxy, you don’t hear much about it anymore.
Which may explain why you have heard nothing about this new publication which has been accepted in Journal of Geophysical Research-Atmospheres but isn’t in print yet:
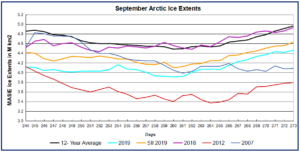
MASIE daily results for September show 2019 early melting followed by an early stabilizing and refreezing.
Note that 2019 started the month about 800k km2 below the 12 year average (2007 through 2018 inclusive). There was little additional loss of ice, a rise then a dip below 4 M km2, and a sharp rise ending the month. Interestingly, 2019 matched the lowest year 2012 at the start, but ended the month well ahead of both 2012 and 2007.
The table for day 273 shows distribution of ice across the regions making up the Arctic ocean.
A new reconstruction of Arctic (NW Greenland) sea ice cover (Caron et al., 2019) reveals modern day sea ice is present multiple months longer than almost any time in the last 8000 years…and today’s summer sea surface temperatures s are among the coldest of the Holocene.
Yet another new study (Caron et al., 2019) shows today’s Arctic sea ice cover is still quite extensive when compared to the last several thousand years, when CO2 concentrations ranged between 260 and 270 ppm.
…
Other new Arctic sea ice reconstructions from the north of Iceland (Harning et al., 2019) and Barents Sea (Berben et al., 2019) regions indicate a) modern sea ice extent has changed very little in the last several hundred years, or since the Little Ice Age, and b) the Early Holocene had millennial-scale periods of sea-ice-free and open water conditions, which is in stark contrast to “modern conditions” – the “highest value” or furthest extent of the sea ice record.
“[T]he PBIP25 values [proxy for sea ice presence] reach their highest value (0.87) of the record at ca. 0 cal yr BP. An increase in PBIP25 suggests a further extension in sea ice cover, reflecting Arctic Front conditions (Müller et al., 2011), most similar to modern conditions.” (Berben et al., 2019)
A new paper (Axford et al., 2019) reveals NW Greenland’s “outlet glaciers were smaller than today from ~9.4 to 0.2 ka BP” (9,400 to 200 years before 1950), and that “most of the land-based margin reached its maximum Holocene extent in the last millennium and likely the last few hundred years.”
The authors conclude:
“We infer based upon lake sediment organic and biogenic content that in response to declining temperatures, North Ice Cap reached its present-day size ~1850 AD, having been smaller than present through most of the preceding Holocene.”
Furthermore, the authors assert Greenland was 2.5°C to 3°C warmer than modern on average during the Holocene Thermal Maximum, and peak temperatures were 4°C to 7°C warmer.
by P. Homewood, July 30, 2019 in NotaLotofPeopleKnowThat
…
And that Greenland ice? The Surface Mass Balance has been well below normal throughout the winter, because of the dry weather. The rate of summer melt, however, has been pretty much normal, contrary to the fake claims of Ms Nullis.
With only a couple of weeks of melt left, it seems extremely unlikely that, even with the sunshine forecast, that the ice will dip below the 2012 figure (which incidentally is only a “record low” since records began in 1981).
by S.J. Crockford, July29, 2019 in ClimateChangeDispatch
In late June, one of the most powerful icebreakers in the world encountered such extraordinarily thick ice on-route to the North Pole (with a polar bear specialist and deep-pocketed, Attenborough-class tourists onboard) that it took a day and a half longer than expected to get there.
A few weeks later, in mid-July, a Norwegian icebreaker also bound for the North Pole (with scientific researchers onboard) was forced to turn back north of Svalbard when it unexpectedly encountered impenetrable pack ice.
Apparently, the ice charts the Norwegian captain consulted showed ‘first-year ice‘ – ice that formed the previous fall, defined as less than 2 m thick (6.6 ft) – which is often much broken up by early summer.
However, what he and his Russian colleague came up against was consolidated first-year pack ice up to 3 m thick (about 10 ft). Such thick first-year ice was not just unexpected but by definition, should have been impossible.
Ice charts for the last few years that estimate actual ice thickness (rather than age) show ice >2 m thick east and/or just north of Svalbard and around the North Pole are not unusual at this time of year.
This suggests that the propensity of navigational charts to use ice ‘age’ (e.g. first-year vs. multi-year) to describe ice conditions could explain the Norwegian captain getting caught off-guard by exceptionally thick first-year ice.
Greenland’s more than 860,000 square miles are largely covered with ice and glaciers, and its melting fuels as much as one-third of the sea level rise in Florida. That’s why a team of University of South Florida geoscientists’ new discovery of one of the mechanisms that allows Greenland’s glaciers to collapse into the sea has special significance for the Sunshine State.
New radar technology allowed geoscientists to look at Greenland’s dynamic ice-ocean interface that drives sea level rise.
…
Earlier this spring, NASA scientists reported Jakobshavn Glacier, which has been Greenland’s fastest -thinning glacier for the last 20 years, was slowing in its movement toward the ocean in what appears to be a cyclical pattern of warming and cooling. But because Jakobshavn is still giving up more ice than it accumulates each year, its sheer size makes it an important factor in sea level rise, the NASA scientists maintain.
“Our study helps understand the calving process,” Dixon said. “We are the first to discover that mélange isn’t just some random pile of icebergs in front of the glacier. A mélange wedge can occasionally ‘hold the door’ and keep the glacier from calving.”
Journal Reference:
Surui Xie, Timothy H. Dixon, David M. Holland, Denis Voytenko, Irena Vaňkov�. Rapid iceberg calving following removal of tightly packed pro-glacial mélange. Nature Communications, 2019; 10 (1) DOI: 10.1038/s41467-019-10908-4
Our German skeptic friend Snowfan here keeps us up to date on the latest ODEN “Ship of Fools” attempt to travel across an Arctic that is supposed to be ice-free by now.
The incentive to cross the Arctic passages in the summer is huge. Doing so would mean at least a week of fame with the media blaring out your name along with grossly hyped headlines of an Arctic ice meltdown due to global warming. One of these years, a ship might get lucky and manage to get through the Northwest Passage.
…
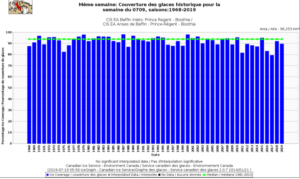
Also defying the models is the extent of ice cover for July 9 at the Baffin inlets Regent – Boothia. Over the last 50 years, there’s been little trend change:
Warming temperatures and changes in ocean circulation and salinity are driving the breakup of ice sheets in Antarctica, but a new study suggests that intense storms may help push the system over the edge.
A research team led by U.S. and Korean scientists deployed three moorings with hydrophones attached seaward of the Nansen Ice Shelf in Antarctica’s Ross Sea in December of 2015, and were able to record hundreds of short-duration, broadband signals indicating the fracturing of the ice shelf.
The “icequakes” primarily took place between January and March of 2016, with the front of the ice sheet calving into two giant icebergs on April 7. The day the icebergs drifted away from the shelf coincided with the largest low-pressure storm system the region had recorded in the previous seven months, the researchers say.
Results of the study are being published this week in Frontiers in Earth Science.
…
Journal Reference:
R. P. Dziak, W. S. Lee, J. H. Haxel, H. Matsumoto, G. Tepp, T.-K. Lau, L. Roche, S. Yun, C.-K. Lee, J. Lee, S.-T. Yoon. Hydroacoustic, Meteorologic and Seismic Observations of the 2016 Nansen Ice Shelf Calving Event and Iceberg Formation. Frontiers in Earth Science, 2019; 7 DOI: 10.3389/feart.2019.00183
Contributed by Claire L. Parkinson, May 24, 2019 (sent for review April 16, 2019; reviewed by Will Hobbs and Douglas G. Martinson)
Significance
A newly completed 40-y record of satellite observations is used to quantify changes in Antarctic sea ice coverage since the late 1970s. Sea ice spreads over vast areas and has major impacts on the rest of the climate system, reflecting solar radiation and restricting ocean/atmosphere exchanges. The satellite record reveals that a gradual, decades-long overall increase in Antarctic sea ice extents reversed in 2014, with subsequent rates of decrease in 2014–2017 far exceeding the more widely publicized decay rates experienced in the Arctic. The rapid decreases reduced the Antarctic sea ice extents to their lowest values in the 40-y record, both on a yearly average basis (record low in 2017) and on a monthly basis (record low in February 2017).
Abstract
Following over 3 decades of gradual but uneven increases in sea ice coverage, the yearly average Antarctic sea ice extents reached a record high of 12.8 × 10⁶ km2 in 2014, followed by a decline so precipitous that they reached their lowest value in the 40-y 1979–2018 satellite multichannel passive-microwave record, 10.7 × 10⁶ km2, in 2017. In contrast, it took the Arctic sea ice cover a full 3 decades to register a loss that great in yearly average ice extents. Still, when considering the 40-y record as a whole, the Antarctic sea ice continues to have a positive overall trend in yearly average ice extents, although at 11,300 ± 5,300 km2⋅y−1, this trend is only 50% of the trend for 1979–2014, before the precipitous decline. Four of the 5 sectors into which the Antarctic sea ice cover is divided all also have 40-y positive trends that are well reduced from their 2014–2017 values. The one anomalous sector in this regard, the Bellingshausen/Amundsen Seas, has a 40-y negative trend, with the yearly average ice extents decreasing overall in the first 3 decades, reaching a minimum in 2007, and exhibiting an overall upward trend since 2007 (i.e., reflecting a reversal in the opposite direction from the other 4 sectors and the Antarctic sea ice cover as a whole).
…
Fig. 1. Identification of the 5 sectors used in the regional analyses. These are identical to the sectors used in previous studies (7, 8).
by Adam Vaughan, July 3, 2019 in ClimateChangeDispatch
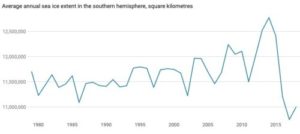
Decades of expanding sea ice in Antarctica have been wiped out by three years of sudden and dramatic declines, leaving scientist puzzled as to why the region has flipped so abruptly.
A new satellite analysis reveals that between 2014 and 2017 sea ice extent in the southern hemisphere suffered unprecedented annual decreases, leaving the area covered by sea ice at its lowest point in 40 years.
The declines were so big that they outstripped the losses in the fast-melting Arctic over the same period.
“It’s very surprising. We just haven’t seen decreases like that in either hemisphere,” says Claire Parkinson at NASA’s Goddard Space Flight Center, who undertook the analysis.
However, researchers cautioned against pinning the changes on climate change and said it was too early to say if the shrinking is the start of a long-term trend or a blip.
After growing for decades, Antarctic sea ice extent declined at an unprecedented rate between 2014 and 2017.
by J.E. Kamis, May 25, 2016 in ClimateChangeDispatch
The most plausible scenario for southern Greenland’s surface ice melt is related to geologically induced heat flow and not atmospheric warming for various, well-established reasons. Based on research by the National Oceanic and Atmospheric Administration (NOAA) (see here), the top surface of southern Greenland’s ice sheet is currently melting at a high rate and therefore greatly reducing surface ice volume. They attribute this geographically localized melting effect to an unusually persistent and man-made atmospheric high pressure system (a so-called “Omega Block“) that has remained stationary above southern Greenland during the spring of 2016.
This non-moving high-pressure system has trapped a cell of very warm air above southern Greenland resulting in higher-than-normal surface ice melting rates and volumes. NOAA and the mainstream media are portraying this above-average melting as undeniable proof man-made global warming damaging our planet.
This portrayal is vastly misleading.
That’s because southern Greenland’s surface ice melt is more likely caused by natural, geologically induced heat flow from one of Earth’s largest Deep Ocean crustal plate junctures, the 10,000 mile long Mid-Atlantic Ridge (MAR). The Mid-Atlantic Ridge is “an immensely long mountain chain extending for about 10,000 miles (16,000 km) in a curving path from the Arctic Ocean to near the southern tip of Africa. The ridge is equidistant between the continents on either side of it. The mountains forming the ridge reach a width of 1,000 miles.”
…
La géologie, une science plus que passionnante … et diverse
