Archives par mot-clé : Ice

Basic Science: 4 Keys to Melt Fears About Ice Sheets Melting

by William Ward, April 18, 2019 in WUWT


The world is drowning in articles about catastrophic sea level rise (SLR), reminding us that if the ice sheets melt, 260 feet of water will flood our coastal cities. We know that sea level today is 20-30 feet lower than it was at the end of the last interglacial period 120,000 years ago. We also know that sea level has risen 430 feet since the end of the last glacial maximum 22,000 years ago. Research shows this rise was not monotonic but oscillatory, and during periods over the past 10,000 years, sea level has been several meters higher than today. So, evidence supports the possibility of higher sea levels, but does the evidence support the possibility of catastrophic sea level rise from rapidly melting ice?

In this paper, basic science is used to show that catastrophic SLR from melting ice cannot happen naturally over a short period. Additionally, humankind does not possess the capability to melt a large amount of ice quickly even through our most advanced technology. This news should relieve the public, which is routinely deceived by reporting that misrepresents the facts. The public is susceptible to unnecessary alarmism when melt rates and ice-melt masses are presented without perspective and juxtaposed against claims that scientists are worried. This paper uses the same facts but places them in perspective to show that catastrophic risks do not exist.

The big Arctic Sea-Ice shift of 2007: Ice refuses to melt

by Javier, April 23, 2019 in WUWT


I have maintained since 2015 that in the 2006-2007 season the Arctic underwent a cyclical phase shift, and the rapid sea-ice melting observed over the previous decades ended. A few scientists predicted or explained this shift based on their study of multi-decadal oscillations (see bibliography). They were ignored by mainstream climatology and the press because the “anthropogenic” melting of the Arctic is one of the main selling points of the climate scare. See for example:

Year after year the data supports my view over the desperate scaremongers like Tamino. With the passing of time it is more and more difficult to defend the idea that Arctic melting is continuing, so alarmists keep changing the metric. First it was September sea-ice extent (SIE), then September sea-ice volume, and now annual average SIE. However, the reference measurements are September minimum SIE and March maximum SIE.

This article is more than a biannual update on the Arctic ice situation, as I will focus specifically on showing evidence for the trend change that took place in 2007. As 12 years have passed since the shift, the best way is to compare the 2007-2019 period with the previous 1994-2006 period of equal length to display the striking differences between both periods.

Figure 1. Changes in September SIE for both periods as a percentage change over the first year of the period.

Arctic Ice Gain Embarrasses Global Warming Scientists. 40-Year Meteorologist: “Don’t Be Surprised Over What Happens Next 10 -15 Years!

by P. Gosselin, April 21, 2019 in NoTricksZone


Yesterday I wrote here how some scientists misrepresent the observed data concerning Greenland ice melt in order to get the alarming results they want. There we see that Greenland has been melting, but recently much more slowly than what we are often led to believe.

Looking at the latest Greenland ice volume data from the Danish Meteorological Institute (DMI), we see that currently the ice volume is below normal, but well within the range of the past 17 years:

Data source: Danish Meteorological Institute. Chart by Kirye.

Also Tony Heller at Real Science here plotted Arctic ice volume for the past 12 years in succession. Here’s how all the media-claimed rapid Arctic melting really looks

CO2’s Influence Was 0.006 W/m² Per Decade During The Last Deglaciation. And This Melted Ice Sheets How?

by K. Richard, April 18, 2019 in NoTricksZone


According to the calculations of Dr. James Hansen, the radiative influence derived from the increase in CO2 during the last deglaciation was so negligible that it equated to “a third of energy required to power a honey bee in flight” (Ellis and Palmer, 2016).


Image Source: Ellis and Palmer, 2016

We now know how insects and bacteria control ice

by University of Utah, April 14, 2019 in WUWT


Proteins help organisms form or inhibit ice crystals

Contrary to what you may have been taught, water doesn’t always freeze to ice at 32 degrees F (zero degrees C). Knowing, or controlling, at what temperature water will freeze (starting with a process called nucleation) is critically important to answering questions such as whether or not there will be enough snow on the ski slopes or whether or not it will rain tomorrow.

Nature has come up with ways to control the formation of ice, though, and in a paper published today in the Journal of the American Chemical Society University of Utah professor Valeria Molinero and her colleagues show how key proteins produced in bacteria and insects can either promote or inhibit the formation of ice, based on their length and their ability to team up to form large ice-binding surfaces. The results have wide application, particularly in understanding precipitation in clouds.

“We’re now able to predict the temperature at which the bacterium is going to nucleate ice depending on how many ice-nucleating proteins it has,” Molinero says, “and we’re able to predict the temperature at which the antifreeze proteins, which are very small and typically don’t work at very low temperatures, can nucleate ice.”
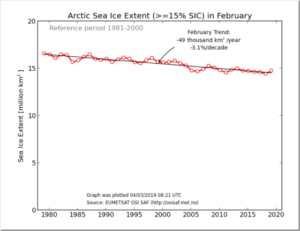
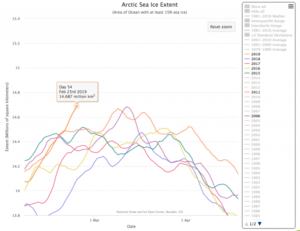
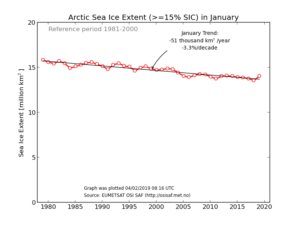
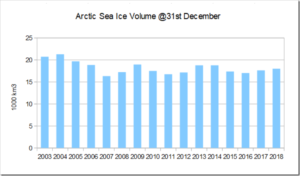
Less Ice In Arctic Ocean 6000-7000 Years Ago

by Geological Survey of Norway, October 20, 2008 in ScienceDaily


Recent mapping of a number of raised beach ridges on the north coast of Greenland suggests that the ice cover in the Arctic Ocean was greatly reduced some 6000-7000 years ago. The Arctic Ocean may have been periodically ice free.

”The climate in the northern regions has never been milder since the last Ice Age than it was about 6000-7000 years ago. We still don’t know whether the Arctic Ocean was completely ice free, but there was more open water in the area north of Greenland than there is today,” says Astrid Lyså, a geologist and researcher at the Geological Survey of Norway (NGU).

Inconvenient: NASA says a Greenland glacier did an about-face – growing again

by Anthony Watts, March 25, 2019 in WUWT


“…scientists were so shocked to find the change.”

From NASA JPL: Cold Water Currently Slowing Fastest Thinning Greenland Glacier

NASA research shows that Jakobshavn Glacier, which has been Greenland’s fastest-flowing and fastest-thinning glacier for the last 20 years, has made an unexpected about-face. Jakobshavn is now flowing more slowly, thickening, and advancing toward the ocean instead of retreating farther inland. The glacier is still adding to global sea level rise – it continues to lose more ice to the ocean than it gains from snow accumulation – but at a slower rate.

The researchers conclude that the slowdown of this glacier, known in the Greenlandic language as Sermeq Kujalleq, occurred because an ocean current that brings water to the glacier’s ocean face grew much cooler in 2016. Water temperatures in the vicinity of the glacier are now colder than they have been since the mid-1980s.

See also here in NBS

GREENLAND ICE SHEET SIXTH HIGHEST ON RECORD

by GWPF, December 7, 2019


In 2018, Greenland’s total  surface mass budget (SMB) is almost 150bn tonnes above the average for 1981-2010, ranking as sixth highest on record.


The Danish Meteorological Institute (DMI) also performs daily simulations of how much ice or water the Ice Sheet loses or accumulates. Based on these simulations, an overall assessment of how the surface mass balance develops across the entire Ice Sheet is obtained (Fig. 4).

At the end of the 2018 season (31 August 2018), the net surface mass balance was 517 Gt, which means that 517 Gt more snow fell than the quantity of snow and ice that melted and ran out into the sea.

Greenland’s Glaciers Expanding Again

by P. Homewood, March 11, 2019 in NotaLotofPeopleKnowThat


As I reported last  September, Greenland’s ice sheet mass balance had grown at close to record levels for the second year running.

To clarify again, the mass balance calculation accounts for:

1) Snowfall

2) Ice melt

3) Ablation


In other words, it does not include calving.

http://www.dmi.dk/en/groenland/maalinger/greenland-ice-sheet-surface-mass-budget/#

..

Arctic Sea Ice Extent Same As In 2005

by P. Homewood, March 5, 2019 in NotaLotofPeopleKnowThat


You may wonder why you have not heard much about Arctic sea ice death spirals and Greenland heatwaves this winter.

Hardly surprising, because the Arctic stubbornly refuses to follow the agenda.

Average sea ice extent last month was the highest since 2013, and stands as high as it did in 2005.

http://ocean.dmi.dk/arctic/icecover_30y.uk.php

Strong Arctic sea-ice growth this year

by Andy May / Javier, February 24, 2019 in WUWT


February is not over, and Arctic sea-ice extent is already over half a million square kilometers higher than last year at this day.

The growing season has not ended, and 2019 Arctic sea-ice extent is already higher than the previous four years and six out of the last 14 years.

Figure 1. Arctic sea-ice extent. Note the left edge of the graph is February 1, not January 1.  http://nsidc.org/arcticseaicenews/charctic-interactive-sea-ice-graph/

Arctic sea-ice has stubbornly resisted the very warm years between 2015-2017 caused by the big El Niño. Are we going to see an increase in Arctic sea-ice over the next few years? Only time will tell, but the idea cannot be discarded.

Novel hypothesis goes underground to predict future of Greenland ice sheet

by Penn State, February 2,  2019 in ScienceDaily


Paleoclimatic records indicate that most of Greenland was ice-free within the last 1.1 million years even though temperatures then were not much warmer than conditions today. To explain this, the researchers point to there being more heat beneath the ice sheet in the past than today.

Data show that when the Iceland hot spot — the heat source that feeds volcanoes on Iceland — passed under north-central Greenland 80 to 35 million years ago, it left molten rock deep underground but did not break through the upper mantle and crust to form volcanoes as it had in the west and east. The Earth’s climate then was too warm for Greenland to have an ice sheet, but once it cooled the ice sheet formed, growing and shrinking successive with ice ages.

Antarctic Losing Tiny Amounts Of Ice (Or Maybe It’s Gaining Ice, NASA Is Not Sure!)

by P. Homewood, January 15, 2019 in NotaLotofPeopleKnowThat


Antarctica is shedding ice at a staggering rate.

Scientists have discovered global warming has caused the melting of the ice on the continent to increase sixfold since 1979.

This phenomenal rate of melting has seen global sea levels rise by more than half an inch – and experts predict it will get worse. 

Scientists have predicted a ‘multi-meter sea level rise from Antarctica in the coming centuries’ as a result of the vast loss of ice.

Researchers discovered that, between 1970 and 1990, the continent was shedding an average of 40 gigatons of ice mass annually.

This jumped to an average of 252 gigatons a year between 2009 and 2017.

https://www.dailymail.co.uk/sciencetech/article-6590841/Antarctica-losing-SIX-TIMES-ice-year-1970s.html#newcomment


You may of course recall that it was only three years ago that the same NASA, who are behind this latest scare story, were telling us that the ice cap was actually growing in Antarctica. But more of that in a minute.

There are several aspects to this latest story that need closer examination.

Arctic Sea Ice Extent Higher Than 2006 Last Month

by P. Homewood, January 9, 2019 in NotaLotofPeopleKnowThat


Just last March, the Guardian was trying to panic us about record lows in Arctic sea ice during last winter.

Back in the real world, DMI confirm that average Arctic sea ice extent in December was higher last month than in 2006. In reality, there has been very little change at all since 2005.

http://ocean.dmi.dk/arctic/icethickness/txt/IceVol.txt


“Terrifying Sea-Level Prediction Now Looks Far Less Likely”… But “marine ice-cliff instability” is “just common sense”

by David Middleton, January 5, 2019 in WUWT


Marine ice cliff instability (MICI) “has not been observed, not at such a scale,” “might simply be a product of running a computer model of ice physics at a too-low resolution,” ignores post glacial rebound, couldn’t occur before ” until 2250 or 2300″… Yet “the idea is cinematic,” “it’s just common sense that Antarctic glaciers will develop problematic ice cliffs” and something we should plan for…

“Our results support growing evidence that calving glaciers are particularly sensitive to climate change.”  Greenland’s climate is always changing… Always has and always will change… And the climate changes observed over the last few decades are not unprecedented. The Greenland ice sheet is no more disappearing this year than it was last year and it is physically impossible for the ice sheet to “collapse” into the ocean.

Figure 6. Jakobshavn Isbrae. (Wikipedia and Google Earth)

Late Summer Arctic Ice Volume Has Been Growing Since 2007…Contradicts Earlier Climate Predictions

by Kirye, December 12, 2018 in NoTricksZone


The media, alarmist scientists and many leading policymakers often tell the public “the Arctic is rapidly melting”. And if a poll were done today, a vast majority of the people in Japan and elsewhere would say this is true. Unfortunately they have become the victims of “fake news”.

Luckily we have some hard data from the Arctic. And if one looks at them, it is true that sea ice has seen a declining trend – if we go back 40 years.

Yet, if we look at the past 12 years, we see that the trend for minimum has stopped, and one could argue even reversed:

Record Cold Hits North America, Arctic Sea Ice Stable As Solar Activity Reaches Near 200-Year Low

by P. Gosselin, November 26, 2018 in NoTricksZone


Winter has arrived much earlier than normal this year, particularly across North America, where cold records have been shattered.

This Thanksgiving is in fact going down as one of the coldest ever on record across the Northeast. The Washington Post here, for example, reports that Thanksgiving and Black Friday 2018 will be remembered for a record-shattering cold snap across the Northeast United States.”

Arctic sea ice, snow and ice cover rebound

Arctic sea ice volume has rebounded and is near normal levels. The sea ice trend has remained stable over the past decade and thus defy all the climate alarmist predictions of an Arctic meltdown.


Chart made by Kirye. Data Source: Danish Meteorological Institute.


Carottes de glace, CO2 et micro-organismes

by Paul Berth, 22 novembre 2018, in ScienceClimatEnergie


Les microbulles de gaz emprisonnées dans les carottes de glace sont fréquemment utilisées pour estimer le taux de CO2 de l’atmosphère du passé. Il s’agit de méthodes de mesure indirectes. Par exemple la carotte de glace EPICA Dome C en Antarctique nous suggère que le CO2 de l’atmosphère a varié entre 180 et 300 ppmv pendant les derniers 650 000 ans (Brook 2005). Cependant, le taux de CO2 observé dans ces carottes de glace représente-il vraiment l’atmosphère du passé? Nous allons montrer ici qu’un paramètre est souvent négligé par les glaciologues, et que ce paramètre pourrait avoir un effet considérable sur le résultat des analyses : il s’agit de la présence de micro-organismes dans la glace et les microbulles.

Arctic sea ice: Simulation versus observation

by U.  of California – Santa Barbara, Nov 13, 2018 in ScienceDaily


As an indicator of the impacts of climate change, Arctic sea ice is hard to beat. Scientists have observed the frozen polar ocean advance and retreat at this most sensitive region of the Earth over decades for insight on the potential ripple effects on assorted natural systems: global ocean circulation, surrounding habitats and ecosystems, food sources, sea levels and more.

“We’re mostly interested in the period from the early 2000s to the present day, where we see such strong melting,” said graduate student Ian Baxter, who also works with Ding. It’s known, he added, that the effects of changes in the Arctic are no longer confined to the region and in fact spread to the mid-latitudes — often in the form of cold weather outbreaks. The group is interested in how effects in the tropics could spread beyond that region and affect the Arctic.

How the Greenland ice sheet fared in 2018

by R. Mottram et al.  (DMI), October 27, 2018 in ScienceNordic


The end of August traditionally marks the end of the melt season for the Greenland ice sheet as it shifts from mostly melting to mostly gaining snow.

As usual, this is the time when the scientists at DMI and our partners in the Polar Portal assess the state of the ice sheet after a year of snowfall and ice melt. Using daily output from a weather forecasting model combined with a model that calculates melt of snow and ice, we calculate the “surface mass budget” (SMB) of the ice sheet.

This budget takes into account the balance between snow that is added to the ice sheet and melting snow and glacier ice that runs off into the ocean. The ice sheet also loses ice by the breaking off, or “calving”, of icebergs from its edge, but that is not included in this type of budget. As a result, the SMB will always be positive – that is, the ice sheet gains more snow than the ice it loses.

For this year, we calculated a total SMB of 517bn tonnes, which is almost 150bn tonnes above the average for 1981-2010, ranking just behind the 2016-17 season as sixth highest on record.

By contrast, the lowest SMB in the record was 2011-2012 with just 38bn tonnes, which shows how variable SMB can be from one year to another.

Maps show the difference between the annual SMB in 2017 (left) and 2018 (right) compared with the 1981-2010 period (in mm of ice melt). Blue shows more ice gain than average and red shows more ice loss than average. (Credit: DMI Polar Portal)