From the AGU and the “but, but, the continent is melting!” department.
COLDEST PLACE ON EARTH IS COLDER THAN SCIENTISTS THOUGHT
WASHINGTON — Tiny valleys near the top of Antarctica’s ice sheet reach temperatures of nearly minus 100 degrees Celsius (minus 148 degrees Fahrenheit) in the winter, a new study finds. The results could change scientists’ understanding of just how low temperatures can get at Earth’s surface, according to the researchers.
Scientists announced in 2013 they had found the lowest temperatures on Earth’s surface: Sensors on several Earth-observing satellites measured temperatures of minus 93 degrees Celsius (minus 135 degrees Fahrenheit) in several spots on the East Antarctic Plateau, a high snowy plateau in central Antarctica that encompasses the South Pole. But the researchers revised that initial study with new data and found the temperatures actually reach minus 98 degrees Celsius (minus 144 degrees Fahrenheit) during the southern polar night, mostly during July and August.
The Arctic and North Atlantic have suddenly turned surprisingly cold. First, according to Weatherbell meteorologist Joe Bastardi, the northern Atlantic has turned cold; so cold in fact that Bastardi called it “impressive”: …
All the Atlantic cold could have a big (positive) impact on the upcoming hurricane season, says hurricane expert Philip Klotzbach. One week ago Klotzbach tweeted …
From ARS Technica, one of the most incoherent things I’ve ever read…
…
The shocking thing is that Howard Lee has a degree in geology. The fact that he makes his living as an “Earth Science writer” and not as a geologist might just be relevant.
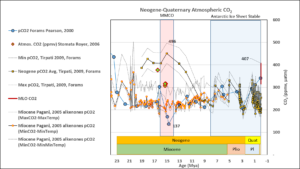
Can the Miocene tell our future? I’ll let Bubba’s mom answer that question:
A new paper about to be in press, comes at the end of a flurry of papers and reports published this week that claims Antarctica was losing ice mass. Zwally says ice growth is anywhere from 50 gigatons to 200 gigatons a year. NASA glaciologist Jay Zwally says his new study will show, once again, the eastern Antarctic ice sheet is gaining enough ice to offset losses in the west.
The new paper has zero mentions of the word. But other scientists have published plenty of papers describing how the West Antarctic zone is being warmed from below by 1200 degrees of magma. According to scientist Dustin Schroeder and co, it is as if the Thwaites Glacier in West Antarctic is sitting on a “stovetop burner”.[1]His words. Thwaites Glacier,, smack in the middle of the warming is being melted from below by geothermal heat. Then there is the large blob of superheated rock 60 miles below West Antarctica. The researchers use the phrase “like a blow-torch”…. Capping it off, only last year 91 new volcanoes were discovered 2km underneath the West Antarctic Rift. That’s new, as in, we didn’t know they were there.
Follow the reasoning, either a trace gas 10 kilometers up is causing some spots of Antarctica to warm and other parts to cool, or hot magma at 1,200C is. What’s more likely?
Water, H2O, determines the ‘General Background Temperature’ for the Earth, resulting in Hothouse and Ice House Climate States. During geological periods the movement of continents changes the position of
continents, oceans and seas. Because of the different configurations, a dominant warm or a dominant cold deep-water production configuration ‘sets’ average temperatures for the deep oceans. Changing vertical oceanic circulation changes surface temperatures, especially in the higher latitudes. During a Hot House State, higher temperatures in the high latitudes result in a high water-vapor concentration that prevents a rapid loss of thermal energy by the Earth.
These three processes, plate tectonics (continental drift), vertical oceanic circulation variability and variations in atmospheric water vapor concentration and distribution, caused previous Hot House and Warm House Climate States. A change in the working of those mechanisms resulted in a transition from the previous Hot House Climate State to the very cold ‘Ice House State’ that we live in now. That change was set in motion by the changing configuration of continents, oceans and seas.
Some have speculated that the distribution of relative humidity would remain roughly constant as climate changes (Allen and Ingram 2002). Specific humidity can be thought of as “absolute” humidity or the total amount of water vapor in the atmosphere. We will call this amount “TPW” or total precipitable water with units of kg/m2. As temperatures rise, the Clausius-Clapeyron relationship states that the equilibrium vapor pressure above the oceans should increase and thus, if relative humidity stays the same, the total water vapor or specific humidity will increase. The precise relationship between specific humidity and temperature in the real world is unknown but is estimated to be between 0.6 to 18% (10-90%ile range) per degree Celsius from global climate model results (Allen and Ingram 2002) …
The paper is quite technical and focuses specifically on Chinese temperature trends. But, we think that it will still be of interest to many readers here, especially anybody who is interested in any of the following topics:
Urbanization bias
The homogenization of temperature data
The “early 20th century warm period” found in many parts of the Northern Hemisphere, and
Comparing temperature proxies to instrumental records
by Amanda Morris, June 4, 2018 inNorthwesternUniversity
A tiny clue found in ancient sediment has unlocked big secrets about Greenland’s past and future climate.
Just beyond the northwest edge of the vast Greenland Ice Sheet, Northwestern University researchers have discovered lake mud that beat tough odds by surviving the last ice age. The mud, and remains of common flies nestled within it, record two interglacial periods in northwest Greenland. Although researchers have long known these two periods — the early Holocene and Last Interglacial — experienced warming in the Arctic due to changes in the Earth’s orbit, the mix of fly species preserved from these times shows that Greenland was even warmer than previously thought.
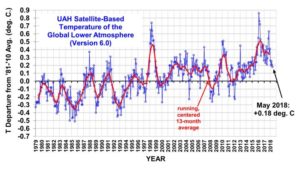
The Version 6.0 global average lower tropospheric temperature (LT) anomaly for May, 2018 was +0.18 deg. C, down a little from the April value of +0.21 deg. C :
We have mentioned countless times on this blog that the warming oceans are evidence that CO2 is not the cause of global warming. To understand the climate you must first understand the oceans. The oceans control the global climate. As the oceans warm, they warm and alter the humidity of the atmosphere above them. The problem is, as we have pointed out countless times, CO2’s only defined mechanism by which to affect climate change is through the thermalization of LWIR between 13 and 18µ.
LWIR between 13 and 18µ doesn’t penetrate or warm the oceans. Visible radiation, mainly from the high energy blue end of the spectrum does. CO2 is transparent to incoming visible radiation. The energy stored in the atmosphere and land is insignificant when compared to the oceans. The oceans contain 2,000x the energy of the atmosphere, so small changes to the oceans can mean big changes in the atmospheric temperature. The oceans also produce vast amounts of CO2 (20 x the amount man produces), and the most abundant and potent greenhouse gas, water vapor.
As far as global temperature goes it’s been a warmish start to the year, though not exceptional. This has led Carbon Brief in its three-monthly “state of the climate” report to predict that this year “is likely” to be as warm as the fourth warmest year since records began about 150 years ago. They say it could be as high as the second or as low as the 12th warmest.
Carbon Brief says, “The first three months of 2018 can give some sense of what to expect for the entire year.” But being based on a quarter of this year’s monthly measurements it could be described as either bold or foolish. Because the prediction is made without a good understanding of what has been happening to the global temperature in the past months it is probably more of the latter.
Nowhere is the Carbon Brief prediction is there any analysis of why 2018 got off to a warm start. Look towards the Tasman Sea that has been adding to global temperatures since late 2017.
The water temperature in the Tasman Sea is well above normal – 6° C more than average for the start of December. New Zealand’s summer was the hottest on record, Tasmania had its hottest November-January on record. It was exceptionally warm on both sides of the Tasman, more than two degrees above average in December and part of January.
Presently sea surface temperatures (SST) are the best available indicator of heat content gained or lost from earth’s climate system. Enthalpy is the thermodynamic term for total heat content in a system, and humidity differences in air parcels affect enthalpy. Measuring water temperature directly avoids distorted impressions from air measurements. In addition, ocean covers 71% of the planet surface and thus dominates surface temperature estimates. Eventually we will likely have reliable means of recording water temperatures at depth.
Recently, Dr. Ole Humlum reported from his research that air temperatures lag 2-3 months behind changes in SST. He also observed that changes in CO2 atmospheric concentrations lag behind SST by 11-12 months. This latter point is addressed in a previous post Who to Blame for Rising CO2?
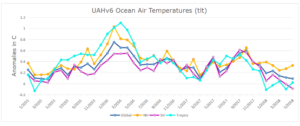
The May update to HadSST3 will appear later this month, but in the meantime we can look at lower troposphere temperatures (TLT) from UAHv6 which are already posted for May. The temperature record is derived from microwave sounding units (MSU) on board satellites like the one pictured above… (…)
After finally realizing that the claimed rising temperatures never showed up around the globe, the scientific community is being told through its most respected publications that specific forms of pollution that are human-generated are keeping populations from experiencing the toll of other airborne human-made emissions.
“Pollution in the atmosphere is having an unexpected consequence, scientists say – it’s helping to cool the climate, masking some of the global warming that’s occurred so far,” Scientific American reported last week. “That means efforts worldwide to clean up the air may cause an increase in warming, as well as other climate effects, as this pollution disappears.”
Because trees may only grow within narrowly-defined temperature ranges and elevations above sea level, perhaps the most reliable means of assessing the air temperatures of past climates is to collect ancient treeline evidence. In a new paper, Kullman (2018) found tree remnants at mountain sites 600 to 700 meters north of where the modern treeline ends, strongly implying Early Holocene air temperatures in northern Sweden were 3-4°C warmer than recent decades.
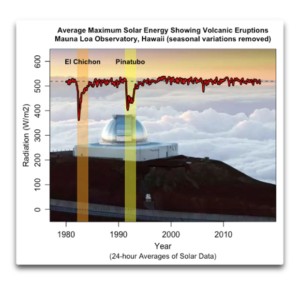
Inspired by Richard Keen’s interesting WUWT post on using eclipses to determine the clarity of the atmosphere, I went to the website of the Hawaiian Mauna Loa Observatory. They have some very fascinating datasets. One of them is a measurement of direct solar radiation, minute by minute, since about 1980.
I thought that I could use that dataset to determine the clarity of the atmosphere by looking at the maximum downwelling solar energy on a month by month basis. I’ve described my method of extracting the maximum solar energy from the minute by minute data in the appendix for those interested.
Most estimates of Chinese regional Surface Air Temperatures since the late-19th century have identified two relatively warm periods – 1920s–40s and 1990s–present. However, there is considerable debate over how the two periods compare to each other. Some argue the current warm period is much warmer than the earlier warm period. Others argue the earlier warm period was comparable to the present. In this collaborative paper, including authors from both camps, the reasons for this ongoing debate are discussed. Several different estimates of Chinese temperature trends, both new and previously published, are considered. A study of the effects of urbanization bias on Chinese temperature trends was carried out using the new updated version of the Global Historical Climatology Network (GHCN) – version 4 (currently in beta production)
by Li M. et al., 2017 in CO2Science/Int.J.Biometeorology
In discussing the characteristics of their three-century temperature proxy, the authors report the existence of two prominent decadal-scale cold periods (1801-1833 and 1961-2003) and two prominent decadal-scale warm periods (1730-1800 and 1928-1960). They also note that “fifteen extreme cold years (< -1.5σ) were identified and most occurred within 1-2 years after major volcanic eruptions,” contrasting with the finding that the two decadal-scale warm periods both occurred during “gaps in volcanic activities.”
Perhaps the most significant observation made by the authors, however, is that “none of the extreme warm years [< 1.5σ] or decades occurred in the most recent 30 years,” which fact runs counter to anthropogenic global warming claims that temperatures of the past few decades have been the warmest of the past thousand years (…)
by Tony Heller, May 22, 2018 in TheDeplorableClimateScienceBlog
Settled science at NASA means constantly rewriting the past. Here are a few of the NASA Reykjavik, Iceland temperature graphs I have captured over the past six years.
Thanks to GWPF for publishing posthumously Bill Gray’s understanding of global warming/climate change. The paper was compiled at his request, completed and now available as Flaws in applying greenhouse warming to Climate Variability This post provides some excerpts in italics with my bolds and some headers. Readers will learn much from the entire document (title above is link to pdf).
The Fundamental Correction
The critical argument that is made by many in the global climate modeling (GCM) community is that an increase in CO2 warming leads to an increase in atmospheric water vapor, resulting in more warming from the absorption of outgoing infrared radiation (IR) by the water vapor (…)
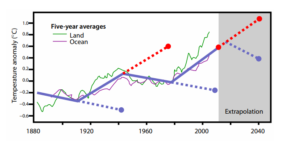
Figure 14: Global surface temperature change since 1880. The dotted blue and dotted red lines illustrate how much error one would have made by extrapolating a multi-decadal cooling or warming trend beyond a typical 25-35 year period. Note the recent 1975-2000 warming trend has not continued, and the global temperature remained relatively constant until 2014.
The effects of past land-cover changes on climate are disputed. Previous modelling studies have generally concluded that the biogeophysical effects of historical deforestation led to an annual mean cooling in the northern mid-latitudes, in line with the albedo-induced negative radiative forcing from land-cover changes since pre-industrial time reported in the most recent Intergovernmental Panel on Climate Change report. However, further observational and modelling studies have highlighted strong seasonal and diurnal contrasts in the temperature response to deforestation
By investigating fossils, Prof. Kießling and Dr. Carl Reddin, who is also at GeoZentrum Nordbayern, have shown that coral, molluscs, and sponges have been following their preferred cold and warm zones for half a billion years. Isotherms (geographic lines denoting the same temperature, for example 20°C) shift towards the poles or the equator as soon as the global temperature rises or decreases. Isotherms have been shifting towards the poles for several years due to global warming.
The tendency towards climate-related migration is most apparent in tropical species. This may be due to the fact that several of these species live near the thermal maximum for complex organisms of 35-45°C . Current global warming trends are driving marine animals towards the poles, provided there is a suitable habitat they can migrate to.
The researchers claim adding historical data derived fudge factors to correct the discrepancy between climate models and historical observations, producing a Frankenmodel mix of fudge factors and defective physics, will make climate predictions more reliable (…)
During 2017, there were 150 graphs from 122 scientific papers published in peer-reviewed journals indicating modern temperatures are not unprecedented, unusual, or hockey-stick-shaped — nor do they fall outside the range of natural variability. We are a little over 4 months into the new publication year and already 81 graphs from 62 scientific papers undermine claims that modern era warming is climatically unusual.
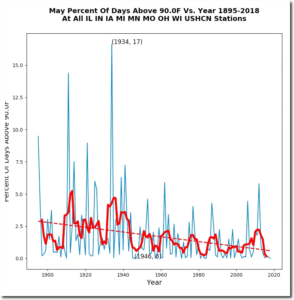
by Tony Heller, May 12, 2012 in TheDeplorableClimSciBlog
Ninety-five degree temperatures were common in the Midwest during May prior to 1940, but almost never happen any more. May afternoon temperatures have been declining in the Midwest since the 19th century. The hottest May (by far) was 1934, when 100 degree temperatures were widespread across the Midwest, including 101 degrees at Algona, Iowa on May 7th, 1934.