La question est posée dans un excellent article de Pierre Gosselin paru en juin 2017 sur son site incontournable (1).
Personnellement, et je ne suis évidemment pas le seul, je n’accorde aucun crédit aux annonces tonitruantes d’ “année la plus chaude”, de “record de température” dont sont si friands nos médias, et je conserve un scepticisme identique pour la détermination de la température globale moyenne de la planète. En effet, pour qui s’intéresse à l’actualité climatique, les contradictions et manipulations dans les relevés de température terrestre sont monnaie courante, sous prétexte bien souvent d’ajustements et de mise à niveau, que ce soit pour les relevés actuels ou “l’actualisation” de données anciennes…
“L’avenir est connu, il suffit de modifier le passé“.
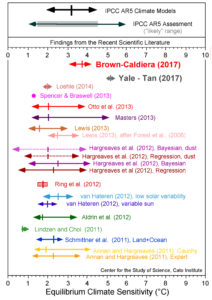
WUWT readers may recall this chart which clearly illustrates just how uncertain climate science really is.
t seems that some climate academics are a bit embarrassed that they haven’t been able to pin down climate sensitivity. From EU Horizon Magazine
Climate sensitivity – reducing the uncertainty of uncertainty
by Jon Cartwright
A study published in January 2018 claims to halve the uncertainty around how much our planet’s temperature will change in response to rising carbon dioxide (CO2) levels, potentially giving governments more confidence to prepare for the future.
This paper deals with the central argument that skeptics bring up about claims of global warming: How do you separate the temperature signal from the base components like natural variation, human land-use influence, micro-site bias, measurement errors and biases, and other factors to get the “true” global warming signal?
The answer is that you can’t, at least not easily.
With the surface temperature record, it’s somewhat easier since you can observe some of those elements directly and separate them (such as we’ve done in our surfacestations project for land-use microsite biases), but in the ocean, everything is homogenized by the ocean itself. All you can look for is patterns, and try to disentangle based on pattern recognition. That’s what they are trying to do here.
Disentangling Global Warming, Multidecadal Variability, and El Niño in Pacific Temperatures
Authors
Robert C. Wills, Tapio Schneider, John M. Wallace, David S. Battisti, Dennis L. Hartmann
by P. Homewood, March 15, 2015 in NotaLotofPeopleKnowThat
According to the heavily adjusted NOAA data, last month was the fifth warmest February on record in the Central Lakes Division of NY State, with an average mean temperature of 31.4F.
Prior to 1981, the warmest was February 1954, which averaged 29.8F. In other words, NOAA claim that February 1954 was 1.6F colder than last month.
Which all looks very suspicious, because the opposite picture is shown at the high quality station of Ithaca Cornell University (…)
German skeptic and weather expert ‘Schneefan’ here writes how climate activist Mark C. Serreze recently announced this year’s sea ice extent was at the smallest all-time area. But since then Arctic temperatures have plummeted and sea ice area has grown to over 14 million square kilometers (…)
This recent post discussed the end of the Modern Warm Period and the year that global cooling began. That post was inspired by a comment to a post on WUWT six to eight years ago to the effect that climate is controlled by the Sun’s magnetic flux – no need to worry about much else. The comment seemed to come from a warmer scientist – they are well funded, have plenty of time on their hands, some are smart and idle curiosity would get a few looking into what controls climate. The results would not be published of course. To paraphrase Mussolini, everything within the narrative, nothing outside the narrative, nothing against the narrative. If the Sun’s magnetic flux controls climate, you don’t have to worry about what goes on under the hood – the effect of EUV on the NAO, the GCR flux, the F10.7 flux, any other flux apart from the magnetic flux (…)
by Tony Heller, March 10, 2018 in TheDeplorableClimateScience
Global warming is no longer about imaginary global warming. It is now about an imaginary increase in extreme weather.
March of 2012 was very mild in the Eastern US, and NOAA’s Climate Extremes Index counted that as “extreme weather” – declaring 2012 to be the most extreme year on record.
I’m sure you can see the problem with Dr. Judith’s question—temperatures can rise without ANY new sources of heat or ANY change in existing sources of heat.
For example, regarding the climate system, every year there is more and more oil that goes into the ocean. This oil floats on the surface in a monomolecular layer, and it reduces both conduction and evaporation. As a result, the oceans end up slightly warmer than they would be without the oil … where is Dr. Judith’s mysterious “source of heat” supposedly driving that change?
by Tony Heller, March 8, 2018 in TheDeplorableClimateScience
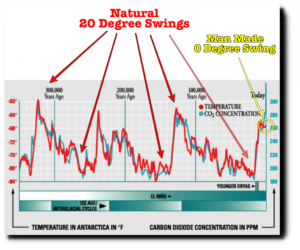
Antarctic ice cores show regular swings in temperature of more than 20 degrees. These were all natural, but the recent zero degree swing was caused by your SUV (…)
A group of prominent scientists are calling for a global network of advanced weather stations that don’t need to go through controversial data adjustments, and it’s vindication for global warming skeptics.
Seventeen climate scientists co-authored a research article published in the International Journal of Climatology calling for a global climate station network modeled after the United States Climate Reference Network (USCRN) to use as a baseline for data quality.
As the Earth’s surface and atmosphere warm, the amount of moisture – water vapour – in the atmosphere will increase. Understanding the size of this increase is important for predicting future climates as water vapour is a significant greenhouse gas. Atmospheric moisture content also influences the patterns and intensity of rainfall events.
The relationship between temperature and moisture content can be explored by the study of intervals in Earth’s history when climates where significantly warmer than those seen in modern times, which necessitates a method for estimating ancient atmospheric moisture content.
UPDATE(2/23/18):The previous version of this post had improper latitude bounds for the HadCRUT4 Tsfc data. I’ve rerun the results… the conclusions remain the same. I have also added proof that ENSO is accompanied by its own radiative forcing, a controversial claim, which allows it to cause multi-decadal climate change. In simple terms, this is clear evidence the climate system can cause its own, natural, internally-generated climate changes. This is partly what has caused recent warming, and the climate modelling community has assumed it was all human-caused.
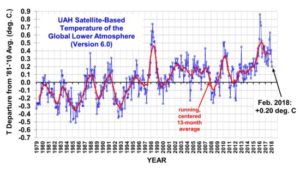
The Version 6.0 global average lower tropospheric temperature (LT) anomaly for February, 2018 was +0.20 deg. C, down a little from the January value of +0.26 deg. C (…)
by P. Homewood, February 28, 2018 in NotaLotofPeopleKnowThat
(…)
During the 1930s and 40s, and in earlier parts of the cycle, winters and spring were much warmer than, for instance, the 1960s and 70s. And, again, we see that those warmer decades were just as warm as recently.
It is these two seasons that have largely driven the annual changes.
In other words, the warmer winters we now commonly see in the Arctic are nothing new at all. They only appear unusual because we have started looking at data since 1954.
How cities heat up The way streets and buildings are arranged makes a big difference in how heat builds up, study shows
CAMBRIDGE, Mass. – The arrangement of a city’s streets and buildings plays a crucial role in the local urban heat island effect, which causes cities to be hotter than their surroundings, researchers have found. The new finding could provide city planners and officials with new ways to influence those effects.
Some cities, such as New York and Chicago, are laid out on a precise grid, like the atoms in a crystal, while others such as Boston or London are arranged more chaotically, like the disordered atoms in a liquid or glass. The researchers found that the “crystalline” cities had a far greater buildup of heat compared to their surroundings than did the “glass-like” ones.
A vicious cold blast is about to invade Europe from the Russian Front and shock freeze the continent.
Interestingly some people – meteorologists among them – have been poking fun at the “hype” or even have blasted media outlets and other private meteorologists for “sensationalizing” the forecast Cold Beast from the East.
Sure, a number of locations over Germany for example may not even see temperatures drop below -10°C. What’s the big deal? It’s winter after all, they are saying. Just put on an extra coat. Some of these critics have even called the loud warnings of the Siberian cold “shrill, dumbass, click-baiting headlines“.
According to the United Nations Intergovernmental Panel on Climate Change (UN-IPCC) and computer modeling, the Sun’s role in modern-era climate change checks in at somewhere slightly above nothing.
And yet it is increasingly evident that more and more scientists across the globe do not take the position that the Sun’s influence on climate change is negligible.
In 2016 and 2017, for example, over 250 papers (see here and here) linking the Sun to climate changes were published in scientific journals.
The long term forecast for Europe, where it is already colder than normal, shows temperatures plummeting to near -20°C in parts of Central Europe by early next week, extending what has been already a brutal winter.
Europeans longing for spring will just have to be patient for awhile. Indeed this winter has been a harsh one across the northern hemisphere with record cold temperatures being set from Siberia to North America to Japan. Also a number of places have seen record snowfalls.
The European Alps have had one of the snowiest winters in years as snow continues to pile up meters high.
by P. Homewood, February 21, 2018 in NotaLotofPeopleKnowThat
The Arctic Ocean once froze reliably every year. Those days are over.
Arctic sea ice extent has been measured by satellites since the 1970s. And scientists can sample ice cores, permafrost records, and tree rings to make some assumptions about the sea ice extent going back 1,500 years. And when you put that all on a chart, well, it looks a little scary (…)
From the EUROPEAN COMMISSION JOINT RESEARCH CENTRE and the “Dr. Roger Pielke Sr. was right” department. I suspect a whole bunch of climate models that don’t take this into consideration, and think CO2 is the dominant climate driver, are going to need to be revised.
Land use change has warmed the Earth’s surface
Natural ecosystems play a crucial role in helping combat climate change, air pollution and soil erosion. A new study by a team of researchers from the Joint Research Centre, the European Commission’s science and knowledge service, sheds light on another, less well-known aspect of how these ecosystems, and forests in particular, can protect our planet against global warming.
Earlier this month, the authors of a new paper (Partridge et al., 2018) published in Geophysical Research Letters promulgated the term “warming hole” to describe the cooling temperatures gripping most of the Eastern half of the United States from the late 1950s through 2015
by Eck, February 15, 2018 in K. Richard NoTricksZone
A new scientific study says surface temperatures in the Northeastern U.S. (Appalachian Mountains) have undergone a significant long-term cooling trend since the early 20th century, complicating the detection of a clear anthropogenic global warming (AGW) signal for the region.
According to Eck (2018), the two coldest Appalachian winters since 1910 were recorded in recent years (2009-’10 and 2010-’11), and 9 of the 10 warmest winters occurred prior to 1960.
In the early 1930s, Appalachian winters were 4.7°C warmer than they have been during the last 30 years (1987-2017).
Rankin Inlet, Nunavut gets cold in the winter. Located on the northwestern shore of the Hudson Bay at 62 degrees north and between Chesterfield Inlet and Arviat, the town is definitely in a remote yet exposed region. Weather is just a part of life and recently the weather has been colder than cold.
La géologie, une science plus que passionnante … et diverse