Archives par mot-clé : Temperature

8000 Years Of Zero Correlation Between CO2 And Temperature, GISP 2 Ice Core Shows – Opposite Is True!

by P. Gosselin, December 20, 2019 in NoTricksZone


A plot of ice core data from Greenland reveals that CO2 does not drive temperatures.

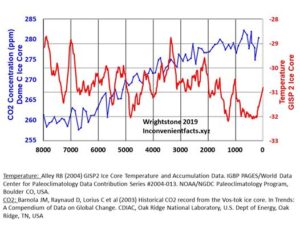
At Facebook, Gregory Wrightstone posted a chart plotting atmospheric CO2 concentration reconstructed from  Dome C Ice Core versus temperature that was reconstructed from the GISP 2 Ice Core.

According to global warming scientists, there’s supposed to be tandem movement between the two magnitudes.

CO2, they say, drives global temperature.

But over the past 8000 years, the data show that temperature in reality has moved in the opposite direction of CO2 and thus of what climate alarmist scientists have told us.


If anything can be drawn from the plotted data, it is that there’s an inverse correlation: As CO2 rises, temperature drops. But of course there’s a lot more to it. CO2 is not that huge major climate driver that alarmists like having us believe it is.

NEWLY PUBLISHED SCIENTIFIC PAPER TEARS GLOBAL WARMING AND THE IPCC TO SHREDS

by Cap Allon, December 11, 2019 in Electroverse


A scientific paper entitled “An Overview of Scientific Debate of Global Warming and Climate Change” has recently come out of the University of Karachi, Pakistan. The paper’s author, Prof. Shamshad Akhtar delves into earth’s natural temperature variations of the past 1000 years, and concludes that any modern warming trend has been hijacked by political & environmental agendas, and that the science (tackled below) has been long-ignored and at times deliberately manipulated.

The published paper –available in full HERE— sets out its intent:

Climate change is NOT a new phenomenon. The palaeo-climatic studies reveal that during the Pleistocene and Holocene periods several warm and cold periods occurred, resulting in changes of sea level and in climatic processes like the rise and fall of global average temperature and rainfall.

Another New Study Finds The Canadian Arctic Was About 1-2°C Warmer During Medieval Times

by K. Richard, December 16, 2019 in NoTricksZone


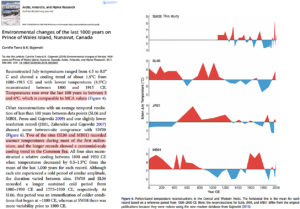
Four reconstructions from the central and western High Arctic reveal July temperatures were about 1-2°C warmer than today during most of the 1st millennium and Medieval period (Tamo and Gajewski, 2019).

A few years ago, a chironomid reconstruction of Boothia Peninsula in the Canadian Arctic (Fortin and Gajewski, 2016) revealed not only were today’s temperatures the coldest of the last 7000 years, but the last 150 years “do not indicate a warming during this time.”


GLOBAL TEMPERATURES HOLDING STEADY FOR TWO DECADES

by Climate Science, December 13,  2019


Global temperatures have been holding nearly steady for almost two decades according to satellites from the Remote Sensing Systems (RSS) and University of Alabama at Huntsville (UAH).6You will never see that in the mass media.

2018 is the 3rd year in a row of cooling global temperatures – So far 2018 was the third year in a row that the globe has cooled off from its El Nino peak set in 2015.

Norwegian Professor Ole Humlum explained in his 2018 “State of the Climate Report”: “After the warm year of 2016, temperatures last year (in 2018) continued to fall back to levels of the so-called warming ‘pause’ of 2000-2015. There is no sign of any acceleration in global temperature, hurricanes or sea-level rise. These empirical observations show no sign of acceleration whatsoever.”

While 2005, 2010, 2015, and 2016 were declared the “hottest years” or “near -hottest,”  based on heavily altered surface data by global warming proponents, a closer examination revealed the claims were “based on year-to-year temperature data that differs by only a few HUNDREDTHS of a degree to tenths of a degree Fahrenheit – differences that were within the margin of error in the data.” 7

MIT climate scientist Dr. Richard Lindzen ridiculed “hottest year” claims. “The uncertainty here is tenths of a degree. It’s just nonsense. This is a very tiny change period,” Lindzen said. “If you can adjust temperatures to 2/10ths of a degree, it means it wasn’t certain to 2/10ths of a degree.”

In 2015, the Associated Press was forced to issue a “clarification” on “hottest year” claims, stating in part: “The story also reported that 2014 was the hottest year on record, according to the National Oceanic and Atmospheric Administration and NASA, but did not include the caveat that other recent years had average temperatures that were almost as high  – and they all fall within a margin of error that lessens the certainty that any one of the years was the hottest.”

Climatologist Pat Michaels explained that, in any case, the world’s temperature “should be near the top of the record given the record only begins in the late 19th century when the surface temperature was still reverberating from the Little Ice Age.”

“Hottest year” claims are purely political statements designed to persuade the public that the government needs to take action on man-made climate change. In addition, the claims of “hottest year” are based on surface data only dating back to the late 19th century, and also ignore the temperature revisions made by NASA and NOAA that have enhanced the warming trend by retroactively cooling the past. 8

6 The Pause Lives on: Global Satellites: 2016 not Statistically Warmer than 1998 – Climatologist Dr. Roy Spencer – January 4, 2017
7 Dr. David Whitehouse noted the ‘temperature pause never went away’ – January 19, 2017
8 Climate analyst Tony Heller – Real Climate Science – February 14, 2017
Ces villes qui ne se réchauffent pas

by Jean N., 6 décembre 2019 in ScienceClimatEnergie


Non, le réchauffement de la planète n’est pas global comme l’affirment les médias. Selon la dernière version des données officielles de température fournies par le Goddard Institute for Space Studies (GISS) de la NASA (les séries thermométriques terrestres GHCNv4), il existe dans le monde toute une série de villes, villages et régions où aucun réchauffement de la troposphère n’est observé au niveau du sol en fonction du temps. Ceci est d’ailleurs confirmé par la récente étude de Lansner & Pedersen publiée en 2018 (et qui avait fait l’objet d’un article ici-même), mais aussi par d’autres publications qui analysent par exemple le “warming hole” des Etats-Unis (Partridge et al. 2018). Et pourtant, dans ces régions qui ne se réchauffent pas, le taux atmosphérique de CO2 a bel et bien augmenté de manière significative (voir ici). Le but du présent article est d’abord de vous présenter 12 de ces villes et régions. Nous verrons ensuite que le rôle attribué au CO2 est exagéré et que de nombreux facteurs, méconnus, entrent en jeu et jouent probablement un rôle dominant.

1. Présentation de quelques villes et régions qui ne se réchauffent pas.

Dans les lignes qui suivent, les données officielles de température seront utilisées. La qualité de ces données a bien entendu été contrôlée par les gestionnaires locaux des stations météorologiques, et puis par le GISS lui-même. Ne seront présentées que les séries de températures moyennes annuelles. Les données ont ensuite été ajustées pour tenir compte des effets non climatiques, des changements géographiques éventuels de stations de mesure, ainsi que de l’effet de chaleur urbain qui a été déduit. Il s’agit donc de données nettoyées, appelées “GHCN-adj-homogenized”. Chacun peut se les procurer librement sur le site web du GISS (il suffit de cliquer sur un endroit du monde sur la carte ici).

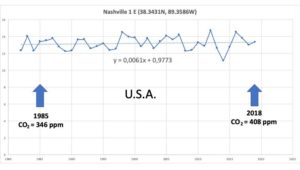
1.1. Commençons par Nashville aux Etats-Unis (Figure 1). Il s’agit de la capitale de l’État du Tennessee qui comptait 668 347 habitants en 2014. Nashville possède un climat subtropical humide (dans la Classification de Köppen) avec des hivers doux qui peuvent être modérément froids et des étés chauds et humides. Les moyennes mensuelles varient entre 3,4 °C pour le mois le plus froid (janvier) et 26,6 °C pour le mois le plus chaud (juillet). On peut voir sur la Figure 1 la relative stabilité de la température moyenne annuelle oscillant autour de 13°C, et ce depuis 1982 (la droite de régression possède une pente très faible, proche de zéro, et valant +0,0061).


Figure 1. Température moyenne annuelle de Nashville (Tennessee, USA) entre 1982 et 2018.


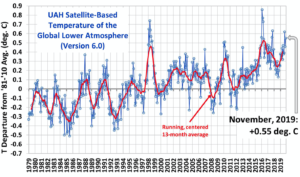
UAH Global Temperature Update for November 2019: +0.55 deg. C

by Roy Spencer, December 2, 2019 in WUWT


The Version 6.0 global average lower tropospheric temperature (LT) anomaly for November, 2019 was +0.55 deg. C, up from the October value of +0.46 deg. C.

The linear warming trend since January, 1979 remains at +0.13 C/decade (+0.11 C/decade over the global-averaged oceans, and +0.18 C/decade over global-averaged land).

The UAH LT global anomaly image for November, 2019 should be available in the next few days here.

The global and regional monthly anomalies for the various atmospheric layers we monitor should be available in the next few days at the following locations:

Lower Troposphere: http://vortex.nsstc.uah.edu/data/msu/v6.0/tlt/uahncdc_lt_6.0.txt
Mid-Troposphere: http://vortex.nsstc.uah.edu/data/msu/v6.0/tmt/uahncdc_mt_6.0.txt
Tropopause: http://vortex.nsstc.uah.edu/data/msu/v6.0/ttp/uahncdc_tp_6.0.txt
Lower Stratosphere: http://vortex.nsstc.uah.edu/data/msu/v6.0/tls/uahncdc_ls_6.0.txt


UK ON COURSE FOR AN HISTORICALLY COLD NOVEMBER

by Cap Allon, November 19, 2019 in Electroverse


After decades of being lectured by the Met Office -among others– that global warming will bring an end to extreme-cold temperatures, the UK still somehow keeps-on clocking them — yet another example of how simple real-world observations can unravel the AGW-ruse.

Brits have been suffering-through an historically cold month, too — November’s average temperature has held well-below the norm for the first 17 days, continuing October’s dramatic cooling trend:

The Central England Temperature (CET) record measures the monthly mean surface air temperatures for the Midlands region of England, and is the longest series of monthly temperature observations in existence anywhere in the world.

Its mean reading for November 2019 (to the 17th) is sitting at 6.6C — that’s 0.7C below the already cool 1961-1990 average, the current standard period of reference for climatological data used by the WMO.

In the 360 years of CET data, there have only been 10 other years with an November average temperature of 6.6C — these are 1804, 1833, 1835, 1849, 1886, 1932, 1941, 1949, 1977, 1980.

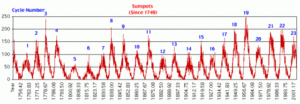
Note also how the majority of these years fall in or around solar minimums of the past (1804, 1849, and 1980 being the only exceptions).

More Real Data Totally Contradict Fake Media… Show Scandinavia, Ireland NOT WARMING Over Past Decades

by P. Gosselin , November 27, 2019 in NoTricksZone


Global warming alarmists like to tell us the planet is warming faster and faster.

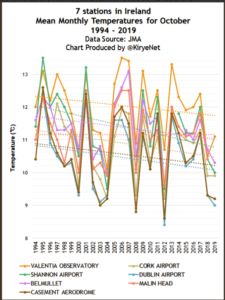
Yet, when we look objectively at the untampered data, we see this is not the case at all at many locations.  Today we look at the (untampered) data from the Japan Meteorology Agency (JMA) for some stations across northern Europe for the month of October.

According to global warming believers, winter is supposed to be coming later, and spring arriving earlier. So looking at the season transition month of October is interesting.

Ireland

At the JMA we find seven stations in Ireland that have October data going back sufficiently to 1994:

THE DANISH METEOROLOGICAL INSTITUTE ADMITS IT WRONGLY REPORTED GREENLAND’S “RECORD WARM TEMPERATURE” THIS SUMMER

by Cap Allon, November 17, 2019 in Electroverse


The Danish Meteorological Institute (DMI) admitted it wrongly reported Greenland’s record summer warmth, in what it called “good news from a climate perspective”…?

The DMI, a key player in monitoring Greenland’s climate, reported a “shocking” early-August temperature of between 2.7C (37F) and 4.7C (40.5F) at the Summit weather station, located some 3,202m above sea level at the center of the Greenland ice sheet.

This news quickly spread to every corner of the left-leaning web, like some nasty EOTW rash. But just a few days later the DMI posted a tweet retracting that record temp, saying that after a “closer look” (whatever that means exactly) it was revealed that the monitoring equipment had been giving “erroneous results”.

“Was there record-level warmth on the inland ice on Friday?” said the institute’s tweet dated Aug 08. “No! A quality check has confirmed out suspicion that the measurement was too high.”

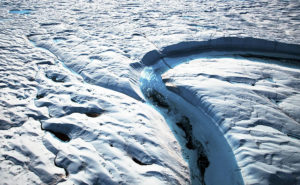
Blue Melt River, Petermann Glacier, in remote northwestern Greenland, on Nares Strait. (Photo by: Dave Walsh/VW Pics/Universal Images Group via Getty Images)

Raw Data Bombshell: no change in Very Hot Days in Australia since World War I

by JoNova, November 20, 2019


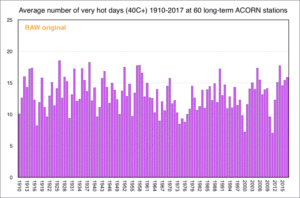
After we were shocked at the latest ACORN changes to our Very Hot Days data, I asked Chris Gillham if we could see the effect of Bureau of Meteorology changes to the original raw data – and he replied it would be too time-consuming writing the code to calculate 40C+ days among the millions of daily temperatures from 112 weather stations across Australia since 1910. Then he did it anyway.

Wow. In 2011, the BoM’s ACORN 1 adjustments wiped out some of the “very hot days” recorded at weather stations in the early 1900s. These were records that had stood for a whole century. Then, quietly six years later, the ACORN 2 readjustments turned the statistical air conditioner on again and cooled people from 100 years in the future.

It’s all especially miraculous given that even the old World War I  data was recorded in official BoM-approved Stevenson screens. The BoM won’t consider pre 1910 data because it wasn’t standardized, but even when it is, they still have to “fix” it. And in the intervening years after 1910, the Urban Heat Islands have grown and electronic equipment that can record one-second-records have been introduced across the nation. With the old equipment, 40C+ extremes were harder to get than with today’s micro-minute spikes caused by gusts of hot air rolling off carparks and tarmacs.

What we see in the 60 longest running ACORN sites, all open in 1910, is that the raw temperature data had just as many “very hot days” in the World War I era as it does now. Oh boy.

No wonder the BOM was keen to move the “Very Hot Days” graphics and data and tuck them away in a remote page on their website.


N. Hemisphere In Hypothermia! Widespread Early Winter…”Historic Snowstorms”…”Record Books Rewritten”

by P. Gosselin, November 13, 2019 in NoTricksZone


Winter has not even officially arrived, but already large areas of the northern hemisphere are seeing “historic snowfalls”, frigid temperatures and even avalanche alarms.

The Northern Hemisphere has certainly caught a major cold, one certainly not caused by the human CO2 virus. Instead of fever, parts of the northern hemisphere are in hypothermia!

Alarmists, media desperate

Though global warming scientists will never admit it, they are really surprised and stunned. All that is left for them is to make up some cockamamie warming-causes-cold explanations and hope there are enough severely stupid among the media and masses to believe it.

“United States — Rewrite the Record Books”

Beginning in North America, “sub-zero temperatures are now blasting” millions of Americans following “the three historic snowstorms which buried parts of the U.S. last month,” reports weather site electroverse.net here.

Electroverse writes that “lows throughout the week will be more like January temperatures” with readings below zero for many U.S. states and “temps down into the teens are even forecast as far south as Texas.” Yesterday, 97 records toppled.

“It’s a big deal,” Electroverse writes in its headline.

Solar activity suspected

170 Years of Earth Surface Temperature Data Show No Evidence of Significant Warming

by T. Bjorklund, October 16, 2019 in WUWT


Key Points

1. From 1850 to the present, the noise-corrected, average warming of the surface of the earth is less than 0.07 degrees C per decade.

2. The rate of warming of the surface of the earth does not correlate with the rate of increase of fossil fuel emissions of CO2 into the atmosphere.

3. Recent increases in surface temperatures reflect 40 years of increasing intensities of the El Nino Southern Oscillation climate pattern.

Abstract

This study investigates the relationships between surface temperatures from 1850 to the present and reported long-range temperature predictions of global warming. A crucial component of this analysis is the calculation of an estimate of the warming curve of the surface of the earth. The calculation removes errors in temperature measurements and fluctuations due to short-duration weather events from the recorded data. The results show the average rate of warming of the surface of earth for the past 170 years is less than 0.07 degrees C per decade. The rate of warming of the surface of the earth does not correlate with the rate of increase of CO2 in the atmosphere. The perceived threat of excessive future global temperatures may stem from misinterpretation of 40 years of increasing intensities of the El Nino Southern Oscillation (ENSO) climate pattern in the eastern Pacific Ocean. ENSO activity culminated in 2016 with the highest surface temperature anomaly ever recorded. The rate of warming of the earth’s surface has dropped 41 percent since 2006.

Propagation of Error and the Reliability of Global Air Temperature Projections

by Patrick Franck, September 6, 2019 in Frontierin EarthScience


The reliability of general circulation climate model (GCM) global air temperature projections is evaluated for the first time, by way of propagation of model calibration error. An extensive series of demonstrations show that GCM air temperature projections are just linear extrapolations of fractional greenhouse gas (GHG) forcing. Linear projections are subject to linear propagation of error. A directly relevant GCM calibration metric is the annual average ±12.1% error in global annual average cloud fraction produced within CMIP5 climate models. This error is strongly pair-wise correlated across models, implying a source in deficient theory. The resulting long-wave cloud forcing (LWCF) error introduces an annual average ±4 Wm–2uncertainty into the simulated tropospheric thermal energy flux. This annual ±4 Wm–2 simulation uncertainty is ±114 × larger than the annual average ∼0.035 Wm–2 change in tropospheric thermal energy flux produced by increasing GHG forcing since 1979. Tropospheric thermal energy flux is the determinant of global air temperature. Uncertainty in simulated tropospheric thermal energy flux imposes uncertainty on projected air temperature. Propagation of LWCF thermal energy flux error through the historically relevant 1988 projections of GISS Model II scenarios A, B, and C, the IPCC SRES scenarios CCC, B1, A1B, and A2, and the RCP scenarios of the 2013 IPCC Fifth Assessment Report, uncovers a ±15 C uncertainty in air temperature at the end of a centennial-scale projection. Analogously large but previously unrecognized uncertainties must therefore exist in all the past and present air temperature projections and hindcasts of even advanced climate models. The unavoidable conclusion is that an anthropogenic air temperature signal cannot have been, nor presently can be, evidenced in climate observables.

New Paper: Ocean Temperature Changes Are Uneven And Uncertain

by DR.  B. Peiser, Nov. 8, 2019 in ClimateChangeDispatch


A new paper from the Global Warming Policy Foundation looks at how scientists monitor changes in ocean temperatures and finds a story of huge uncertainties and surprising findings.

For example, while warming might be expected to be fairly uniform, measurements suggest that it is regionalized, with parts of the South Pacific, in particular, warming more than elsewhere.

As the report’s author, Dr. David Whitehouse, says, it is hard to draw firm conclusions about what is happening in the seas:

“The oceans can absorb far more heat than the atmosphere, so temperatures changes are extremely small and therefore hard to measure reliably.”

“The energy that would raise the temperature of the atmosphere by 4 degrees C would only raise the ocean temperature by thousands of a degree, barely detectable.”

“Measuring changes in the ocean heat content are at the limits of our current capability and are made with significant uncertainties and unknowns.”

A recent claim that warming of the oceans was accelerating had to be withdrawn after errors were found in its uncertainty estimates by an independent scientist.

Cold Water? The Oceans and Climate Change can be downloaded here (PDF)

FINLAND’S COLDEST-EVER AUTUMN TEMPERATURE HAS JUST BEEN SMASHED + SNOW-DEPTH AT ITS HIGHEST LEVEL IN [AT LEAST] 60 YEARS

Cap Allon, November 5, 2019 in Electroverse


Brutal Arctic fronts have engulfed Scandinavia over the past few weeks. The record for Finland’s lowest-ever Autumn temp has just been smashed (for the second time this week), as has Sodankylä’s all-time snow-depth record (for early Nov).

The temperature in Enontekiö –a municipality in the Finnish part of Lapland– plunged to a Santa-freezing –28.2C(-18.8F) on Tuesday, Nov 5; beating-out the nation’s previous all-time autumnal low set just the previous day — Muonio’s -26.4C (15.5F) –located in far-northern Finland.

The previous record low for any autumn day in Enontekio was -26.3C (-15.3F).

Temperatures below -27C (-16.6F) were also recorded in Sodankylä, Luosto, and Kittilä on Tuesday, breaking local all-time record lows.

A STAGGERING 1,204 U.S. SITES RECORDED THEIR COLDEST-EVER OCTOBER TEMPERATURES LAST MONTH

by Cap Allon, November 4, 2019 in Electroverse


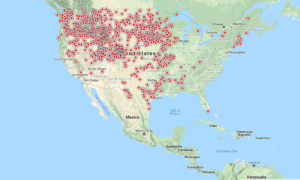
According to official NOAA data, more than twelve-hundred monthly low temperature records fell ACROSS the U.S. in October 2019 — multiple Arctic air masses rode anomalously-far south on the back of a wavy jet stream flow, itself associated with historically low solar activity.

The sun is currently in its deepest solar minimum of the past 100+ years, and the jet stream has weakened as a result; its usual tight ‘zonal’ flow has more-often-than-not reverted to a loose ‘meridional’ one. This wavy flow has diverted brutal Arctic air into the lower-latitudes, and is responsible for the U.S. either busting or tying a staggering 1204 all-time MONTHLY low temperature records in October 2019 (double the number of new heat records).


See also here and  here


Halloween Surprise: 96-Year-Old Record Snowfall In Chicago, Across U.S.

by K. Rodriguez, November 1, 2019 in ClimateChangeDispatch


A storm that made many areas of the Midwest feel more like winter than fall shattered a 96-year-old winter weather record in Chicago.

The historic storm system— which brought snow and cold over the Colorado Rockies this week— made it to the Midwest on Thursday morning, unleashing moderate-to-heavy snowfall in northeastern Kansas, eastern Iowa, Illinois, and southern Wisconsin.

The total accumulation expected in these areas is 3 to 5 inches of snow.

Chicago experienced its earliest snow day of the year where an inch or more of snow fell since October 20, 1989, and smashed its previous record of 0.7 inches at Chicago O’Hare International Airport on Wednesday with a whopping 1.2 inches of snow.

Denver Weather: Another Record Broken As Temperatures Plunge To Near Zero

by Ashton Altieri, Oct 30, 2019 in 4CBSDenver


DENVER (CBS4) – The temperature in Denver officially dropped to 3 degrees above zero early Wednesday morning. It was cold enough to shatter the previous record low for October 30 by 4 degrees. It was our third record temperature in 3 days and one more record is expected Thursday morning.

One final record is expected Thursday morning when the combination of clear skies, mainly light winds, and snow on the ground allows temperatures to plunge below zero along the Front Range. If the temperature manages to drop below -2° early Thursday, the all-time record low for October in Denver will be broken.  That record was set on October 29, 1917.

Controversy Swirls As Numbers Don’t Add Up… 1.3°C Missing Heat! – Earth Supposed To Be 16°C, But It’s Only 14.68°C

by P. Gosselin, October 19, 2019 in NoTricksZone


Even NASA says it:

Without the Earth’s greenhouse gases (GHG) in the atmosphere, the planet would be on average a frigid -18°C.

But because of the preindustrial 280 ppmv CO2 and other GHGs in our atmosphere, the average temperature of the Earth thankfully moves up by 33°C to +15°C (see chart below), based on the Stefan Boltzmann Law.

And because CO2 has since risen to about 410 ppmv today, the global temperature supposedly should now be about another 1°C warmer (assuming positive feedbacks) bringing the average earth’s temperature to 16°C.

And once the preindustrial level of CO2 gets doubled to 560 ppm, later near the end of this century, global warming alarmists insist the Earth’s temperature will be near 18°C, see chart above.

So we are now supposed to be at 16°C today and warming rapidly. But what is the globe’s real average temperature today? 15.8C? 16.0C? 16.5°C?

Answer: astonishingly the official institutes tell us it is only 14.7°C!

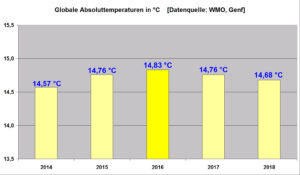
For example, data from the World Meteorological Organization (WMO) shows us the global absolute temperatures for the previous 5 years:


Image: www.klimamanifest.ch, data source: WMO in Geneva.

As the image above shows, the global absolute temperature last year was just 14.68°C.

This is 0.32°C COOLER than the 15°C we are supposed to have with 280 ppmv, and a whopping 1.32°C cooler than the 16°C it is supposed to be with the 410 ppmv CO2 we have in our atmosphere today.

So why are we missing over 1.3°C of heat? Why is there this huge discrepancy between scientists?

COLDEST OCTOBER 6 EVER RECORDED IN THE NETHERLANDS — ADDITIONAL ARCTIC AIR ON THE WAY FOR EUROPE

by Cap Allon, October 7, 2019 in Electroverse


Bone chilling cold descended into Europe over the weekend, exactly as forecast by the GFS. And the ‘Polar Invasion’ will continue to seize practically ALL of the continent throughout the week, sinking temps as much as 20C below average, with only far Western regions spared.

This past Sunday went down as the coldest October 6th ever recorded in ALL of Holland, in record books dating back to 1901 (solar minimum of cycle 13).

The country’s daily high, measured at the national weather station in De Bilt, climbed to just 9.6C (49F), which busted the previous record low of 10.1C (50F) set back in 1936 (just exiting solar min of cycle 16).

The weekend’s chill was thanks to a descending Arctic air mass which brought icy easterly winds, thick cloud cover and heavy rain. This pattern will run for rest of the week, and is expected to see further record lows temps tumble.

While across Europe the story is the same, too — all-time cold records will likely tumble in Central, Southern and Eastern parts, particularly during the first half of the week, with Italy, the Ukraine, Romania, Greece, Hungary, Slovakia, Austria and southern Poland on course to be worst hit:

Solar-Climate Theory Sheds New Light On History Of Chinese Civilization

by S. Chen, Sep; 24, 2019 in ClimateChangeDispatch


Scientists say they have found evidence beneath a lake in northeastern China that ties climate change and 500-year sun cycles to ups and downs in the 8,000 years of Chinese civilization.

According to the study by a team at the Institute of Geology and Geophysics in Beijing published in the science journal Nature Communications this month, whenever the climate warmed, Chinese civilization prospered and when it cooled, it declined.

While historians have used various social and economic factors to explain changes over the millennia, Dr. Xu Deke, lead author of the paper, and his colleagues said that while people played their part, their study indicated that cycles in solar activity influenced human activity.

“We just point out there is a natural constraint on human efforts,” Xu said.

Previous research linking Chinese history to climate relied on written records, but ancient texts contained only subjective descriptions of the weather and social development. The records also go back only so far – writing in China was not invented until 3,600 years ago.

For this latest study, the team and its leader, Chinese Academy of Sciences professor Lu Houyuan, took plant and lake bed sediment samples to track climate change over the centuries and compared them with written records.


Mann, Hayhoe Try To Erase To The Pesky Medieval Warm Period

by J. Taylor, October 3, 2019 in ClimateChangeDispatch


Climate alarmists Michael Mann and Katharine Hayhoe have been caught using dubious, revisionist temperature data in their attempt, as one Climategate email author put it,  to “deal a mortal blow” to the extensively documented Medieval Warm Period.

Before climate change became a political issue, it was scientifically well-established that a significant global warming event occurred between approximately 900 AD and 1200 AD.

For example, the United Nations Intergovernmental Panel on Climate Change (IPCC) First Assessment Report presented a temperature history and visual graph documenting that the Medieval Warm Period existed and that it brought temperatures at least as warm as today (at pg. 7).

Multiple peer-reviewed studies provided additional confirmation of the Medieval Warm Period.

The warming climate of the Medieval Warm Period spurred abundant crop production, fewer extreme droughts and floods, a growing human population, and improving living standards.

The Little Ice Age terminated the Medieval Warm Period and brought devastating weather extremes, widespread crop failures, famines, plagues like the Black Death, and a contracting human population.

For a good summary of the extensive benefits of the Medieval Warm Period and the devastating harms of the Little Ice Age, see the excellent book, “In the Wake of the Plague: The Black Death and the World It Created.”

NEW ZEALAND EXPERIENCES FOURTH COLDEST SEPTEMBER THIS CENTURY

by Cap Allon, October 4, 2019 in Electroverse


New Zealand’s average temperature last month –for the country as a whole– was below the 1981-2010 September avg., Niwa has said in its Monthly Climate Summary.

An unusual warming of the atmosphere high above Antarctica –called a Sudden Stratospheric Warming event (SSW)– assisted in making last month the fourth coldest September in New Zealand this century.

There have only ever been two SSWs recorded in the Southern Hemisphere, previous to this years — one in September 2002 (major) and another in September 2010 (minor).

The 2002 SSW event resulted in New Zealand experiencing a significant cold outbreak in October while the 2010 event was associated with record rainfall during September.

Record Antarctic Stratospheric Warming Causes Sept. 2019 Global Temperature Update Confusion

by Roy Spencer, October 4, 2019 in WUWT


While the vast majority of our monthly global temperature updates are pretty routine, September 2019 is proving to be a unique exception. The bottom line is that there is nothing wrong with the UAH temperatures we originally reported. But what I discovered about last month is pretty unusual.

It all started when our global lower tropospheric (LT) temperature came in at an unexpectedly high +0.61 deg. C above the 1981-2010 average. I say “unexpected” because, as WeatherBell’s Joe Bastardi has pointed out, the global average surface temperature from NOAA’s CFS model had been running about 0.3 C above normal, and our numbers are usually not that different from that model product.

[By way of review, the three basic layers we compute average temperatures from the satellites are, in increasing altitude, the mid-troposphere (MT), tropopause region (TP), and lower stratosphere (LS). From these three deep layer temperatures, we compute the lower tropospheric (LT) product using a linear combination of the three main channels, LT = 1.548MT – 0.538TP +0.01LS.]

Yesterday, John Christy noticed that the Southern Hemisphere was unusually warm in our lower stratosphere (LS) temperature product, while the Northern Hemisphere was unusually cool. This led me to look at the tropical results for our mid-troposphere (MT) and ‘tropopause’ (TP) products, which in the tropics usually track each other. A scatterplot of them revealed September 2019 to be a clear outlier, that is, the TP temperature anomaly was too cool for the MT temperature anomaly.

So, John put a notice on his monthly global temperature update report, and I added a notice to the top of my monthly blog post, that we suspected maybe one of the two satellites we are currently using (NOAA-19 and Metop-B) had problems.

As it turns out, there were no problems with the data. Just an unusual regional weather event that produced an unusual global response.

RECORDS CONTINUE TO FALL ACROSS THE NW + MORE HISTORIC COLD SET TO ENGULF ALL OF NORTH AMERICA BY OCT 10

by Cap Allon, October 3, 2019 in Electroverse


This weekend will mark the final phase of a major winter storm that ravaged the NW U.S. bringing whipping winds to the Flathead Valley, feet of snow along the Continental Divide and record-breaking/challenging temps for all.

A new all-time daily record low temperature was set in Kalispell, Montana on Wednesday, October 02 as the mercury plunged into the teens across the region.

The weather station at Glacier Park International Airport recorded a low of 19F (-7.2C) at 5 AM which busted the dates previous record low of 21F (-6.1C) set back in 1999.

Great Falls, Montana registered a record-smashing 9F (-12.8C) on Tue, Oct 01, according to the NWS, which annihilated the previous daily low of 22F (-5.6C) set back in 1959.

Additionally, areas to the northwest also saw record low daily temperatures on Tuesday as both Cut Bank and Browning comfortably surpassed their previous cold records from 1950.

And further south, crossing a few state lines into California, temperatures at Sacramento Executive Airport dropped to 42F (5.6C) early Wednesday morning, surpassing the old record of 43F (6.1C) set in 1971. Meaning that in less than a week, Sacramento has now set multiple all-time record lows; on Sunday, both downtown Sacramento and the airport set record lows of 45F (7.2C) and 46F (7.8C) respectively.