by James Temple, October 4, 2018 in MITTechnologyReview
Wind power is booming in the United States.
It’s expanded 35-fold since 2000 and now provides 8% of the nation’s electricity. The US Department of Energy expects wind turbine capacity to more than quadruple again by 2050.
But a new study by a pair of Harvard researchers finds that a high amount of wind power could mean more climate warming, at least regionally and in the immediate decades ahead. The paper raises serious questions about just how much the United States or other nations should look to wind power to clean up electricity systems.
…
Highlights
Wind power reduces emissions while causing climatic impacts such as warmer temperatures
Warming effect strongest at night when temperatures increase with height
Nighttime warming effect observed at 28 operational US wind farms
Wind’s warming can exceed avoided warming from reduced emissions for a century
More than 100 leading scholars from 12 countries have issued a report contending “the global war on fossil fuels … was never founded on sound science or economics” and urging the world’s policymakers to “acknowledge this truth and end that war.”
The Nongovernmental International Panel on Climate Change (NIPCC), an independent organization founded in 2003 to fact-check the work of the United Nations on the issue of climate change, today released the Summary for Policymakers of Climate Change Reconsidered II: Fossil Fuels. The 27-page Summary provides an early look at a 1,000-page report expected to be released on December 4 at a climate science symposium during the United Nations Conference of the Parties (COP-24) in Katowice, Poland.
…
Among the findings reported in the Summary for Policymakers:
…
Reducing fossil fuel use to achieve dramatic reductions in carbon dioxide emissions would inflict tremendous economic hardship. Reducing greenhouse gases to 90 percent below 1990 levels by 2050 would require a 96% reduction in world GDP, reducing per-capita GDP to $1,200 from $30,600 now forecast. Per-capita income would be at about the level it was in the United States and Western Europe in about 1820 or 1830, before the Industrial Revolution.
95% of the model runs predicted more warming than the RSS data since 1988… And this is the Mears-ized RSS data, the one in which the measurements were influenced to obtain key information (erase the pause and more closely match the surface data).
Their “small discrepancy” would be abject failure in the oil & gas industry.
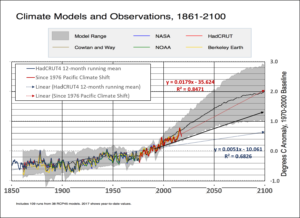
The observed warming has been less than that expected in a strong mitigation scenario (RCP4.5).
Output of 38 RCP4.5 models vs observations. The graph is originally from Carbon Brief. I updated it with HadCRUT4, shifted to 1970-2000 baseline, to demonstrate the post-El Niño divergence.
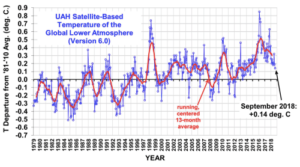
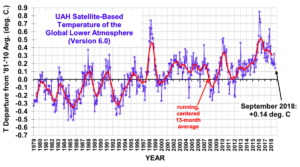
The Version 6.0 global average lower tropospheric temperature (LT) anomaly for September 2018 was +0.14 deg. C, down a little from +0.19 deg. C in August. This was the coolest September in the last 10 years in the global average. — Roy Spencer, 2 October 2018
by Anne Dolhein, 2 october 2018 in Reinformation.TV
La NASA – peu suspecte de climato-scepticisme – s’appuie sur de nouveaux résultats d’observations de température aux confins de l’atmosphère terrestre pour annoncer un refroidissement notable dans ces zones, lié à l’un des minima solaires les plus importants de l’ère spatiale. Il s’agit très clairement d’un refroidissement climatique entraîné par la baisse de l’activité solaire, confirmant le rôle important sinon prépondérant du soleil sur les variations de température de la planète.
« Nous constatons une tendance au refroidissement », vient ainsi de déclarer Martin Mlynczak, chercheur principal associé du centre de recherches Langley de la NASA. « Très loin de la surface de la terre, près du bord de l’espace, notre atmosphère perd de l’énergie calorifique. Si les tendances actuelles se poursuivent, on pourrait bientôt atteindre un record de froid pour notre ère spatiale », a-t-il affirmé.
by Uzbek, 11 septembre 2018 in Climat,Environnemen,Energie
Trois nouvelle études publiées en août 2018 apportent un éclairage nouveau sur le cycle du carbone. La première, publiée dans la revue Nature [1] montre que le taux de croissance du CO2 dans l’atmosphère est très sensible aux changements observés dans le stockage de l’eau terrestre. Les deux autres publiées respectivement dans Nature Geoscience [2] et dans Nature [3] montrent une tendance à l’augmentation du puits de carbone terrestre grâce notamment aux modifications de l’usage des sols sous l’influence des activités humaines.
by Indriani Roy, September28, 2018 in FrontiersinEarthScience
College of Engineering, Mathematics and Physical Sciences, University of Exeter, Exeter, United Kingdom
The puzzle of recent global warming trend slowdown has captured enough attention, though the underlying cause is still unexplained. This study addresses that area segregating the role of natural factors (the sun and volcano) to that from CO2 led linear anthropogenic contributions. It separates out a period 1976–1996 that covers two full solar cycles, where two explosive volcanos erupted during active phases of strong solar cycles. The similar period also matched the duration of abrupt global warming. It identifies that dominance of Central Pacific (CP) ENSO and associated water vapor feedback during that period play an important role. The possible mechanism could be initiated via a preferential alignment of NAO phase, generated by explosive volcanos. Inciting extratropical Rossby wave to influence the Aleutian Low, it has a modulating effect on CP ENSO. Disruption of Indian Summer Monsoon and ENSO during the abrupt warming period and a subsequent recovery thereafter can also be explained from that angle. Interestingly, CMIP5 model ensemble, and also individual models, fails to comply with such observation. It also explores possible areas where models miss important contributions due to natural drivers.
Globally, the coolest September in the last 10 years.
The Version 6.0 global average lower tropospheric temperature (LT) anomaly for September, 2018 was +0.14 deg. C, down a little from +0.19 deg. C in August:
by P. Gosselin, September 30, 2018 in NoTricksZone
We have to face it: The West has done our planet no favor by moving industrial production and manufacturing to China. Trump is right, many of factories and industries are better back home, even if it means paying a bit more for products.
Not only does the China use the oceans as a global dump for much of its plastic trash, the country now is gearing up to turn parts of the planet into a toxic solar panel waste dump.
According to French science magazine Futura here, we are looking at a “solar panel time bomb”.
Futura describes how China is installing “gigantic” solar panel farms in remote places like Tibet and how 30 years from now the country will have “mountains of solar panels reaching their end of their lives and that nothing is planned for their collection and recycling.”
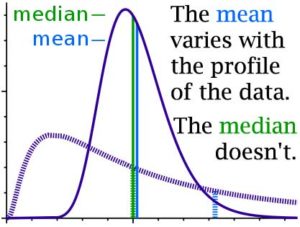
In the comment section of my most recent essay concerning GAST (Global Average Surface Temperature) anomalies (and why it is a method for Climate Science to trick itself) — it was brought up [again] that what Climate Science uses for the Daily Average temperature from any weather station is not, as we would have thought, the average of the temperatures recorded for the day (all recorded temperatures added to one another divided by the number of measurements) but are, instead, the Daily Maximum Temperature (Tmax) plus the Daily Low Temperature (Tmin) added and divided by two. It can be written out as (Tmax + Tmin)/2.
Anyone versed in the various forms of averages will recognize the latter is actually the median of Tmax and Tmin — the midpoint between the two …
… “Wildfires are such a huge source of aerosol in the atmosphere with a combination of cooling and warming properties, that understanding the delicate balance can have profound consequences on how accurately we can predict future changes,” says Claudio Mazzoleni, professor of physics, and one of the authors of the paper.
As wildfires increase in size and frequency in the world’s arid regions, more aerosol particles could be injected into the free troposphere where they are slower to oxidize, contributing another important consideration to the study of atmospheric science and climate change.
by David Hilton, September 30, 2018 in EndtimesHerald
By the year 2000, according to the 1989 story:
Coastal flooding and crop failures would create an exodus of ″eco- refugees,′ ′ threatening political chaos, said Noel Brown, director of the New York office of the U.N. Environment Program, or UNEP.
He said governments have a 10-year window of opportunity to solve the greenhouse effect before it goes beyond human control.
Well we’re here in 2018, Noel, it’s nearly October, and I’m sitting here in South-East Queensland at midday in a jacket because it’s cold.
Arctic sea ice is proving remarkably reluctant to enter its appointed ‘death throes’, despite the usual suspects having already planned the funeral. Climate Change Anxiety Disorder, it turns out, is yet to impose its angst on the actual climate, no matter how hard the BBC tries to make it.
Ceux qui me font l’honneur (et le plaisir) de suivre ma page Facebook « belgotopia » profitent de ma rubrique : « Dans l’hilarante série : les délires climatiques », qui distille à doses homéopathiques la litanie des épouvantables conséquences du réchauffement (changement) climatique qui nous menace.
Celles-ci sont extraites soit de médias, soit de revues scientifiques dont on ne peut décemment mettre le sérieux en doute, et contribuent à entretenir la peur parmi nos populations. Et ces études, ne l’oublions pas, sont financées par l’argent public, soit le vôtre et le mien.
Les cent premières furent rassemblées dans un billet, que je vous engage vivement à (re)consulter :
Voici donc les cinquante suivantes, et j’en ai encore un nombre considérable en réserve, car nous sommes soumis à une véritable avalanche de constatations ou de prédictions terrifiantes !
Extreme weather events, mostly drought are considered, but floods as well, correspond to solar minima in more than 75% (18 out of 24 of the cases known).
Current concentrations of carbon dioxide cannot be invoked for extreme weather in the historical past.
The sun controls the climate of the Earth.
During summer it is inevitable that lightning storms ignite fires and produce heavy rain. The intensity of what we have come to call extreme weather is magnified by standing Rossby waves.
Sunspot research tends to emphasize sunspot peaks and sunspot numbers; more may be gained by evaluating trough events and peak and trough frequencies.
“Germany’s Federal Audit Office has accused the federal government of having largely failed to manage the transformation of Germany’s energy systems.”
“A little more than a year before Germany’s climate-policy “milestone 2020”, the auditing body has concluded a catastrophic assessment of the government’s energy policy. Germany would miss its targets for both reducing greenhouse gas emissions and primary energy consumption as well as for increasing energy productivity and the share of renewable energy in transport. At the same time, policy makers had burdened the nation with enormous costs.”
The audit further concluded that the program is a monumental bureaucratic nightmare where “The Federal Government, incidentally, does not have an overall grasp of the costs or any transparency in this respect.”
In media interviews or discussions with the public, the most frequent opening challenge is; “But don’t 97% of scientists agree?” It is usually said obliquely to imply that you know a lot, and I don’t understand, but I assume you are wrong because you are in the minority. I don’t attempt to refute the statistics. Instead, I explain the difference in definitions between science and society. Then I point out that the critical 97% figure is that at least 97% of scientists have never read the claims of the IPCC Reports. How many people reading this article have read all the IPCC Reports, or even just one of them? If you have, it is probably the deliberately deceptive Summary for Policymakers (SPM). Even fewer will have read the Report of Working Group I: The Physical Science Basis. Naively, people, especially other scientists, assume scientists would not falsify, mislead, misrepresent, or withhold information. It is worse, because the IPCC deliberately created the false claim of consensus.
These results come from the SABER instrument onboard NASA’s TIMED satellite. SABER monitors infrared emissions from carbon dioxide (CO2) and nitric oxide (NO), two substances that play a key role in the energy balance of air 100 to 300 kilometers above our planet’s surface. By measuring the infrared glow of these molecules, SABER can assess the thermal state of gas at the very top of the atmosphere–a layer researchers call “the thermosphere.”
When the thermosphere cools, it shrinks, literally decreasing the radius of Earth’s atmosphere. This shrinkage decreases aerodynamic drag on satellites in low-Earth orbit, extending their lifetimes. That’s the good news. The bad news is, it also delays the natural decay of space junk, resulting in a more cluttered environment around Earth.
by J. Hopkins, September 28, 2018 in ClimateChageDispatch
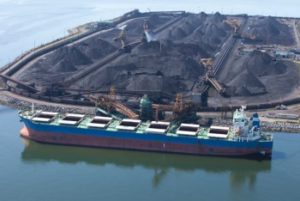
Foreign markets are lining up to purchase American coal by widening amounts as U.S. coal consumption reaches its lowest level in more than three decades.
Power plants’ consumption of coal dropped to 298 million short tons in the first half of 2018, a sharp fall from 312 million in the same period last year, according to a Thomson Reuters report.
This marks the lowest level of consumption since 1983 and a reflection of the coal industry’s declining status as natural gas continues to grow.
Coal-fired generation diminished by 32 billion kilowatt-hours during the first six months of 2018.
Contrary to what has been announced, Cañete has not submitted the proposal to the EU member states, the German Press Agency in Brussels has learned. The idea was met with opposition by, among others, German Chancellor Angela Merkel and the German industry. Other EU countries also rejected it. Global climate policy is in crisis since US President Donald Trump quit the Paris climate agreement of 2015.
The briefing, published by the Global Warming Policy Foundation, focuses on the output of the BBC and the Guardian, and outlines many examples of biased coverage.
However, it wasn’t always this way, as author Andrew Montford explains:
“When shale gas first came on the scene, coverage was very positive: gas was seen as a low-carbon alternative to coal. It was only when it looked as though it would price renewables out of the market that the scare stories and bias began”.
For the study, published this week in the journal Restoration Ecology, researchers installed 11,000 small, hexagonal structures called “spiders” across 5 acres of reef in the center of Indonesia’s Coral Triangle. Coral diversity is the highest on Earth in that region but is threatened by human activity, including overfishing, pollution and climate change.
Between 2013 and 2015, researchers attached coral fragments to the structures, which also stabilized rubble and allowed for water to flow through freely.
A CORAL SUCCESS STORY
Live coral cover on the structures increased from less than 10 percent to more than 60 percent. This was more than what was reported for reefs in many other areas of the Coral Triangle, at a cost of about $25 per square meter.
A new study suggests that plate tectonics — a scientific theory that divides the earth into large chunks of crust that move slowly over hot viscous mantle rock — could have been active from the planet’s very beginning. The new findings defy previous beliefs that tectonic plates were developed over the course of billions of years.
The paper, published in Earth and Planetary Science Letters, has important implications in the fields of geochemistry and geophysics. For example, a better understanding of plate tectonics could help predict whether planets beyond our solar system could be hospitable to life.
“Plate tectonics set up the conditions for life,” said Nick Dygert, assistant professor of petrology and geochemistry in UT’s Department of Earth and Planetary Sciences and coauthor of the study. “The more we know about ancient plate tectonics, the better we can understand how Earth got to be the way it is now.”
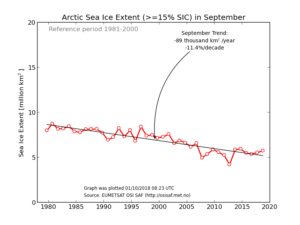
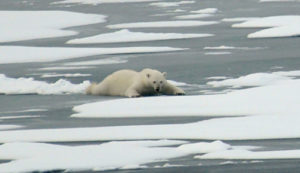
We’ve hit the seasonal Arctic sea ice minimum for this year, called this morning by US NSIDC for 19th and 23rd of Septmeber: 4.59 mkm2, the same extent as 2008 and 2010. This is not a “ho-hum” year for polar bears: it means that since 2007, they have triumphed through 10 or 11 years1 with summer ice coverage below 5.0 mkm2 — levels that in 2007 were expected to cause catastrophic declines in numbers.
…
La géologie, une science plus que passionnante … et diverse