Science is hard. Some easy problems you can solve by hard work, if you are in the right place at the right time and have the right skills. Hard problems take the combined effort of multiple groups looking at the problem, publishing results and finding fault with eachother’s work, until hopefully no-one can find any more problems. When problems are hard, you may have to publish something that even you don’t think is right, but that might advance the discussion.
The calculation of an unbiased sea surface temperature record is a hard problem. Historical sea surface temperature observations come from a variety of sources, with early records being measured using wooden, canvas or rubber buckets (figure 1), later readings being taken from engine room intakes or hull sensors, and the most recent data coming from drifting buoys and from satellites.
A new study published Jan. 8 in the journal Nature Geoscience reveals that strong El Nino events can cause significant ice loss in some Antarctic ice shelves while the opposite may occur during strong La Nina events.
by Paul Homewood, January 8, 2018 in NotaLotofPeopleKnowThat
The England & Wales Precipitation Series has now been updated for last year.
Precipitation totalled 952mm during the year, slightly above the series average of 918mm. In ascending order, 2017 ranked 158th.
There seems to be little evidence of any real trends. Whatever trend can be winkled out of the numbers will likely be too small to notice, and swamped by the natural variability in the data.
The wettest years remain 1872 and 1768. The driest were 1788 and 1921.
Short summary: scientists sought political relevance and allowed policy makers to put a big thumb on the scale of the scientific assessment of the attribution of climate change.
Climate Myths: We keep reading about how the extreme weather of 2017 is the “new normal” thanks to global warming — even if the weather in question is frigid air. But the data don’t show any trend in extreme weather events in the U.S. for decades. Science, anyone?
The geopolitical risks to the United States’ oil supply are the lowest since the early 1970s, due to fracking, climate action and a more diverse global supply, according to a new paper. America’s energy prosperity contrasts with a more fraught period for energy-exporting countries where geopolitical challenges have been compounded by fiscal stress and rising domestic energy demand, the authors said.
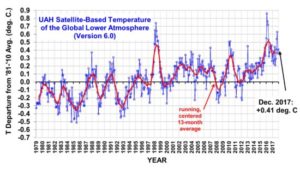
2017 Third Warmest in the 39-Year Satellite Record
Global Satellite Monitoring of Temperature Enters its 40th Year
The Version 6.0 global average lower tropospheric temperature (LT) anomaly for December, 2017 was +0.41 deg. C, up a little from the November, 2017 value of +0.36 deg. C
U.S. Secretary of the Interior Ryan Zinke today announced the next step for responsibly developing the National Outer Continental Shelf Oil and Gas Leasing Program (National OCS Program) for 2019-2024, which proposes to make over 90 percent of the total OCS acreage and more than 98 percent of undiscovered, technically recoverable oil and gas resources in federal offshore areas available to consider for future exploration and development. By comparison, the current program puts 94 percent of the OCS off limits. In addition, the program proposes the largest number of lease sales in U.S. history.
These 485 new papers affirm the position that there are significant limitations and uncertainties inherent in our understanding of climate and climate changes, emphasizing that climate science is not settled.
by M Bastach, January 5, 2017 in ClimateChangeDispatch
Record snowfall, a “bomb cyclone” and cold Arctic air have once again stirred up the debate over global warming’s impact on winter weather.
Some climate scientists are pointing the finger at manmade global warming as a culprit behind recent wintry weather, but there’s not a lot of evidence or agreement that global warming is currently driving extreme cold and snow (…)
Contrary to expectations, climate scientists continue to report that large regions of the Earth have not been warming in recent decades.
According to Dieng et al. (2017), for example, the global oceans underwent a slowdown, a pause, or even a slight cooling trend during 2003 to 2013. This undermines expectations from climate models which presume the increase in radiative forcing from human CO2 emissions should substantially increase ocean temperatures.
The authors indicate that the recent trends in ocean temperatures “may just reflect a 60-year natural cycle“, the AMO (Atlantic Multidecadal Oscillation), and not follow radiative forcing trends.
by Thomas Heath, December 31, 2017 in Washington Post
U.S. crude oil production is flirting with record highs heading into the new year, thanks to the technological nimbleness of shale oil drillers .
The current abundance has erased memories of 1973 gas lines, which raised pump prices dramatically, traumatizing the United States and reordering its economy. In the decades since, presidents and politicians have made pronouncements calling for U.S. energy independence.
Global Temperature Report: December 2017 Global climate trend since Nov. 16, 1978: +0.13 C per decade December temperatures (preliminary)
Global composite temp.: +0.41 C (about 0.74 degrees Fahrenheit) above 30-year average for December.
Northern Hemisphere: +0.50 C (about 0.90 degrees Fahrenheit) above 30-year average for December.
Southern Hemisphere: +0.33 C (about 0.59 degrees Fahrenheit) above 30-year average for December.
Tropics: +0.26 C (about 0.47 degrees Fahrenheit) above 30-year average for November.
Activity in Pennsylvania’s gas fields slowed in recent years amid low prices, but operators ramped up drilling in 2017, and they’re expecting to drill even more in the new year.
Other countries are failing to meet their targets, but we’re not only achieving them, we’re overdoing it. And this is despite our obvious handicaps: like that we have rapid population growth, are further from everywhere and anywhere* except for Antarctica, and we’re the largest coal exporter in the world;
The indefatigable Roy Spencer at the University of Alabama at Huntsville is the first to declare the global temperature anomaly for December 2017. As Fig. 1 shows, in the 39 years 1 month from December 1978 to December 2017, the planet has warmed by half a Celsius degree. But that is equivalent to 1.28 C°/century, or little more than one-third of the 3.3 C°/century predicted with “substantial confidence” by IPCC in 1990 and also by the fifth-generation general-circulation models of the Climate Model Intercomparison Project in 2013.
Determining magnitudes of sea surface temperature variability is important for attributing past and predicting future changes in climate, and generally requires the use of proxies to constrain multidecadal and longer timescales of variability. We report a multiproxy estimate of sea surface temperature variability that is consistent between proxy types and with instrumental estimates but strongly diverges from climate model simulations toward longer timescales. At millennial timescales, model−data discrepancies reach two orders of magnitude in the tropics, indicating substantial problems with models or proxies, or both, and highlighting a need to better determine the variability of sea surface temperatures.
We evaluate different hypotheses of the origin of the Little Ice Age, focusing on the long-term response of Arctic sea ice and oceanic circulation to solar and volcanic perturbations. We analyze the Last Millennium Ensemble of climate model simulations carried out with the Community Earth System Model at the National Center for Atmospheric Research. We examine the duration and strength of volcanic perturbations, as well as initial and boundary conditions such as the phase of the Atlantic Multidecadal Oscillation, and their impact on decadal to multi-centennial perturbations of the cryospheric, oceanic, and atmospheric components of the climate system.
In the last 12 months, 150 graphs from 122 peer-reviewed scientific papers have been published that undermine the popularized conception of a slowly cooling Earth temperature history followed by a dramatic hockey-stick-shaped uptick, or an especially unusual global-scale warming during modern times.
Yes, some regions of the Earth have been warming in recent decades or at some point in the last 100 years.
Some regions have been cooling for decades at a time.
And many regions have shown no significant net changes or trends in either direction relative to the last few hundred to thousands of years.
Succinctly, then, scientists publishing in peer-reviewed journals have increasingly affirmed that there is nothing historically unprecedented or remarkable about today’s climate when viewed in the context of long-term natural variability.
The following (partial) list has been organized by geographical region
The East Antarctic Ice Sheet locks away enough water to raise sea level an estimated 53 meters (174 feet), more than any other ice sheet on the planet. It’s also thought to be among the most stable, not gaining or losing mass even as ice sheets in West Antarctica and Greenland shrink.
At the excellent Curious Wavefunction blog of Ash Jogalekar, there’s an article (posted last year) about Freeman Dyson, who is 94 today.
He disapproves of faith in computer models and of the zealous dogmatism exhibited by some climate change activists, and both these points are extremely well taken. Ultimately Dyson is saying something simple; that science progresses only when there is a critical mass of skeptics challenging the status quo
Meteorologist Joe Bastardi warned of a cold snap gripping the Eastern US many weeks ago, in October, at his Weatherbell Analytics site, which I visit almost daily.
Today it’s all over the news: The Great Freeze of 2017 is smashing through the entire North American East, bringing with it a wave of record temperatures.
More than 220 million Americans are preparing for the coldest New Year in living memory as the cold snap that has swept across the northern states prompts chaos across the country.
Temperatures atop the highest peak in the north-east, Mount Washington, hit a shocking -37 degrees celsius – breaking the previous record at the Mount Washington Observatory in New Hampshire of -35C which was set in 1933.
I got to thinking about the records of the sea level height taken at tidal stations all over the planet. The main problem with these tide stations is that they measure the height of the sea surface versus the height of some object attached to the land … but the land isn’t sitting still. In most places around the planet the land surface is actually rising or falling, and in some places, it’s doing so at a surprising rate, millimeters per year.
Tales of doom and gloom about polar bears reflect what some people think might happen in the future, not what is happening right now. Currently, polar bears are doing just fine despite the low summer sea ice coverage they’ve experienced since 2007 (Crockford 2017a; York et al. 2016). In other words, there has been no global population decline as predicted: officially, the numbers were 22,000-31,000 (or 26,500 average) in 2015 (Wiig et al. 2015) but about 28,500 when estimates published since then are included (Aars et al. 2017; Dyck et al. 2017; Matishov et al. 2014; SWG 2016), up from about 22,500 in 2005).
La géologie, une science plus que passionnante … et diverse