by Sherrington G., May 22, 2020 in WUWT
The global problem.
In response to the threat of a global viral epidemic, countries announced lockdowns at various times near 25th March 2020. https://en.wikipedia.org/wiki/COVID-19_pandemic_lockdowns
This caused a reduction of industrial activity and hence a lower rate of emission of anthropogenic carbon dioxide to the atmosphere. An example of reduction from aircraft is given at https://en.wikipedia.org/wiki/Impact_of_the_COVID-19_pandemic_on_aviation
Numerous sources asked if the reduction in CO2 emission could be detected in analysis of air for CO2 content, which had been done for decades. Early questions and speculative answers came from many sources including –
https://www.esrl.noaa.gov/gmd/ccgg/covid2.html
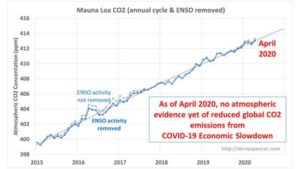
By late May 2020, the emerging consensus was that the reduction would be too small to show at the main measuring stations such as Mauna Loa, Hawaii.
…