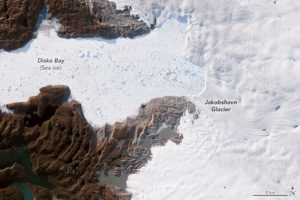
by NASA (Earth Observatory), June 6, 2019 in NASA.E.Observ.
Jakobshavn Glacier in western Greenland is notorious for being the world’s fastest-moving glacier. It is also one of the most active, discharging a tremendous amount of ice from the Greenland Ice Sheet into Ilulissat Icefjord and adjacent Disko Bay—with implications for sea level rise. The image above, acquired on June 6, 2019, by the Operational Land Imager (OLI) on Landsat 8, shows a natural-color view of the glacier.
Jakobshavn has spent decades in retreat—that is, until scientists observed an unexpected advance between 2016 and 2017. In addition to growing toward the ocean, the glacier was found to be slowing and thickening. New data collected in March 2019 confirm that the glacier has grown for the third year in a row, and scientists attribute the change to cool ocean waters.
“The third straight year of thickening of Greenland’s biggest glacier supports our conclusion that the ocean is the culprit,” said Josh Willis, an ocean scientist at NASA’s Jet Propulsion Laboratory and principal investigator of the Oceans Melting Greenland (OMG) mission
…
…
by Willis Eschenbach, January 18, 2020 in WUWT
…
Folks are interested in why the temperature of the planet changes over time. That’s at the center of modern climate science. My theory, on the other hand, arose from my being interested in a totally different question about climate—why is the temperature so stable? For example, over the 20th Century, the temperature only varied by ± 0.3°C. In the giant heat engine that is the climate, which is constantly using solar energy to circulate the oceans and the atmosphere, this is a variation of 0.1% … as someone who has dealt with a variety of heat engines, I can tell you that this is amazing stability. The system is ruled by nothing more solid than waves, wind, and water. So my question wasn’t why the climate changes as it does.
My question was, why is the climate so stable?
And my answer is, there are a host of what are called “emergent phenomena” that arise when local temperatures go above some local threshold. They include the timing and strength of the daily emergence of the cumulus cloud field in the tropics; the development of thunderstorms; the emergence of dust devils when temperatures get hot; the action of the El Nino/La Nina pump moving warm water to the poles; and various “oscillations” like the Pacific Decadal Oscillation.
These emergent phenomena arise out of nowhere, last for some length of time, and then disappear completely. And acting together, they all work to prevent both the overcooling and the overheating of the planet. And as mentioned above, I say that these phenomena acted to reduce the length and the depth of the effect of the Pinatubo volcano. See my post called “When Eruptions Don’t” for another look at how the climate system responds to a decrease in incoming solar energy due to volcanic eruptions.
I originally published this theory in the journal Energy and Environment. I followed that up with a posting of the same ideas here at Watts Up With That in a post called The Thermostat Hypothesis.
…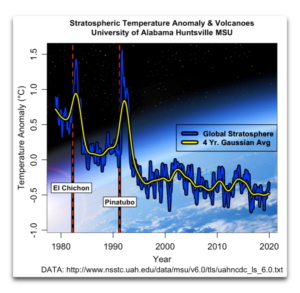
Figure 2. Global stratospheric temperatures measured from space.
…
by Cap Allon, January 18, 2020 in Electroverse
A secret code unsolved for 1200 years has finally been cracked — the mysterious inscription on famed Viking relic the Rök stone (or Rökstenen) reveals the warrior nation feared the return of the deadly ‘Late Antique Little Ice Age’ which wiped out more than HALF of Scandinavia — the stone speaks of an enduring battle against extreme cold weather in the sixth century.
According to a study led by Per Holmberg, a professor of Swedish language at the University of Gothenburg, the text is telling a tale of light and darkness, warmth and cold, and it expresses a deep fear of a coming climate disaster.
“The main theme is apparently the Sun, or the rhythm of light”, Holmberg explained.
Of the nine riddles contained on the stone, five of them have the answer “the Sun.”
…

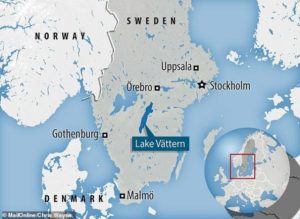
The stone was erected in the late 800s near the lake Vattern in south central Sweden.
…
by Roy Spencer, January 15, 2020 in WUWT/Ch.Rotter
The increasing global ocean heat content (OHC) is often pointed to as the most quantitative way to monitor long-term changes in the global energy balance, which is believed to have been altered by anthropogenic greenhouse gas emissions. The challenge is that long-term temperature changes in the ocean below the top hundred meters or so become exceedingly small and difficult to measure. The newer network of Argo floats since the early 2000s has improved global coverage dramatically.
A new Cheng et al. (2020) paper describing record warm ocean temperatures in 2019 has been discussed by Willis Eschenbach who correctly reminds us that such “record setting” changes in the 0-2000 m ocean heat content (reported in Zettajoules, which is 10^^21 Joules) amount to exceedingly small temperature changes. I calculate from their data that 2019 was only 0.004 0.009 deg. C warmer than 2018.
Over the years I have frequently pointed out that the global energy imbalance (less than 1 W/m2) corresponding to such small rates of warming is much smaller than the accuracy with which we know the natural energy flows (1 part in 300 or so), which means Mother Nature could be responsible for the warming and we wouldn’t even know it.
The Cheng (2017) dataset of 0-2000m ocean heat content changes extends the OHC record back to 1940 (with little global coverage) and now up through 2019. The methodology of that dataset uses optimum interpolation techniques to intelligently extend the geographic coverage of limited data. I’m not going to critique that methodology here, and I agree with those who argue creating data where it does not exist is not the same as having real data. Instead I want to answer the question:
If we take the 1940-2019 global OHC data (as well as observed sea surface temperature data) at face value, and assume all of the warming trend was human-caused, what does it imply regarding equilibrium climate sensitivity (ECS)?
…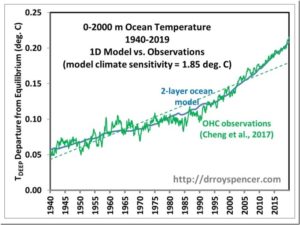
Fig. 1. Deep-ocean temperature variations 1940-2019 explained with a 2-layer energy budget model forced with RCP6 radiative forcing scenario and a model climate sensitivity of 1.85 deg. C. The model also matches the 1940-2019 and 1979-2019 observed sea surface temperature trends to about 0.01 C/decade. If ENSO effects are not included in the model, the ECS is reduced to 1.7 deg. C.
…
La géologie, une science plus que passionnante … et diverse
