Long Term Changes on the Grindelwald Glacier

by P. Homewood, March 28, 2021 in IowaClimSciEducation


The Upper & Lower Grindelwald Glaciers in 1774 by Caspar Wolf

https://en.wikipedia.org/wiki/Caspar_Wolf

HH Lamb’s Climate, History and The Modern World tells us much about the history of Alpine glaciers. For instance, how they advanced rapidly between 800 and 400 BC. They then retreated before advancing again between AD 600 and AD 850, when they may have even reached Little Ice Age maximum extents.

We are probably all familiar with the terrifying glacier advances, which began in the 17thC, following centuries of a much warmer climate. These were catastrophic for anybody living nearby, as farming land was wiped out, and even the land that escaped being overrun was far too cold to farm. As a result, famine was rife in Switzerland and elsewhere, even in cities which relied on the countryside for food.

People living in those days would have been dumfounded to hear that there are some now who are worried that glaciers are getting smaller.


A paper by Zumbuhl et al, published in 2006, offers a detailed history of the Lower Grindelwald glacier, as well as the Mer de Glace in the Mont Blanc region:

Antarctic Sea Ice Grows 2 Million Sq. Km – Area As Big As Saudi Arabia. And: Hamburg Spring Arriving Later…

by P. Gosselin, March 28 in NoTricksZone


Antarctic sea ice grows 2 million square kilometers in 4 years…

It’s hard to back up the statement: Global warming is global. Some places have seen warming over the past 40 years (e.g. Arctic), but other places have not.

Antarctica definitely has not been playing along with the man-made global warming hoax. (Yes, man has caused some of the warming, but not all – and it certainly isn’t catastrophic).

Antarctic sea ice surges

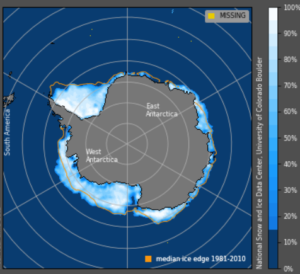
Though Antarctic sea ice fell to a “record minimum” in 2017 – after having reached a “record high” in 2015 – the latest data from the National Snow and Ice Data Centershow sea ice at the South Pole has bounced back robustly since, surging some 500,000 sq km above the mean.

On March 26, 2017, Antarctic sea ice measured 3.055 million sq km. Four years later, sea ice reached 5.103 million sq km. That’s a difference of more than 2 million sq. km., which is an area the size of Saudi Arabia!

No way to ignore natural factors

So why would sea ice grow so quickly? If the ice had disappeared, many would blame it on greenhouse gases – absurd of course. And it would be just as absurd to blame the recent gain on global cooling. Obviously there is a complex array of natural factors at work – factors that climate alarmists consistently have ignored over the past decades.

Here’s the March 26, 2021 satellite photo of Antarctica:

Source: NSIDC

It’s Here: Morano’s New book: ‘Green Fraud: Why The Green New Deal Is Even Worse Than You Think

by M.  Steyn, March 23, 2021 in ClimateDepot


Morano’s probably single-handedly, in a civilian sense, the guy (other than me, of course) doing a better job of ringing the bells alarming people of what’s going on here.” Rush Limbaugh

“This is a must-read book that shows how the Green New Deal is dangerous, impractical, misguided, and guaranteed to fail with disastrous results for the American people.”  —Sean Hannity, host of Hannity on Fox News

“’Green Fraud’ is the ultimate guidebook to exposing and fighting this Marxist plan masquerading as environmental policy.”  —Mark R. Levin, author and nationally syndicated TV and radio broadcaster

Also see Daily Signal’s interview w/ Morano: “Green Fraud,” a new book from @ClimateDepot’s Marc Morano, exposes far-reaching implications of the #GreenNewDeal & what freedom-loving #Americans can do. 

Here is a promotional video from the publisher on the book: https://twitter.com/Regnery/status/1370512451322716160

“If you care about America’s future, read this book.”—Mark Levin

“A must-read book that shows how the Green New Deal is dangerous, impractical, misguided, and guaranteed to fail with disastrous results for the American people.”—Sean Hannity

A New Lockdown to “Save” the Climate

That’s what’s in store for us if Alexandria Ocasio-Cortez and the Democrats pass their radical climate plan—the Green New Deal.

It is packed with guarantees so completely irrelevant to the problem it purports to “solve” (like “free college” and incomes for everyone “unable or unwilling to work”) that even its boosters have admitted it’s not really about the climate.

The intrepid Marc Morano, author of the bestselling Politically Incorrect Guide to Climate Change, breaks down the science and the politics to expose the truth about the Green New Deal:

• The science is settled: copious evidence—and prominent defections from the “climate consensus”—make clear we are not facing a man-made climate disaster

• “Climate change” is the perfect Trojan horse for the socialist agenda of the Left

• Fossil fuels lifted the West out of poverty—but our elites now want to deny them to the world’s poor

• The Green New Deal is on a collision course with self-government and our fundamental rights

Climate change has already been “solved” multiple times over the past two decades—with highly touted international agreements—and yet it never goes away as an excuse for leftist policies that will cripple our economy, impoverish the world, and take away our freedoms.

Packed with telling statistics, damning quotations, and real science, Green Fraud is your source for all the facts you need to understand—and resist—the threat.

End of Snow? Finland Thinks Their Winter Snow Might Not Melt This Summer

by E. Worall, March 23, 2021 in WUWT


Finland thinks that piles of snow accumulated from road clearing this year are so large, some of the snow will still be frozen when winter returns.

In Finnish capital region, snow piles built up this winter may not melt during summer

FINLAND  15 MARCH 2021

THE CAPITAL REGION of Finland has received so much snow this winter that the metres-high piles hauled to designated snow dump areas may not melt during the course of the summer, reports Helsingin Sanomat.

In Uusimaa, for example, the amount of snow was 1.7 times higher than last year in January, according to Foreca.

Helsingin Sanomat on Friday wrote that the piles of snow stand almost as high as 20 metres at the dump area in Herttoniemi, eastern Helsinki. In Maununneva, a north-western neighbourhood of the city, lorries have dumped roughly 16,000 loads of snow at the dump area, revealed Tero Koppinen, a production manager at Helsinki City Construction Services (Stara).

The snow ploughed from roads forms a large structure, nicknamed by the locals as the Alps, also at the only snow dump area in Espoo, in Vanttila.

Read more: https://www.helsinkitimes.fi/finland/finland-news/domestic/18867-snow-piles-built-up-this-winter-may-not-melt-during-summer-in-finnish-capital-region.html

The Fins mostly seem to be treating this as a joke, maybe a chance to cool off on warm Summer days. And most likely this event will have no long term consequences.

Fake Invisible Catastrophes and Threats of Doom — Patrick Moore’s outstanding new book

by Dr. J. Lehr, March 17, 2021 in CFACT


There have been dozens of good books written in the past decade telling the true stories countering the incessant lies of alarmists blaming impending environmental disasters on carbon dioxide emissions.

None have been better than the newest contribution by Patrick Moore and certainly none as up to date as this just published contribution to real science. We all know by now that Patrick co-founded Greenpeace. It was in an effort to stop underground hydrogen bomb testing and later to save whales and Harp seals. He was still studying for his degree in Ecology at the University of British Columbia (UBC). Fifteen years later when Greenpeace became a money machine in the war to scare the public with one environmental lie after another, he resigned and became their public enemy number one. The tipping point was the organization’s initiation of a campaign to ban chlorine, the most important of all 94 natural elements for both public health and medicine.

In many ways his newest book can be seen as eleven brief books teaching the important facts and research on the major environmental issues of our time. They include in addition to the finest argument against human-caused climate change, dying trees in Africa, the Great Barrier Reef, Polar Bears, Species Extinction, the Great Pacific Garbage Patch, Genetically Modified Food, Nuclear Radiation, Forest Fires, Ocean Acidification, and the faked deaths of Walruses falling from cliffs in Russia.

What sets this outstanding book apart from most is that while Moore is an academic with a Ph.D. in ecology from UBC (which he describes as the study of how all components of our world interrelate and interact), he has a somewhat unique ability to dive into the weeds on each subject and emerge with a basic understanding of each issue for the reader. While I have read a great deal on all his topics, I was amazed how much I learned, and you will be too.Fake Invisible Catastrophes and Threats of Doom -- Patrick Moore's outstanding new book

He tells us what most of us realize today, that to many if not most activists “the people are a kind of afterthought to be considered only once the perfect environmental policy has been identified, without regard for how negative the impact is on humanity”. The push to phase out all fossil fuel consumption in the next 30 years he says, “is the biggest threat to civilization in the world today.”

In this 204-page 11-chapter book, as you would imagine, its longest chapter (49 pages) Climate of Fear and Guilt, is devoted to climate change. Most readers have read numerous arguments against the well-known fraud of human caused global warming. You may not want to read another. I can tell you, however, that no one has done it better. This well illustrated chapter manages to add common sense ways to convince your friends of the absurd effort by our new administration to convince you to give up your freedoms in order to save the world. He deals with 19 separate crazy predictions laid at the feet of climate change. He skewers them all with excellent technical references. While it is worth the price of the book, it is the less well-known information in the other chapters that produce a truly outstanding book.

Claim: Melting glaciers contribute to Alaska earthquakes

by UNIVERSITY OF ALASKA FAIRBANKS, March 15, 2021 in WUWT


In 1958, a magnitude 7.8 earthquake triggered a rockslide into Southeast Alaska’s Lituya Bay, creating a tsunami that ran 1,700 feet up a mountainside before racing out to sea.

Researchers now think the region’s widespread loss of glacier ice helped set the stage for the quake.

In a recently published research article, scientists with the University of Alaska Fairbanks Geophysical Institute found that ice loss near Glacier Bay National Park has influenced the timing and location of earthquakes with a magnitude of 5.0 or greater in the area during the past century.

Scientists have known for decades that melting glaciers have caused earthquakes in otherwise tectonically stable regions, such as Canada’s interior and Scandinavia. In Alaska, this pattern has been harder to detect, as earthquakes are common in the southern part of the state.

Alaska has some of the world’s largest glaciers, which can be thousands of feet thick and cover hundreds of square miles. The ice’s weight causes the land beneath it to sink, and, when a glacier melts, the ground springs back like a sponge.

“There are two components to the uplift,” said Chris Rollins, the study’s lead author who conducted the research while at the Geophysical Institute. “There’s what’s called the ‘elastic effect,’ which is when the earth instantly springs back up after an ice mass is removed. Then there’s the prolonged effect from the mantle flowing back upwards under the vacated space.”

In the study, researchers link the expanding movement of the mantle with large earthquakes across Southeast Alaska, where glaciers have been melting for over 200 years. More than 1,200 cubic miles of ice have been lost.

Southern Alaska sits at the boundary between the continental North American plate and the Pacific Plate. They grind past each other at about two inches per year — roughly twice the rate of the San Andreas fault in California — resulting in frequent earthquakes.

….

Greenland And Iceland Mean Winter Temperatures Continue Cooling Since Start Of The Century

by Kirye & Pierre, March 24, 2021 in NoTricksZone


The February 2021 data for Iceland and Greenland are available from the Japan Meteorological Agency (JMA), which means the latest meteorological DJF winter mean temperature can be computed.

Icelandic winters have cooled since 2001

We plotted the JMA data for three stations (the ones with sufficient data) in Iceland. Result: no warming over the past 18 winters!

Apparent Atlantic warming cycle likely an artifact of climate forcing

by A.E. Messer & S. Lajeunesse, March 25, 2021 inPennStateNews


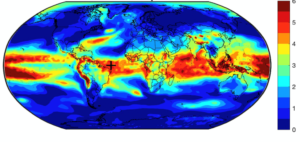
This map of the Earth shows the spacial pattern of temperature variance by percentage. The most variance is seen in the tropics with less at the poles. IMAGE: DANIEL J. BROUILLETTE. PENN STATE

UNIVERSITY PARK, Pa. — Volcanic eruptions, not natural variability, were the cause of an apparent “Atlantic Multidecadal Oscillation,” a purported cycle of warming thought to have occurred on a timescale of 40 to 60 years during the pre-industrial era, according to a team of climate scientists who looked at a large array of climate modeling experiments.

The result complements the team’s previous finding that what had looked like an “AMO” occurring during the period since industrialization is instead the result of a competition between steady human-caused warming from greenhouse gases and cooling from more time-variable industrial sulphur pollution.

“It is somewhat ironic, I suppose,” said Michael E. Mann, distinguished professor of atmospheric science and director, Earth System Science Center, Penn State. “Two decades ago, we brought the AMO into the conversation, arguing that there was a long-term natural, internal climate oscillation centered in the North Atlantic based on the limited observations and simulations that were available then, and coining the term ‘AMO.’ Many other scientists ran with the concept, but now we’ve come full circle. My co-authors and I have shown that the AMO is very likely an artifact of climate change driven by human forcing in the modern era and natural forcing in pre-industrial times.”

The researchers previously showed that the apparent AMO cycle in the modern era was an artifact of industrialization-driven climate change, specifically the competition between warming over the past century from carbon pollution and an offsetting cooling factor, industrial sulphur pollution, that was strongest from the 1950s through the passage of the Clean Air Acts in the 1970s and 1980s. But they then asked, why do we still see it in pre-industrial records?

Is Climate Change Real?

by Robert Lyman,  March 23, 2021 in FriendsofScienceCalgary


Contributed by Robert Lyman © 2021 Full bio here.

Is climate change real? Journalists in Canada have had a field day with that question since it was debated at the Conservative Party policy meeting on March 20, 2021. It is the perfect question to ask if you want to boil a mind-numbingly complex set of issues into a simple question that can be used to misinform and confuse people. The proper answer to that question is another one. To what part of the climate policy conundrum are you referring?

You see, the “realness” (or truthfulness, or even importance) of climate policy depends on the answer to several questions, not one. Let’s break them down, and comment ever so briefly on the possible answers.

Is global warming occurring?

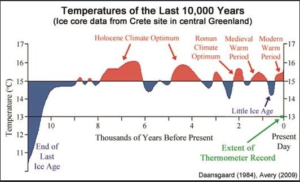
The global climate has been changing for millions of years, with temperatures rising and falling. They were as high as they are today during Roman times and the Medieval Warm Period. Since 1850, global average temperatures have risen slightly more than one degree Celsius.

We’re Not Gonna Drown! Analyses Show COASTAL SEA LEVEL RISE Is Only 1.69 mm Per Year!

by P. Gosselin, March 23, 2021 in NoTricksZone


UPDATE: Sea level rise near the coasts where people actually live is found to be 1.69 mm/yr. But when crunching the data for the entire ocean, as Willis Eschenbach has shown, a figure of just 1.52 mm/year is computed. 

Hot shot data analyst Zoe Phin at her site examines sea level rise.

There she notes, “Climate alarmists are worried that the sea level is rising too fast and flooding is coming soon. You can find many data images like this on the net:”

Sea Level and the Jersey Shore

by Kip  Hansen, March 22, 2021 in WUWT


Dr. Judith Curry has been writing about Sea Levels and New Jersey [and here], spurred on by a request for an evaluation of the topic from the New Jersey Business & Industry Association(NJBIA).  The NJBIA is concerned because a study by a team of sea level researchers at Rutgers University has called for “draconian policies unsupported by science” that would “harm our economy today” by overreacting to “legitimate concerns about climate change, sea level rise, and flooding”.   Dr. Curry’s full report is titled: “Assessment of projected sea level rise scenarios for the New Jersey Coast”.

Dr. Curry’s CFAN report contains this summary:

The summary conclusions of the CFAN Review are:

—  The sea level projections provided by the Rutgers Report are substantially higher than those provided by the IPCC, which is generally regarded as the authoritative source for policy making. The sea level rise projections provided in the Rutgers Report, if taken at face value, could lead to premature decisions related to coastal adaptation that are unnecessarily expensive and disruptive.

—  Scenarios out to 2050 for sea level rise and hurricane activity should account for scenarios of variability in multi-decadal ocean circulation patterns.

—  Best practices in adapting to sea level rise use a framework suitable for decision making under deep uncertainty. The general approach of Dynamic Adaptive Policy Pathways is recommended for sea level rise adaptation on the New Jersey coast.

I wrote a piece here at WUWT a year ago, titled “Atlantic City:   I’ll meet you tonite…..”, prompted by the Governor of New Jersey’s executive order stating that  “New Jersey has set a goal of producing 100 percent clean energy by 2050.” and  “New Jersey will become the first state to require that builders take into account the impact of climate change, including rising sea levels, in order to win government approval for projects.”  The sea level rise part of this executive order was based on an earlier draft of  the same  study by researchers at Rutgers University.

End of Snow? Finland Thinks Their Winter Snow Might Not Melt This Summer

by Eric Worall, March 22, 2021 in WUWT


Finland thinks that piles of snow accumulated from road clearing this year are so large, some of the snow will still be frozen when winter returns.

In Finnish capital region, snow piles built up this winter may not melt during summer

FINLAND  15 MARCH 2021

THE CAPITAL REGION of Finland has received so much snow this winter that the metres-high piles hauled to designated snow dump areas may not melt during the course of the summer, reports Helsingin Sanomat.

In Uusimaa, for example, the amount of snow was 1.7 times higher than last year in January, according to Foreca.

Helsingin Sanomat on Friday wrote that the piles of snow stand almost as high as 20 metres at the dump area in Herttoniemi, eastern Helsinki. In Maununneva, a north-western neighbourhood of the city, lorries have dumped roughly 16,000 loads of snow at the dump area, revealed Tero Koppinen, a production manager at Helsinki City Construction Services (Stara).

The snow ploughed from roads forms a large structure, nicknamed by the locals as the Alps, also at the only snow dump area in Espoo, in Vanttila.

Read more: https://www.helsinkitimes.fi/finland/finland-news/domestic/18867-snow-piles-built-up-this-winter-may-not-melt-during-summer-in-finnish-capital-region.html

The Fins mostly seem to be treating this as a joke, maybe a chance to cool off on warm Summer days. And most likely this event will have no long term consequences.

But history teaches that when ice ages strike, they can strike abruptly, with very little warning.

12,800 years ago, the world abruptly froze. Temperatures plunged back to ice age conditions, and stayed cold for over 1000 years.

CLIMATE CHANGE, COVID-19, AND THE GREAT RESET

by A. MacRae, March 2021 in Elecroverse


The below treatise was sent to Canadian and American politicians and the media – but most of them won’t understand it, because they have no scientific competence and have been utterly deceived – programmed for decades by false climate scares and green energy frauds.

SUMMARY

We published in 2002 that there was NO catastrophic human-made global warming /climate change crisis, and green energy schemes were NOT green and produced little useful (dispatchable) energy. Dangerous global warming and climate change have NOT HAPPENED and green energy schemes have proved to be COSTLY, UNRELIABLE AND INEFFECTIVE. Global warming is NOT a threat, but global cooling IS dangerous. In 2002 we predicted that global cooling would start circa 2020, based on low solar activity, and that prediction is increasingly supported by the evidence.

Politicians foolishly accepted very-scary global warming falsehoods and brewed the perfect storm, crippling our energy systems with costly and unreliable green energy schemes that utterly fail due to intermittency, at a time when we will need more reliable, dispatchable energy due to increased energy demand and imminent global cooling. The good people of Australia, Britain, Germany, California and Texas have all suffered and died due to green energy failures that were PREDICTABLE AND PREDICTED.

THE GREENS’ PREDICTIVE CLIMATE AND ENERGY RECORD IS THE WORST

Twice as much carbon flowing from land to ocean than previously thought

by Institute for Basic Science, March 18, 2021 in WUWT 


Every year 600-900 million tons of carbon flow through rivers to the ocean either as particles or in dissolved form. Researchers have known for a long time that this does not represent the total amount of carbon that gets transported from the land to the ocean. But the remaining contributors mostly from coastal ecosystems, such as carbon-rich mangrove forests, and from groundwater discharge into the ocean have been notoriously difficult to measure.

A new study published in the journal Global Biogeochemical Cycles and spearheaded by Dr. Eun Young Kwon, project leader at the IBS Center for Climate Physics South Korea provides new estimates of this elusive component of the global carbon cycle. The study makes use of the existence of two stable carbon isotopes, 12C and 13C, with the latter being slightly heavier, because it has one more neutron in its nucleus. The concentration ratio between these two carbon isotopes (referred to as ?13C) provides a means to track carbon through the different components of the carbon cycle, including the atmosphere, oceans, river systems and the biosphere. Knowing the typical ?13C value of land biosphere and for coastal vegetation, one can now track how this quantity gets diluted in the oceans. “The carbon isotope values act like an invisible dye that tells us something about the source where it came from and how much got released initially” says Dr. Kwon, lead author of the study.

False Alarm: IPCC Models Say A Warming Antarctica REDUCES Sea Levels -0.8 Of A Meter By 3000

by K. Richard, March 15, 2021 in NoTricksZone


The IPCC-endorsed anthropogenic global warming (AGW) paradigm finds a warming Antarctica results in more precipitation locked up as ice on the continent. This contributes to reducing sea levels: a -1.2 mm/year−1 mitigation of sea level rise over the next 80 years.

In the 4th IPCC report, Working Group 1 (the physical science) reported that as global temperatures rise,GCMs [models] indicate increasingly positive SMB for the Antarctic Ice Sheet as a whole because of greater accumulation.” This means that by 2100 Antarctica “would contribute 0.4 to 2.0 mm yr−1 of sea level fall.” Over the next 980 years, Antarctica’s ice accumulation will reduce sea levels by nearly a full meter (-0.8 m by 3000).

Clouds From Both Sides Now

by W. Eschenbach, March 15, 2021 in WUWT


Clouds are said to be the largest uncertainty in climate models, and I can believe that. Their representation in the models is highly parameterized, each model uses different parameters as well as different values for the same parameters, and so of course, different models give very different results. Or to quote from the IPCC, the Intergovernmental Panel on Climate Change:

In many climate models, details in the representation of clouds can substantially affect the model estimates of cloud feedback and climate sensitivity. Moreover, the spread of climate sensitivity estimates among current models arises primarily from inter-model differences in cloud feedbacks. Therefore, cloud feedbacks remain the largest source of uncertainty in climate sensitivity estimates.

The question of importance is this—if the earth heats up, will clouds exacerbate the warming or will they act to reduce the warming? The general claim from mainstream climate scientists and the IPCC is that the clouds will increase the warming, viz:

All global models continue to produce a near-zero to moderately strong positive net cloud feedback.

My own theory is that clouds and other emergent climate phenomena generally act to oppose any increases in surface temperature. So me, I’d expect the opposite of what the models show. I figured that there should be a negative cloud feedback that opposes the warming.

So I thought I’d take a look at answering the question using the CERES satellite dataset. As a prologue, here’s a short exposition about measuring the effect of clouds.

MAGMATIC MOVEMENTS REGISTERED UNDER FAGRADALSFJALL VOLCANO, ICELAND — 34,000 QUAKES IN TWO WEEKS, ERUPTION LIKELY

by Cap Allon, March 11, 2021 in Electroverse


A “seismic crisis” has been occurring in the area near Fagradalsfjall since late Feb 2021. This activity has been interpreted as intrusion of magma at shallow depths, which could lead to a new eruption.

Fadradalsfjall is a Pleistocene table mountain in the Reykjanes Peninsula, NE of Grindavik, Iceland.

Of today’s reawakening volcanoes, those located in Iceland are perhaps the most concerning.

It is this highly-volcanic region that will likely be home to the next “big one” (a repeat of the 536 AD eruption that took out the Roman Republic…?) — the one that will return Earth to another volcanic winter.

Volcanic eruptions are one of the key forcings driving Earth into its next bout of global cooling.

Volcanic ash (particulates) fired above 10km –and so into the stratosphere– shade sunlight and reduce terrestrial temperatures. The smaller particulates from an eruption can linger in the upper atmosphere for years, or even decades+ at a time.

Today’s worldwide volcanic uptick is thought to be tied to low solar activity, coronal holes, a waning magnetosphere, and the influx of Cosmic Rays penetrating silica-rich magma.

The COLD TIMES are returning, the mid-latitudes are REFREEZING in line with the great conjunction, historically low solar activitycloud-nucleating Cosmic Rays, and a meridional jet stream flow (among other forcings).

Both NOAA and NASA appear to agree, if you read between the lines, with NOAA saying we’re entering a ‘full-blown’ Grand Solar Minimum in the late-2020s, and NASA seeing this upcoming solar cycle (25) as “the weakest of the past 200 years”, with the agency correlating previous solar shutdowns to prolonged periods of global cooling here.

Furthermore, we can’t ignore the slew of new scientific papers stating the immense impact The Beaufort Gyre could have on the Gulf Stream, and therefore the climate overall.

Molecular and isotopic evidence reveals the end-Triassic carbon isotope excursion is not from massive exogenous light carbon

by C.P. Fox et al., Dec 1, 2020 in PNAS


Significance

The end-Triassic mass extinction that occurred ∼202 Ma is one of the “Big Five” biotic crises of the Phanerozoic Eon. It is also accompanied by an organic carbon isotopic excursion that has long been interpreted as the result of a global-scale carbon-cycle disruption. Rather than being due to massive inputs of exogenous light carbon into the ocean–atmosphere system, the isotopic excursion is shown here to reflect regional sea-level change that caused a transition from a marine ecosystem to a less saline, shallow-water, microbial-mat environment and resultant changes in the sources of organic matter. The mass extinction that occurred slightly later, caused by abrupt injection of volcanogenic CO2, is accompanied by only modest changes in organic carbon isotopic composition.

Abstract

The negative organic carbon isotope excursion (CIE) associated with the end-Triassic mass extinction (ETE) is conventionally interpreted as the result of a massive flux of isotopically light carbon from exogenous sources into the atmosphere (e.g., thermogenic methane and/or methane clathrate dissociation linked to the Central Atlantic Magmatic Province [CAMP]). Instead, we demonstrate that at its type locality in the Bristol Channel Basin (UK), the CIE was caused by a marine to nonmarine transition resulting from an abrupt relative sea level drop. Our biomarker and compound-specific carbon isotopic data show that the emergence of microbial mats, influenced by an influx of fresh to brackish water, provided isotopically light carbon to both organic and inorganic carbon pools in centimeter-scale water depths, leading to the negative CIE. Thus, the iconic CIE and the disappearance of marine biota at the type locality are the result of local environmental change and do not mark either the global extinction event or input of exogenous light carbon into the atmosphere. Instead, the main extinction phase occurs slightly later in marine strata, where it is coeval with terrestrial extinctions and ocean acidification driven by CAMP-induced increases in PCO2; these effects should not be conflated with the CIE. An abrupt sea-level fall observed in the Central European basins reflects the tectonic consequences of the initial CAMP emplacement, with broad implications for all extinction events related to large igneous provinces.

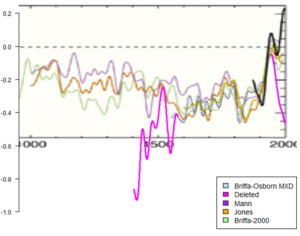
Michael Mann “Hockey Stick” Update: Now Definitively Established To Be Fraud

by F. Menton, Aug 26, 2021 in ManhattanContrarian


The Michael Mann “Hockey Stick” is suddenly back in the news. It’s been so long since we have heard from it, do you even remember what it is?

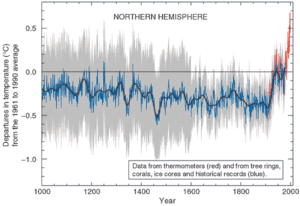
The “Hockey Stick” is the graph that took the world of climate science by storm back in 1998. That’s when Mann and co-authors Raymond Bradley and Malcolm Hughes published in Nature their seminal paper “Global-scale temperature patterns and climate forcing over the past six centuries.” A subsequent 1999 update by the same authors, also in Nature (“Northern Hemisphere Temperatures During the Past Millennium: Inferences, Uncertainties, and Limitations”) extended their reconstructions of “temperature patterns and climate forcing” back another 400 years to about the year 1000. The authors claimed (in the first paragraph of the 1998 article) to “take a new statistical approach to reconstructing global patterns of annual temperature . . . , based on the calibration of multiproxy data networks by the dominant patterns of temperature variability in the instrumental record.” The claimed “new statistical approach,” when applied to a group of temperature “proxies” that included tree ring samples and lake bed sediments, yielded a graph — quickly labeled the “Hockey Stick” — that was the perfect icon to sell global warming fear to the public. The graph showed world temperatures essentially flat or slightly declining for 900+ years (the shaft of the hockey stick), and then shooting up dramatically during the 20th century era of human carbon dioxide emissions (the blade of the stick).

Major February global temperature drop reveals the real climate control knob

by J. Bastardi, March 7, 2021 in CFACT


By now all of you know my belief ( bias) that it’s the oceans, and more so the tropical oceans, that are the biggest control knob of the weather and climate. If you really wanted to make this a controlled classroom experiment (nature is not a classroom with easy controls)  then I venture to say that the real way to know man’s influence is to have SST’s return to where they were in the 1970s, give it a couple of years for the water vapor adjustment, ( and if I am right. co2 will adjust as warmer oceans outsource it, so the outsourcing to the air will decrease) and see the difference there. And there you may be able to make an irrefutable argument for man’s contribution, Unfortunately for those who will not look at anything else,  that is likely to be quite small, but on the other hand, unlike the warming we have had which is really in the coldest driest places and more so at their coldest driest time of the year, you would likely find the lions share of what warming would be where life thrives.. As small as that has been, less than .25C of the numbers we see all the time that tell us that at. a bit over 59 degrees the planet is overheating, it is liable to be even less detectable and certainly as or more adaptable than what we seemed to have adapted to nicely here.

But the fear of course is runaway warming which is interesting since it counters Le Chateliers,  which I never hear anyone bring up, most likely because it’s a simple explanation. And a simple explanation would impact a lot of things relying on a done deal, complex explanation that the public must accept because they could never understand.

Danish Institute Data: Greenland Ice Melt Has Slowed Down Significantly Over Past Decade

by P. Gosselin, March 10, 2021 in NoTricksZone


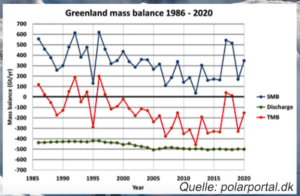
The media and activists, among them a number of “Climate scientists”, have been declaring that Greenland ice melt has been accelerating.

Today the German Klimaschau climate news video reports, however, that this has not been the case over the recent years. All the recent talk about accelerating Greenland ice loss over the past years is false.

SMB on the rise

First a plot of Greenland’s surface mass balance SMB (blue curve below) shows that snow accumulation has occurred faster than snow and ice have melted over the past 35 years:

Chart: cropped from Klimaschau here

Though the annual SMB values declined from 1985 to 2012, the trend has rebounded since.

Loss through coastal discharge steady over the past 15 years

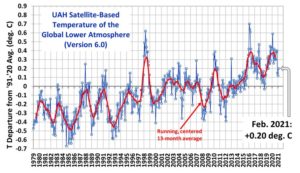
UAH Global Temperature Update for February 2021: +0.20 deg. C

by Roy Spencer, March. 3rd, 2021 in Global Warming


The Version 6.0 global average lower tropospheric temperature (LT) anomaly for February, 2021 was +0.20 deg. C, up from the January, 2021 value of +0.12 deg. C.

REMINDER: We have changed the 30-year averaging period from which we compute anomalies to 1991-2020, from the old period 1981-2010. This change does not affect the temperature trends.

The linear warming trend since January, 1979 remains at +0.14 C/decade (+0.12 C/decade over the global-averaged oceans, and +0.18 C/decade over global-averaged land).

Various regional LT departures from the 30-year (1991-2020) average for the last 14 months are:

California’s Energy Scorecard Fails On The World Stage – OpEd

by R. Stein, Sept 21, 2021 in EurasiaReview


California, with 0.5 percent of the world’s population (40 million vs 8 billion) professes to be the leader of everything and through its dysfunctional energy policies imports more electricity than any other state – currently at 32 percent from the Northwest and Southwest – and has forced California to be the only state in contiguous America thatimports most of its crude oil energy demands from foreign country suppliers to meet the energy demands of the state.

State energy policies have made California electricity and fuel prices among the highest in the nation which have been contributory to the rapid growth of “energy poverty” for the 18 million (45 percent of the 40 million Californians) that represent the Hispanic and African American populations of the state.

Access to electricity is now an afterthought in most parts of the world, so it may come as a surprise to learn that 16 percent of the world’s population — an estimated 1.2 billion people — are still living without this basic necessity. Lack of access to electricity, or “energy poverty”, is the ultimate economic hindrance as it prevents people from participating in the modern economy.

Almost half the world — over three billion people — live on less than $2.50 a day. At least 80 percent of humanity, or almost 6 billion, lives on less than $10 a day. Other nations and continents living in abject poverty without electricity realize California, and large parts of the U.S. buying into green new deals, renewable futures, and zero-carbon societies are left with the dystopic reality of mass homelessness, filth and rampant inequality that increasingly characterize the GND core values.