Full-time professor at the Free University of Brussels, Belgium
apreat@gmail.com
apreat@ulb.ac.be
• Department of Earth Sciences and Environment
Res. Grp. - Biogeochemistry & Modeling of the Earth System
Sedimentology & Basin Analysis
• Alumnus, Collège des Alumni, Académie Royale de Sciences, des Lettres et des Beaux Arts de Belgique (mars 2013). http://www.academieroyale.be/cgi?usr=2a8crwkksq&lg=fr&pag=858&rec=0&frm=0&par=aybabtu&id=4471&flux=8365323
• Prof. Invited, Université de Mons-Hainaut (2010-present-day)
• Prof. Coordinator and invited to the Royal Academy of Sciences of Belgium (Belgian College) (2009-
present day)
• Prof. partim to the DEA (third cycle) led by the University of Lille (9 universities from 1999 to 2004) - Prof. partim at the University of Paris-Sud/Orsay, European-Socrates Agreement (1995-1998)
• Prof. partim at the University of Louvain, Convention ULB-UCL (1993-2000)
• Since 2015 : Member of Comité éditorial de la Revue Géologie de la France http://geolfrance.brgm.fr
• Since 2014 : Regular author of texts for ‘la Revue Science et Pseudosciences’ http://www.pseudo-sciences.org/
• Many field works (several weeks to 2 months) (Meso- and Paleozoic carbonates, Paleo- to Neoproterozoic carbonates) in Europe, USA (Nevada), Papouasia (Holocene), North Africa (Algeria, Morrocco, Tunisia), West Africa (Gabon, DRC, Congo-Brazzaville, South Africa, Angola), Iraq... Recently : field works (3 to 5 weeks) Congo- Brazzaville 2012, 2015, 2016 (carbonate Neoproterozoic).
Degree in geological sciences at the Free University of Brussels (ULB) in 1974, I went to Algeria for two years teaching mining geology at the University of Constantine. Back in Belgium I worked for two years as an expert for the EEC (European Commission), first on the prospecting of Pb and Zn in carbonate environments, then the uranium exploration in Belgium. Then Assistant at ULB, Department of Geology I got the degree of Doctor of Sciences (Geology) in 1985. My thesis, devoted to the study of the Devonian carbonate sedimentology of northern France and southern Belgium, comprised a significant portion of field work whose interpretation and synthesis conducted to the establishment of model of carbonate platforms and ramps with reefal constructions.
I then worked for Petrofina SA and shared a little more than two years in Angola as Director of the Research Laboratory of this oil company. The lab included 22 people (micropaleontology, sedimentology, petrophysics). My main activity was to interpret facies reservoirs from drillings in the Cretaceous, sometimes in the Tertiary. I carried out many studies for oil companies operating in this country.
I returned to the ULB in 1988 as First Assistant and was appointed Professor in 1990. I carried out various missions for mining companies in Belgium and oil companies abroad and continued research, particularly through projects of the Scientific Research National Funds (FNRS).
My research still concerns sedimentology, geochemistry and diagenesis of carbonate rocks which leads me to travel many countries in Europe or outside Europe, North Africa, Papua New Guinea and the USA, to conduct field missions.
Since the late 90's, I expanded my field of research in addressing the problem of mass extinctions of organisms from the Upper Devonian series across Euramerica (from North America to Poland) and I also specialized in microbiological and geochemical analyses of ancient carbonate series developing a sustained collaboration with biologists of my university. We are at the origin of a paleoecological model based on the presence of iron-bacterial microfossils, which led me to travel many countries in Europe and North Africa. This model accounts for the red pigmentation of many marble and ornamental stones used in the world. This research also has implications on the emergence of Life from the earliest stages of formation of Earth, as well as in the field of exobiology or extraterrestrial life ...
More recently I invested in the study from the Precambrian series of Gabon and Congo. These works with colleagues from BRGM (Orléans) are as much about the academic side (consequences of the appearance of oxygen in the Paleoproterozoic and study of Neoproterozoic glaciations) that the potential applications in reservoir rocks and source rocks of oil (in collaboration with oil companies).
Finally I recently established a close collaboration with the Royal Institute of Natural Sciences of Belgium to study the susceptibility magnetic signal from various European Paleozoic series. All these works allowed me to gain a thorough understanding of carbonate rocks (petrology, micropaleontology, geobiology, geochemistry, sequence stratigraphy, diagenesis) as well in Precambrian (2.2 Ga and 0.6 Ga), Paleozoic (from Silurian to Carboniferous) and Mesozoic (Jurassic and Cretaceous) rocks. Recently (2010) I have established a collaboration with Iraqi Kurdistan as part of a government program to boost scientific research in this country.
My research led me to publish about 180 papers in international and national journals and presented more than 170 conference papers. I am a holder of eight courses at the ULB (5 mandatory and 3 optional), excursions and field stages, I taught at the third cycle in several French universities and led or co-managed a score of 20 Doctoral (PhD) and Post-doctoral theses and has been the promotor of more than 50 Masters theses.
Climate models play a central role in the attribution of global warming or climate change to human causes. The standard argument takes the following form: “We can get the model to do X, using human causes, but not without them, so human causes must be the cause of X.” A little digging reveals that this is actually a circular argument, because the models are set up in such a way that human causes are the only way to get change.
The finding is that humans are the cause of global warming and climate change is actually the assumption going in. This is circular reasoning personified, namely conclude what you first assume.
This circularity can be clearly seen in what many consider the most authoritative scientific report on climate change going, although it is actually just the most popular alarmist report. We are talking about the Summary for Policymakers (SPM), of the latest assessment report (AR5), of the heavily politicized UN Intergovernmental Panel on Climate Change (IPCC). Their 29 page AR5 SPM is available here.
Reliability of future global warming projections depends on how well climate models reproduce the observed climate change over the twentieth century. In this regard, deviations of the model-simulated climate change from observations, such as a recent “pause” in global warming, have received considerable attention. Such decadal mismatches between model-simulated and observed climate trends are common throughout the twentieth century, and their causes are still poorly understood. Here we show that the discrepancies between the observed and simulated climate variability on decadal and longer timescale have a coherent structure suggestive of a pronounced Global Multidecadal Oscillation. Surface temperature anomalies associated with this variability originate in the North Atlantic and spread out to the Pacific and Southern oceans and Antarctica, with Arctic following suit in about 25–35 years. While climate models exhibit various levels of decadal climate variability and some regional similarities to observations, none of the model simulations considered match the observed signal in terms of its magnitude, spatial patterns and their sequential time development. These results highlight a substantial degree of uncertainty in our interpretation of the observed climate change using current generation of climate models.
by W.E. William, March 7, 2019 in ClimateChangeDispatch
Rep. Alexandria Ocasio-Cortez claims that “the world is going to end in 12 years if we don’t address climate change.”
The people at the Intergovernmental Panel on Climate Change agree, saying that to avoid some of the most devastating impacts of climate change, the world must slash carbon emissions by 45 percent by 2030 and completely decarbonize by 2050.
Such dire warnings are not new. In 1970, Harvard University biology professor George Wald, a Nobel laureate, predicted, “Civilization will end within 15 or 30 years unless immediate action is taken against problems facing mankind.”
Also in 1970, Paul Ehrlich, a Stanford University biologist, predicted in an article for The Progressive, “The death rate will increase until at least 100-200 million people per year will be starving to death during the next ten years.”
The year before, he had warned, “If I were a gambler, I would take even money that England will not exist in the year 2000.”
We’ve all come across the images of polar bears drifting on ice floes: emblematic victims of the global warming that’s melting the polar ice caps, symbols of the threat to the earth posed by our ceaseless energy production—above all, the carbon dioxide that factories and automobiles emit. We hear louder and louder demands to impose limits, to change our wasteful ways, so as to save not only the bears but also the planet and ourselves.
In political discourse and in the media, major storms and floods typically get presented as signs of impending doom, accompanied by invocations to the environment and calls to respect Mother Nature. Only catastrophes seem to grab our attention, though, and it’s rarely mentioned that warming would also bring some benefits, such as expanded production of grains in previously frozen regions of Canada and Russia. Nor do we hear that people die more often of cold weather than of hot weather. Isolated voices criticize the alarm over global warming, considering it a pseudoscientific thesis, the true aim of which is to thwart economic modernization and free-market growth and to extend the power of states over individual choices.
Not being a climatologist myself, I’ve always had trouble deciding between these arguments. And then I met Judith Curry at her home in Reno, Nevada. Curry is a true climatologist …
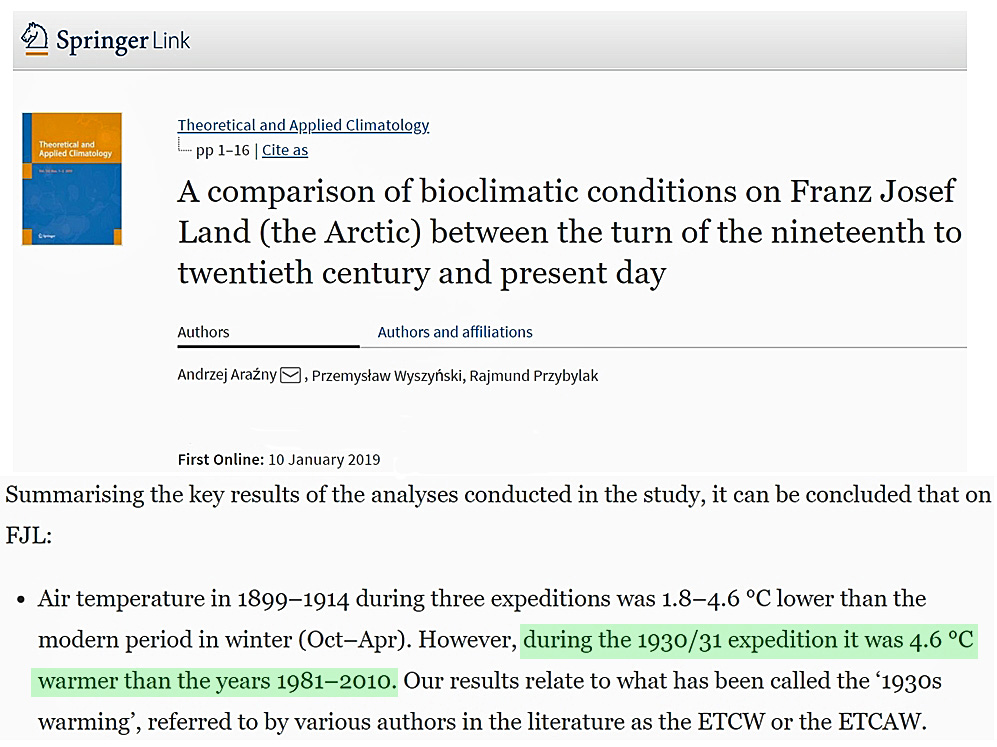
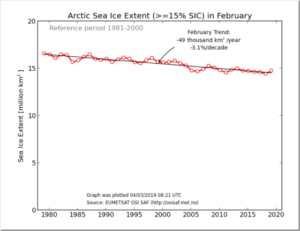
Yet another scientific paper presents evidence that the Arctic region was warmer than recent decades during the 1930s, leading scientists to conclude there is “still-insufficient knowledge of the mechanisms governing the Arctic Climate System.”
by P. Homewood, March 7, 2019 in NotaLotofPeopleKnowThat
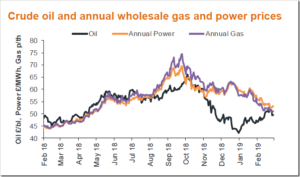
The renewable lobby often claims that the rising cost of fossil fuels will help make renewable energy competitive.
However, oil and gas prices remain stubbornly uncooperative. Gas prices in particular are back down to levels seen last spring, after peaking last autumn.
As is usually the way, power prices have followed the same pattern.
Oil and gas are very much cyclical markets. When supply is tight, prices rise, thus attracting more investment to increase production.
Prices therefore fall, cutting profitability and new investment, and setting the whole cycle back in motion again.
How long supply can keep meeting ever rising demand is a moot point. But there is little sign of anything changing in the foreseeable future.
German wind park protest group MenschNatur posted here explaining how even adding more wind and solar capacity does not make Germany’s energy supply any more reliable, but in fact may even make it less so.
Time and again the proponents of the Energiewende (transition to green energies) promote the idea that we must invest massively in more wind and solar power plants and that only an accelerated expansion can save the transformation to green energies.
Thus the wind energy protest group MenschNatur has taken a closer look at the increase in installed nominal capacity over the past years and compared it to what actually gets fed into the grid.
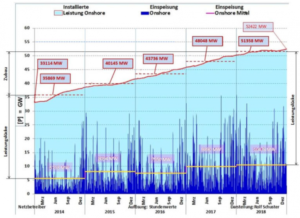
How increases in wind generator capacity affects the feed-in power is described in the following diagram. MenschNatur plotted the installed capacity of all German onshore wind turbines from 2014 to 2018, along with what actually got fed in.
Figure 1: Expansion of rated installed wind power capacity and the power that actually got fed into the grid in Germany. Chart: MenschNatur, by Rolf Schuster.
And the U.S. is not alone in trying to maximize oil and gas production. Despite the financial failures of the U.S. fracking industry, international efforts to duplicate the American fracking story are ramping up across the globe.
The CEO of Saudi Arabian state oil company Aramco recently dismissed the idea that global demand for oil will decrease anytime soon and urged the oil industry to “push back on exaggerated theories like peak oil demand.”
Khalid al Falih, Saudi Arabia’s energy minister, told the Financial Times, “Going forward the world is going to be Saudi Aramco’s playground.” But not if other countries frack there first.
China Expanding Fracking Efforts, Testing New Technology
En Belgique francophone, l’intérêt pour la question climatique ne cesse de croître. A la faveur du succès remporté par les écolos aux élections communales d’octobre dernier, les partis francophones se sont lancés dans une surenchère de promesses. A cela viennent se greffer les marches pro-environnement enthousiastes mais néanmoins naïves de lycéens qui, en matière d’énergie et de climat, connaissent très peu de choses. Avec un peu plus de connaissances, ils demanderaient des fenêtres hermétiques et à double vitrage dans leurs classes, au lieu de panneaux photovoltaïques, on y reviendra. En quelques jours on est passé d’un gouvernement critiqué pour être timide à une proposition de loi climat qui n’a pas d’équivalent dans le reste du monde. Car ne nous y trompons pas, la frénésie climatique est belge. Même si on ne devrait pas être étonné que Trump n’ait pas prononcé le mot climat dans son récent discours de l’Union, ce que j’observe professionnellement dans le monde ne correspond en rien à ce que vit la Belgique. Il y a lieu de s’interroger sur les motifs réels de ce déferlement ; ce n’est pas audible pour l’instant mais on devra y répondre un jour.
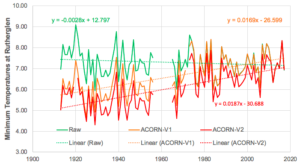
The Bureau of Meteorology has rewritten Australia’s temperature in this way for the second time in just six years – increasing the rate of warming by 23 percent between Version 1 and the new Version 2 of the official ACORN-SAT temperature record.
Temperatures from the Rutherglen research station in rural Victoria are one of the 112 weather stations that make-up ACORN-SAT. Temperature have been changed here by Blair Trewin, under the supervision of David Jones at the Bureau.
…
Annual average minimum temperatures at Rutherglen (1913 to 2017). Raw temperatures (green) show a mild cooling trend of 0.28 degrees Celsius per 100 years. This cooling trend has been changed to warming of 1.7 degrees Celsius per 100 years in ACORN-SAT Version 1 (orange). These temperatures have been further remodeled in ACORN-SAT Version 1 (red) to give even more dramatic warming, which is now 1.9 degrees Celsius.
After years of trying to suppress their release, and finally being ordered to be released by a judge, they are now public, and we have them here. This will remain as a “top post” for a day, new stories will be below this one.
There’s quite a treasure trove, but also some duplications from previous releases.
A new paper in Nature Climate Change by Santer et al. (paywalled) claims that the 40 year record of global tropospheric temperatures agrees with climate model simulations of anthropogenic global warming so well that there is less than a 1 in 3.5 million chance (5 sigma, one-tailed test) that the agreement between models and satellites is just by chance.
And, yes, that applies to our (UAH) dataset as well.
While it’s nice that the authors commemorate 40 years of satellite temperature monitoring method (which John Christy and I originally developed), I’m dismayed that this published result could feed a new “one in a million” meme that rivals the “97% of scientists agree” meme, which has been a very successful talking point for politicians, journalists, and liberal arts majors.
John Christy and I examined the study to see just what was done. I will give you the bottom line first, in case you don’t have time to wade through the details:
The new Santer et al. study merely shows that the satellite data have indeed detected warming (not saying how much) that the models can currently only explain with increasing CO2 (since they cannot yet reproduce natural climate variability on multi-decadal time scales).
That’s all.
But we already knew that, didn’t we? So why publish a paper that goes to such great lengths to demonstrate it with an absurdly exaggerated statistic such as 1 in 3.5 million (which corresponds to 99.99997% confidence)? I’ll leave that as a rhetorical question for you to ponder.
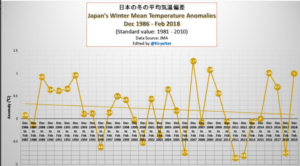
The Pacific island nation of Japan refuses to obey climate scientists’ forecasts of warming and ignore climate alarmists and their chorus of doomsday shrieks. Climate trends are moving the other way.
Now that February has ended, the 2018/19 winter is now in the books. We’ve tabulated the winter temperature data for Japan going back 32 years. The following chart tells a story that was not supposed to happen:
Japan’s mean winter temperature has been falling for more than 30 years, according to the data from the Japan Meteorology Agency (JMA).
While alarmists insist it’s heating up everywhere, the reality is actually just the opposite, and not just in Japan.
Finland is cooling
The Scandinavian country of Finland, which extends up into the Arctic, also shows no signs of warming at all since December, 1988.
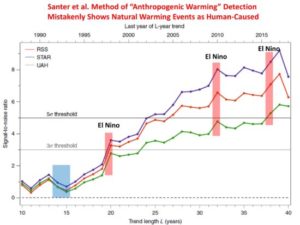
Ben Santer et al. have a new paper out in Nature Climate Change arguing that with 40 years of satellite data available they can detect the anthropogenic influence in the mid-troposphere at a 5-sigma level of confidence. This, they point out, is the “gold standard” of proof in particle physics, even invoking for comparison the Higgs boson discovery in their Supplementary information.
…
…
Conclusion
The fact that in my example the t-statistic on anthro falls to a low level does not “prove” that anthropogenic forcing has no effect on tropospheric temperatures. It does show that in the framework of my model the effects are not statistically significant. If you think the model is correctly-specified and the data set is appropriate you will have reason to accept the result, at least provisionally. If you have reason to doubt the correctness of the specification then you are not obliged to accept the result.
This is the nature of evidence from statistical modeling: it is contingent on the specification and assumptions. In my view the second regression is a more valid specification than the first one, so faced with a choice between the two, the second set of results is more valid. But there may be other, more valid specifications that yield different results.
In the same way, since I have reason to doubt the validity of the Santer et al. model I don’t accept their conclusions. They haven’t shown what they say they showed. In particular they have not identified a unique anthropogenic fingerprint, or provided a credible control for natural variability over the sample period. Nor have they justified the use of Gaussian p-values. Their claim to have attained a “gold standard” of proof are unwarranted, in part because statistical modeling can never do that, and in part because of the specific problems in their model.
Comme déjà mentionné dans un article précédent publié sur SCE, la variation de la couverture nuageuse a probablement un effet majeur sur la température moyenne globale de la basse atmosphère. Si l’on veut prédire le climat du futur comme le prétend le GIEC il faut savoir modéliser la formation des nuages. Que nous dit le dernier rapport scientifique (AR5) du GIEC à ce sujet? Le but du présent article est simplement de vous présenter quelques phrases tirées de ce rapport. La science est-elle dite?
1. Le chapitre 7 du rapport AR5 publié par le GIEC en 2013
Le chapitre 7 du rapport AR5 du GIEC[1] fait 60 pages et est consacré aux nuages et aux aérosols (le rapport AR5 complet fait au total 1535 pages). Ce chapitre 7 comporte 22 pages de références et cite plus de 1100 articles scientifiques publiés dans des revues aussi prestigieuses que Science, Nature ou PNAS. Le chapitre 7 a été écrit sous la direction de Olivier Boucher (France) et David Randall (USA), deux spécialistes du domaine. Nous n’allons pas ici remettre en question la validité de ce chapitre. Nous allons simplement vous présenter quelques phrases tirées du rapport. Comme le rapport est écrit en anglais nous vous proposerons ci-dessous une “traduction maison” des phrases qui nous paraissent les plus importantes, assorties parfois de quelques explications pour bien les comprendre. Les lettres entre crochets ([A] à [P]) renvoient simplement au texte original en anglais, donné en Annexe du présent article.
by P. Homewood, March 1, 2019 in NotaLotofPeopleKnowThat
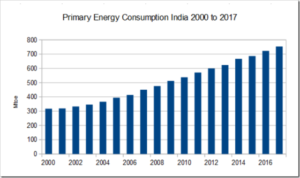
India is the world’s second most populous country and figures among the world’s most rapidly growing economies, reports the World Coal Association.
The South Asian giant is home to one-fifth of the world’s population and an additional 315 million people – almost the population of the United States today – are expected to live in India’s cities by 2040.
Since 2010, the country’s GDP has grown at an annual average of 6.8% and it is projected to surpass Germany at some stage in the 2020s to become the fourth largest in the world, and Japan sometime around 2040 to become the third.
Cyprus and ExxonMobil on Thursday announced a gas find estimated between 5-8 trillion cubic feet (tcf) in an offshore field inside the island’s exclusive economic zone.
The discovery was made in the Glafcos (Glaucus) 1 well in Block 10 of the EEZ.
“Based on preliminary interpretation of the well data, the discovery could represent an in-place natural gas resource of approximately 5 trillion to 8 trillion cubic feet (142 billion to 227 billion cubic metres). Further analysis in the coming months will be required to better determine the resource potential,” the company said in a statement.
by P. Homewood, February 9, 2019 in NotaLotofPeopleKnowThat
Politicians and policymakers have failed to grasp the gravity of the environmental crisis facing the Earth, a report claims.
The think-tank IPPR says human impacts have reached a critical stage and threaten to destabilise society and the global economy.
Scientists warn of a potentially deadly combination of factors.
These include climate change, mass loss of species, topsoil erosion, forest felling and acidifying oceans.
The report from the centre-left Institute for Public Policy Research says these factors are “driving a complex, dynamic process of environmental destabilisation that has reached critical levels.
“This destabilisation is occurring at speeds unprecedented in human history and, in some cases, over billions of years.”
The IPPR warns that the window of opportunity to avoid catastrophic outcomes is rapidly closing.
The authors urge three shifts in political understanding: on the scale and pace of environmental breakdown; the implications for societies; and the subsequent need for transformative change.
They say since 2005, the number of floods across the world has increased by 15 times, extreme temperature events by 20 times, and wildfires seven-fold.
At least climate change features in policy discussions, they say – but other vitally important impacts barely figure.
by P. Homewood, February 27, 2019 in NotaLotofPeopleKnowThat
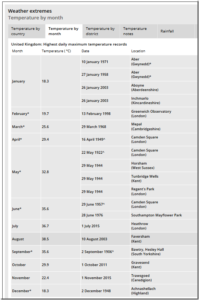
But let’s take a closer look.
Daily temperature extremes are not especially meaningful in themselves.
If global warming is responsible for yesterday’s record , was it also responsible for the record January temperature set in 1958? Or in March 1968, April 1949, May 1922, June 1957, September 1906 or December 1948, when records, which still stand, were also set?
The 2018 State of the Polar Bear report, published today by the Global Warming Policy Foundation, confirms that polar bears are continuing to thrive, despite recent reductions in sea ice levels. This finding contradicts claims by environmentalists and some scientists that falls in sea ice would wipe out bear populations.
The report’s author, zoologist Dr Susan Crockford, says that there is now very little evidence to support the idea that the polar bear is threatened with extinction by climate change.
Foreword
From 1972 until 2010,1 the Polar Bear Specialist Group (PBSG) of the International Union for the Conservation of Nature (IUCN) published comprehensive status reports every four years or so, as proceedings of their official meetings, making them available in electronic format. Until 2018 – a full eight years after its last report – the PBSG had disseminated information only on its website, updated (without announcement) at its discretion. In April 2018, the PBSG finally produced a standalone proceedings document from its 2016 meeting, although most people would have been unaware that this document existed unless they visited the PBSG website.
This State of the Polar Bear Report is intended to provide a yearly update of the kind of content available in those occasional PBSG meeting reports, albeit with more critical com- mentary regarding some of the inconsistencies and sources of bias present in the corpus of reports and papers. It is a summary of the state of polar bears in the Arctic since 2014, rela- tive to historical records, based on a review of the recent and historical scientific literature. It is intended for a wide audience, including scientists, teachers, students, decision-makers and the general public interested in polar bears and Arctic ecology.
by J.E. Kamis, February 25, 2019 in ClimateChangeDispatch
…
SUMMARY
Research study after research study has now proven beyond any doubt that the 350,000-square-mile subglacial Marie Byrd Mantle Plume and its associated geological features that are emitting massive amounts of ice melting heat and heated fluid onto the base of the Pine Island Glacier and Thwaites Glaciers.
Failure of the media to include in their numerous articles this telling scientific evidence which substantiates the significant and likely dominant role of this subglacial geologically induced heat flow in melting of West Antarctic glaciers is difficult to reconcile with proper scientific methodology.
A methodology which states that new and relevant data should be used to review old supposedly 100% settled theories.
Most of these research studies have been released one by one during the last three years which has led to minimizing their collective importance. Numerous previous Climate Change Dispatch articles written by this author beginning in 2014 have inexplicably been ignored by mainstream media outlets.
It’s time for the media to inform the public that by tying all this information together that a clear picture emerges concerning the significant impact of Antarctic subglacial geologically induced heat flow.
The word “hysteresis” doesn’t immediately seem threatening; it hints at a portmanteau of “history” and “thesis”—a dense read, perhaps, but those never killed anyone. But that’s not what the word means. Hysteresis is a profound behavior some systems can display, crossing a sort of point-of-no-return. Dial things up just one notch, and you can push the system through a radical change. To get back to normal, you might have to dial it down five or six notches.
Earth’s climate system can provide examples. Take the conveyor-belt-like circulation of water in the Atlantic Ocean. Looking back at the past, you can see times that the circulation seems to have flipped into an alternate pattern regarding climatic consequences around the North Atlantic. Switching from one pattern to the other takes a significant nudge, but reversing it is hard—like driving up to the top of a ridge and rolling down into the next valley.
…
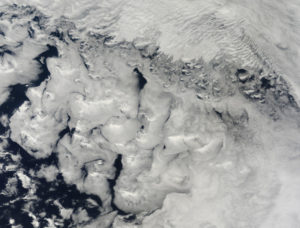
Stratocumulus clouds, like those in the lower two-thirds of this image, are common over the oceans.
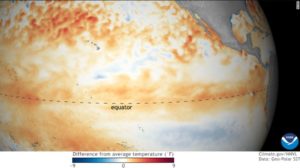
NOAA gives a 55% chance of El Niño conditions persisting through the spring.
Sea surface temperatures in January — orange-red colors are above normal.
“While sea surface temperatures are above average, current observations and climate models indicate that this El Niño will be weak, meaning we do not expect significant global impacts through the remainder of winter and into the spring,” Halpert said.
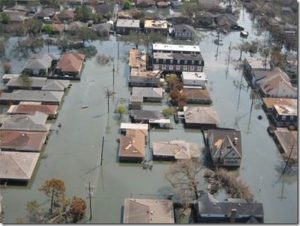
Local sea levels appear to rise when ocean volumes increase, but also when the land sinks. Scientists increasingly warn that coastal cities are sinking much faster than ocean volumes are rising. Pumping out groundwater not only causes lands to sink, it increases the oceans’ volume. China’s Huanghe Delta is sinking 10 inches a year. Southeast Asian cities battle sinking rates of 1.2 to 2.4 inches per year. Regions around Houston, Texas had sunk 10 feet by 1979; a disaster waiting to happen where hurricanes commonly generate 15-foot storm surges. Likewise, New Orleans was doomed by sinking 1.4 inches per year. Built on marshland, San Francisco’s airport sinks 0.4 inches per year.
In contrast, ocean warming plus added glacial meltwater are estimated to have only added 0.06 inches per year to sea level from 1850 to 1990, punctuated by decades that accelerated sea level rise to 0.14 inches a year. Still, that fastest rate of modern sea level rise remains only one-tenth of New Orleans’ sinking rate.
…
La géologie, une science plus que passionnante … et diverse