Full-time professor at the Free University of Brussels, Belgium
apreat@gmail.com
apreat@ulb.ac.be
• Department of Earth Sciences and Environment
Res. Grp. - Biogeochemistry & Modeling of the Earth System
Sedimentology & Basin Analysis
• Alumnus, Collège des Alumni, Académie Royale de Sciences, des Lettres et des Beaux Arts de Belgique (mars 2013). http://www.academieroyale.be/cgi?usr=2a8crwkksq&lg=fr&pag=858&rec=0&frm=0&par=aybabtu&id=4471&flux=8365323
• Prof. Invited, Université de Mons-Hainaut (2010-present-day)
• Prof. Coordinator and invited to the Royal Academy of Sciences of Belgium (Belgian College) (2009-
present day)
• Prof. partim to the DEA (third cycle) led by the University of Lille (9 universities from 1999 to 2004) - Prof. partim at the University of Paris-Sud/Orsay, European-Socrates Agreement (1995-1998)
• Prof. partim at the University of Louvain, Convention ULB-UCL (1993-2000)
• Since 2015 : Member of Comité éditorial de la Revue Géologie de la France http://geolfrance.brgm.fr
• Since 2014 : Regular author of texts for ‘la Revue Science et Pseudosciences’ http://www.pseudo-sciences.org/
• Many field works (several weeks to 2 months) (Meso- and Paleozoic carbonates, Paleo- to Neoproterozoic carbonates) in Europe, USA (Nevada), Papouasia (Holocene), North Africa (Algeria, Morrocco, Tunisia), West Africa (Gabon, DRC, Congo-Brazzaville, South Africa, Angola), Iraq... Recently : field works (3 to 5 weeks) Congo- Brazzaville 2012, 2015, 2016 (carbonate Neoproterozoic).
Degree in geological sciences at the Free University of Brussels (ULB) in 1974, I went to Algeria for two years teaching mining geology at the University of Constantine. Back in Belgium I worked for two years as an expert for the EEC (European Commission), first on the prospecting of Pb and Zn in carbonate environments, then the uranium exploration in Belgium. Then Assistant at ULB, Department of Geology I got the degree of Doctor of Sciences (Geology) in 1985. My thesis, devoted to the study of the Devonian carbonate sedimentology of northern France and southern Belgium, comprised a significant portion of field work whose interpretation and synthesis conducted to the establishment of model of carbonate platforms and ramps with reefal constructions.
I then worked for Petrofina SA and shared a little more than two years in Angola as Director of the Research Laboratory of this oil company. The lab included 22 people (micropaleontology, sedimentology, petrophysics). My main activity was to interpret facies reservoirs from drillings in the Cretaceous, sometimes in the Tertiary. I carried out many studies for oil companies operating in this country.
I returned to the ULB in 1988 as First Assistant and was appointed Professor in 1990. I carried out various missions for mining companies in Belgium and oil companies abroad and continued research, particularly through projects of the Scientific Research National Funds (FNRS).
My research still concerns sedimentology, geochemistry and diagenesis of carbonate rocks which leads me to travel many countries in Europe or outside Europe, North Africa, Papua New Guinea and the USA, to conduct field missions.
Since the late 90's, I expanded my field of research in addressing the problem of mass extinctions of organisms from the Upper Devonian series across Euramerica (from North America to Poland) and I also specialized in microbiological and geochemical analyses of ancient carbonate series developing a sustained collaboration with biologists of my university. We are at the origin of a paleoecological model based on the presence of iron-bacterial microfossils, which led me to travel many countries in Europe and North Africa. This model accounts for the red pigmentation of many marble and ornamental stones used in the world. This research also has implications on the emergence of Life from the earliest stages of formation of Earth, as well as in the field of exobiology or extraterrestrial life ...
More recently I invested in the study from the Precambrian series of Gabon and Congo. These works with colleagues from BRGM (Orléans) are as much about the academic side (consequences of the appearance of oxygen in the Paleoproterozoic and study of Neoproterozoic glaciations) that the potential applications in reservoir rocks and source rocks of oil (in collaboration with oil companies).
Finally I recently established a close collaboration with the Royal Institute of Natural Sciences of Belgium to study the susceptibility magnetic signal from various European Paleozoic series. All these works allowed me to gain a thorough understanding of carbonate rocks (petrology, micropaleontology, geobiology, geochemistry, sequence stratigraphy, diagenesis) as well in Precambrian (2.2 Ga and 0.6 Ga), Paleozoic (from Silurian to Carboniferous) and Mesozoic (Jurassic and Cretaceous) rocks. Recently (2010) I have established a collaboration with Iraqi Kurdistan as part of a government program to boost scientific research in this country.
My research led me to publish about 180 papers in international and national journals and presented more than 170 conference papers. I am a holder of eight courses at the ULB (5 mandatory and 3 optional), excursions and field stages, I taught at the third cycle in several French universities and led or co-managed a score of 20 Doctoral (PhD) and Post-doctoral theses and has been the promotor of more than 50 Masters theses.
There’s periods where it’s busy and quiet and busy and quiet, but no trend,” said Landsea, “There’s no statistical change over a 130-year period. Since 1970, the number of hurricanes globally is flat. I haven’t seen anything that suggests that the hurricane intensity is going to change dramatically. It looks like a pretty tiny change to how strong hurricanes will be. It’s not zero, but it’s in the noise level. It’s very small.”
Some have speculated that the distribution of relative humidity would remain roughly constant as climate changes (Allen and Ingram 2002). Specific humidity can be thought of as “absolute” humidity or the total amount of water vapor in the atmosphere. We will call this amount “TPW” or total precipitable water with units of kg/m2. As temperatures rise, the Clausius-Clapeyron relationship states that the equilibrium vapor pressure above the oceans should increase and thus, if relative humidity stays the same, the total water vapor or specific humidity will increase. The precise relationship between specific humidity and temperature in the real world is unknown but is estimated to be between 0.6 to 18% (10-90%ile range) per degree Celsius from global climate model results (Allen and Ingram 2002) …
The paper is quite technical and focuses specifically on Chinese temperature trends. But, we think that it will still be of interest to many readers here, especially anybody who is interested in any of the following topics:
Urbanization bias
The homogenization of temperature data
The “early 20th century warm period” found in many parts of the Northern Hemisphere, and
Comparing temperature proxies to instrumental records
Voters across Europe have lost faith in politics partly because of “unachievable targets” on renewable energy, said German Energy Minister Peter Altmaier, who rejected calls from a group of other EU countries to boost the share of renewables to 33-35% of the bloc’s energy mix by 2030. —EurActive, 12 June 2018
The German government is about to concede officially that the country is on course to widely missing its 2020 climate target. —Clean Energy Wire, 12 June 2018
Lack of information is a major problem in reconstructing and understanding climate and climate mechanisms. H.H.Lamb gave it as his reason for creating the Climatic Research Unit (CRU).
Notice he is talking about “the facts”, which includes data and other measures. Chief among the other measures are accurate chronologies, which is why he discusses dates and dating methods at some length in Volume 2 of his Climate, Present, Past and Future.
Lamb also divided climate studies into three major areas based on time and method. The secular or instrumental period covers at most 100 years. Few stations are longer and almost all are in Western Europe or eastern North America. The historical period includes the recorded works of humans and covers at most 3000 years. The biologic/geologic record covers the remainder of time. The degree of accuracy diminishes both in measures, such as temperature and precision of dates, as you go back in time. One tragedy of the “hockey stick” rarely discussed was that it misused and demeaned the value of one of the few measures that transcends two or three of these divisions.
WUWT reader “ES” writes: It is not bad enough we have global warning but, now we have warming on the moon. “increased from 1.6 C to 3.5 C over the roughly six-year period measurements were being taken.”
Astronauts’ movement increased subsurface temperatures on the moon, study finds.
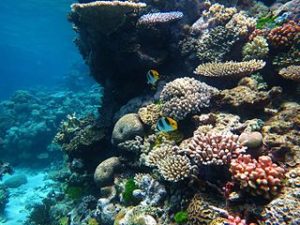
After half a billion million years of climate change, I’m shocked, shocked I tell you, that life on Earth (and specifically corals) have so many ways to cope with the climate changing. After all, it’s natural (if you are trained by Greenpeace) to assume that corals can only survive in a world with one constant stable temperature just like they never had.
One more tool in the coral-reef-workshop
Corals don’t just have a tool-box, they have a Home Depot Warehouse. h/t to GWPF
The Kremlin has masterminded an elaborate scheme to undermine American fossil-fuel production and distribution, concludes a report by the U.S. House Committee on Science, Space, and Technology.
Released March 1, the report, “Russian Attempts to Influence U.S. Domestic Energy Markets by Exploiting Social Media,” reveals how Russia has teamed up with U.S. and European environmental groups to use such popular outlets as Facebook, Twitter, and Instagram to turn American public opinion against the domestic oil and natural gas industry.
With the United States having surpassed Russia as the world’s largest producer of natural gas, and now ranking as the world’s fastest-growing producer of oil, the Russians have reason to fear what is more than a little competition. Saying America’s soaring energy development “poses a direct threat to Russian energy interests,” the report explains: …
Global climate change, fueled by skyrocketing levels of atmospheric carbon dioxide, is siphoning oxygen from today’s oceans at an alarming pace — so fast that scientists aren’t entirely sure how the planet will respond.
(…)
Millions of years ago, scientists discovered, powerful volcanoes pumped Earth’s atmosphere full of carbon dioxide, draining the oceans of oxygen and driving a mass extinction of marine organisms.
by Amanda Morris, June 4, 2018 inNorthwesternUniversity
A tiny clue found in ancient sediment has unlocked big secrets about Greenland’s past and future climate.
Just beyond the northwest edge of the vast Greenland Ice Sheet, Northwestern University researchers have discovered lake mud that beat tough odds by surviving the last ice age. The mud, and remains of common flies nestled within it, record two interglacial periods in northwest Greenland. Although researchers have long known these two periods — the early Holocene and Last Interglacial — experienced warming in the Arctic due to changes in the Earth’s orbit, the mix of fly species preserved from these times shows that Greenland was even warmer than previously thought.
The global increase in the atmosphere’s CO2 content has been hypothesized to possess the potential to harm coral reefs directly. By inducing changes in ocean water chemistry that can lead to reductions in the calcium carbonate saturation state of seawater (Ω), it has been predicted that elevated levels of atmospheric CO2 may reduce rates of coral calcification, possibly leading to slower-growing — and, therefore, weaker — coral skeletons, and in some cases even death.
In contrast, two new papers cite evidence that the timing of the lagged CO2 response to temperature changes may have ranged between 1300 and 6500 years in some cases. It would appear that a millennial-scale lagged response to temperature undermines the claim that CO2 concentration changes were a driver of climate in the ancient past.
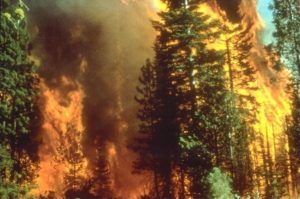
On June 8th, the California Department of Forestry and Fire Protection (Cal Fire) made its first official announcement via press release that 12 big Northern California wildfires in October 2017 were caused by problems associated with electric utility power lines.
The October 2017 Fire Siege involved more than 170 fires and burned at least 245,000 acres in Northern California. About 11,000 firefighters from 17 states and Australia helped battle the blazes. They concluded that 12 Wildfires in Mendocino, Humboldt, Butte, Sonoma, Lake, and Napa Counties were caused by Pacific Gas & Electric (PG&E) “power and distribution lines, conductors and the failure of power poles.”
The words “global warming” and “climate change” were conspicuously absent from the announcement even…
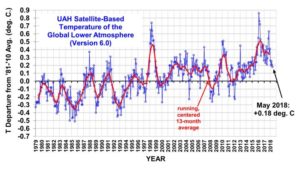
The Version 6.0 global average lower tropospheric temperature (LT) anomaly for May, 2018 was +0.18 deg. C, down a little from the April value of +0.21 deg. C :
Solar cycle 24 is ending and we are approaching a time of minimal solar activity between solar cycles 24 and 25, known as a solar minimum. Despite claims that we understand how the Sun works, our solar predictive skills are still wanting, and the Sun continues to be full of surprises.
The surprising 2008 solar minimum
Solar scientists did not pay much attention to the early warning signs that the Sun was behaving differently during solar cycle 23 (SC23), and to most the surprise came when the expected solar minimum failed to show up in 2006. The SC23-24 minimum took place two years later (Dec 2008, according to SIDC), and despite showing only a tiny difference in total solar irradiation compared to previous minima of the space age, it displayed significantly reduced solar wind speed and density, extreme-UV flux was 10% reduced, the polar fields were 50% smaller, and the interplanetary magnetic field strength was 30% below past minima.
Trois révolutions énergétiques depuis à peine plus d’un siècle. Nous sommes entrés dans la troisième révolution énergétique. La première vit le jour avec la machine à vapeur et participa à l’essor du charbon, avec la seconde le moteur thermique dérôna le charbon au profit des hydrocarbures, et la troisième révolution industrielle, en cours, est technologique et basée sur les énergies ‘vertes’ ou énergies intermittentes et l’informatique ou le numérique. Cette problématique vient d’être abordée dans un excellent ouvrage paru en 2018 .
Peut-on dire que cette progression récente suivant ces trois phases majeures de la technologie s’est effectuée dans le sens d’un meilleur respect de l‘état de la Planète. Bien que cela soit le discours officiel, rien n’en est moins sûr. Pourquoi ? Tout simplement par le méconnaissance de tout un chacun à comprendre ou savoir ce qui est réellement utilisé dans les énergies vertes et numériques. L’actuelle ‘transition énergétique’ a bon dos et elle a toutes les vertus, elle est propre, quant aux les hydrocarbures, le charbon, l’uranium et CO2 (ennemi n° 1) ils ont tous les maux, et sont tous sales. Il n’est pas un jour où cette opposition nous est rappelée…
A team of researchers from the U.K. Met Office, Sweden and Australia has found that three periods of global warming slowdown since 1891 were likely due to natural causes rather than disruptions to the factors causing global warming. In their paper published on the open access site Science Advances, the group describes their study of global mean surface temperatures (GMST) since the late 19th century and what they found.
In this new paper, the researchers looked at GMST as registered by multiple sources around the globe over the past 127 years, noting the slow march of temperature increases. More specifically, they noted the three previously identified slowdowns in GMST increases—the time periods from 1896 to 1910, from 1941 to 1975, and then from 1998 to 2013. They then looked at factors that could have contributed to these slowdowns and found natural causes for each. (…)
The following true story is a cautionary tale for scientists against making quick judgements about what seems impossible. Or indeed for any “experts” believing that they know best and ignoring any evidence contrary to what they believe. Does this ring any bells relating to the global warming hypothesis?
We have mentioned countless times on this blog that the warming oceans are evidence that CO2 is not the cause of global warming. To understand the climate you must first understand the oceans. The oceans control the global climate. As the oceans warm, they warm and alter the humidity of the atmosphere above them. The problem is, as we have pointed out countless times, CO2’s only defined mechanism by which to affect climate change is through the thermalization of LWIR between 13 and 18µ.
LWIR between 13 and 18µ doesn’t penetrate or warm the oceans. Visible radiation, mainly from the high energy blue end of the spectrum does. CO2 is transparent to incoming visible radiation. The energy stored in the atmosphere and land is insignificant when compared to the oceans. The oceans contain 2,000x the energy of the atmosphere, so small changes to the oceans can mean big changes in the atmospheric temperature. The oceans also produce vast amounts of CO2 (20 x the amount man produces), and the most abundant and potent greenhouse gas, water vapor.
As far as global temperature goes it’s been a warmish start to the year, though not exceptional. This has led Carbon Brief in its three-monthly “state of the climate” report to predict that this year “is likely” to be as warm as the fourth warmest year since records began about 150 years ago. They say it could be as high as the second or as low as the 12th warmest.
Carbon Brief says, “The first three months of 2018 can give some sense of what to expect for the entire year.” But being based on a quarter of this year’s monthly measurements it could be described as either bold or foolish. Because the prediction is made without a good understanding of what has been happening to the global temperature in the past months it is probably more of the latter.
Nowhere is the Carbon Brief prediction is there any analysis of why 2018 got off to a warm start. Look towards the Tasman Sea that has been adding to global temperatures since late 2017.
The water temperature in the Tasman Sea is well above normal – 6° C more than average for the start of December. New Zealand’s summer was the hottest on record, Tasmania had its hottest November-January on record. It was exceptionally warm on both sides of the Tasman, more than two degrees above average in December and part of January.
Presently sea surface temperatures (SST) are the best available indicator of heat content gained or lost from earth’s climate system. Enthalpy is the thermodynamic term for total heat content in a system, and humidity differences in air parcels affect enthalpy. Measuring water temperature directly avoids distorted impressions from air measurements. In addition, ocean covers 71% of the planet surface and thus dominates surface temperature estimates. Eventually we will likely have reliable means of recording water temperatures at depth.
Recently, Dr. Ole Humlum reported from his research that air temperatures lag 2-3 months behind changes in SST. He also observed that changes in CO2 atmospheric concentrations lag behind SST by 11-12 months. This latter point is addressed in a previous post Who to Blame for Rising CO2?
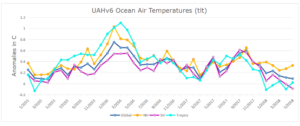
The May update to HadSST3 will appear later this month, but in the meantime we can look at lower troposphere temperatures (TLT) from UAHv6 which are already posted for May. The temperature record is derived from microwave sounding units (MSU) on board satellites like the one pictured above… (…)
La géologie, une science plus que passionnante … et diverse