Tous les articles par Alain Préat

Full-time professor at the Free University of Brussels, Belgium apreat@gmail.com apreat@ulb.ac.be • Department of Earth Sciences and Environment Res. Grp. - Biogeochemistry & Modeling of the Earth System Sedimentology & Basin Analysis • Alumnus, Collège des Alumni, Académie Royale de Sciences, des Lettres et des Beaux Arts de Belgique (mars 2013). http://www.academieroyale.be/cgi?usr=2a8crwkksq&lg=fr&pag=858&rec=0&frm=0&par=aybabtu&id=4471&flux=8365323 • Prof. Invited, Université de Mons-Hainaut (2010-present-day) • Prof. Coordinator and invited to the Royal Academy of Sciences of Belgium (Belgian College) (2009- present day) • Prof. partim to the DEA (third cycle) led by the University of Lille (9 universities from 1999 to 2004) - Prof. partim at the University of Paris-Sud/Orsay, European-Socrates Agreement (1995-1998) • Prof. partim at the University of Louvain, Convention ULB-UCL (1993-2000) • Since 2015 : Member of Comité éditorial de la Revue Géologie de la France http://geolfrance.brgm.fr • Since 2014 : Regular author of texts for ‘la Revue Science et Pseudosciences’ http://www.pseudo-sciences.org/ • Many field works (several weeks to 2 months) (Meso- and Paleozoic carbonates, Paleo- to Neoproterozoic carbonates) in Europe, USA (Nevada), Papouasia (Holocene), North Africa (Algeria, Morrocco, Tunisia), West Africa (Gabon, DRC, Congo-Brazzaville, South Africa, Angola), Iraq... Recently : field works (3 to 5 weeks) Congo- Brazzaville 2012, 2015, 2016 (carbonate Neoproterozoic). Degree in geological sciences at the Free University of Brussels (ULB) in 1974, I went to Algeria for two years teaching mining geology at the University of Constantine. Back in Belgium I worked for two years as an expert for the EEC (European Commission), first on the prospecting of Pb and Zn in carbonate environments, then the uranium exploration in Belgium. Then Assistant at ULB, Department of Geology I got the degree of Doctor of Sciences (Geology) in 1985. My thesis, devoted to the study of the Devonian carbonate sedimentology of northern France and southern Belgium, comprised a significant portion of field work whose interpretation and synthesis conducted to the establishment of model of carbonate platforms and ramps with reefal constructions. I then worked for Petrofina SA and shared a little more than two years in Angola as Director of the Research Laboratory of this oil company. The lab included 22 people (micropaleontology, sedimentology, petrophysics). My main activity was to interpret facies reservoirs from drillings in the Cretaceous, sometimes in the Tertiary. I carried out many studies for oil companies operating in this country. I returned to the ULB in 1988 as First Assistant and was appointed Professor in 1990. I carried out various missions for mining companies in Belgium and oil companies abroad and continued research, particularly through projects of the Scientific Research National Funds (FNRS). My research still concerns sedimentology, geochemistry and diagenesis of carbonate rocks which leads me to travel many countries in Europe or outside Europe, North Africa, Papua New Guinea and the USA, to conduct field missions. Since the late 90's, I expanded my field of research in addressing the problem of mass extinctions of organisms from the Upper Devonian series across Euramerica (from North America to Poland) and I also specialized in microbiological and geochemical analyses of ancient carbonate series developing a sustained collaboration with biologists of my university. We are at the origin of a paleoecological model based on the presence of iron-bacterial microfossils, which led me to travel many countries in Europe and North Africa. This model accounts for the red pigmentation of many marble and ornamental stones used in the world. This research also has implications on the emergence of Life from the earliest stages of formation of Earth, as well as in the field of exobiology or extraterrestrial life ... More recently I invested in the study from the Precambrian series of Gabon and Congo. These works with colleagues from BRGM (Orléans) are as much about the academic side (consequences of the appearance of oxygen in the Paleoproterozoic and study of Neoproterozoic glaciations) that the potential applications in reservoir rocks and source rocks of oil (in collaboration with oil companies). Finally I recently established a close collaboration with the Royal Institute of Natural Sciences of Belgium to study the susceptibility magnetic signal from various European Paleozoic series. All these works allowed me to gain a thorough understanding of carbonate rocks (petrology, micropaleontology, geobiology, geochemistry, sequence stratigraphy, diagenesis) as well in Precambrian (2.2 Ga and 0.6 Ga), Paleozoic (from Silurian to Carboniferous) and Mesozoic (Jurassic and Cretaceous) rocks. Recently (2010) I have established a collaboration with Iraqi Kurdistan as part of a government program to boost scientific research in this country. My research led me to publish about 180 papers in international and national journals and presented more than 170 conference papers. I am a holder of eight courses at the ULB (5 mandatory and 3 optional), excursions and field stages, I taught at the third cycle in several French universities and led or co-managed a score of 20 Doctoral (PhD) and Post-doctoral theses and has been the promotor of more than 50 Masters theses.

Energy Returned on Capital Invested: Ohio “Shale” vs Green “Schist”

by D. Middleton, December 2, 2019 in WUWT


Ohio’s shale energy industry attracts nearly $78 billion in investment since 2011
11/20/2019

COLUMBUS, OHIO – Total investment in Ohio’s resource rich shale energy sector has reached $78 billion since tracking began in 2011, according to a Cleveland State University (CSU) study.

Prepared for JobsOhio, the report represents the most recent data available and covers shale investment through the second half of 2018. Earlier in the year, IHS Markit released estimates that by 2040, the Utica and Marcellus shale region, of which Ohio is a significant part, will supply nearly half of all U.S. natural gas production.

The study from CSU’s Energy Policy Center at the Maxine Goodman Levin College of Urban Affairs, showed drilling investments were slightly down in the second half of 2018 compared to the first half, but total upstream investments were up. Total shale-related investment in Ohio for the second half of 2018, including upstream, midstream and downstream, was around $3.82 billion. Total investment from 2011-2018 totaled about $77.7 billion.

[…]

World Oil

Climatologist On The State Of Climate Change Ahead Of COP25

by J. Curry, December 2, 2019 in ClimateChangeDispatch


The UN Climate Change Conference this week in Madrid provides an important opportunity to reflect on the state of the public debate surrounding climate change.

The UN Climate Conference (COP25) is beginning today in Madrid. I’ve been invited to write an op-ed for a newspaper in Madrid, which I assume will be published sometime this week (in Spanish). Below is the text of my op-ed.

JC op-ed

The UN Climate Change Conference this week in Madrid provides an important opportunity to reflect on the state of the public debate surrounding climate change.

Most of the world’s governments are prioritizing energy security, affordability and industrial competitiveness over commitments made for the Paris climate agreement.

Continuer la lecture de Climatologist On The State Of Climate Change Ahead Of COP25

Doomsday awaits? NASA predicts the odds of two asteroids that are now headed toward earth

by Nirmal Narayanan, November 30, 2019 in InternationalBusinessTimes


Several space experts believe that earth will face an extinction event following a dreaded asteroid hits

It was on last July that NASA discovered a giant asteroid named 2019 ND7. This doomsday rock is more than 200 meters wide, and a potential hit on the planet could wipe out a city within a fraction of a second. Experts believe that a potential collision with 2019 ND7 will unleash energy equivalent to more than 1,000 atomic bombs exploded in Hiroshima during World War II, and millions of people will lose life instantly.

However, the chances of asteroid 2019 ND7 hitting the earth are very small. The United States space agency has calculated the risk at 1 in 310,000, which means there is a 99.99968 chance that this dangerous space rock will miss the earth. 2019 WG2 is a small asteroid when compared to 2019 ND7.

The asteroid is 35 meters wide, and NASA has calculated the risk at 1 in 4,000. As per NASA, 2019 ND7 may crash into the earth between 2097-2117 on 20 different occasions. On the other hand, 2019 WG2 may hit between 2098 and 2119 on 56 different occasions.

Is coal power winning the US-China trade war?

by P.  Homewood, December 1, 2019 in NotaLotofPeopleKnowThat


China has signalled that coal power will be a top priority within national energy policy as the government prepares its next Five Year Plan (2021-25).

On 11 October, Premier Li Keqiang chaired a meeting of the National Energy Commission in Beijing that emphasised China’s energy security and coal utilisation and downplayed the importance of a rapid transition away from fossil fuels.

Each meeting of the commission, which was established in 2010 and has met only four times, has had a significant impact on policymaking. Chaired by Premier Li and attended by more than 20 chiefs of China’s ministries and bureaus, the commission is the top body for coordinating energy policy.

Why is energy security back at the top of the agenda?

Li told the conference: “The government should diversify energy supply to improve energy security… enhance domestic oil and gas exploration and development efforts, and promote oil and gas reserves and production, in order to improve oil and gas self-sufficiency”.

The renewed focus on energy security comes amid an increase in domestic consumption of oil and gas, which is largely being met through imports. China’s dependence on energy imports rose from 9% in 2014 to more than 20% in 2018.

China’s domestic crude oil production has declined and efforts to tap unconventional sources of natural gas, such as shale gas and coalbed methane, have faltered.

Other causes for concern lie outside China. The ongoing trade dispute with the US is a threat to the energy trade between the two superpowers, and supplies from the Middle East are at risk from mounting instability in the region.

Geothermal Energy: The Great COP25 Climate Surprise?

by Eric Worrall, November 30, 2019 in WUWT


For a long time Geothermal energy has been an expensive joke, even for people who claim solar and wind power is viable. History is littered with Geothermal projects which failed to live up to their early promise, such as the Tim Flannery inspired Cooper Basin project, which obliterated at least $90 million in government grant money before the project was abandoned.

But there are some hints that COP25 might include an attempt to breath new government money into this failed renewable energy technology.

From Chile, posted in April this year

Three Graphs

by Kip Hansen, November 30, 2019 in WUWT


Now an annotated version of the second graph:

Here we have the second graph 1850-2015, with the global Average Surface Temperature anomaly (again — baseline 15 CE)  but I have dropped in a smaller window, on the left, bringing forward  the Roman Warm Period and the Medieval Warm Period (MWP) — the years 100-800 CE (same scale) — to illustrate the difference between the peak Global Average Surface Temperature (GAST)  of the Medieval Warm Period to the most current GAST on the graph (2015).

This exposes the ubiquitous trick of the Climate Debate, in which Global Temperatures are [almost] always shown only from the depths of the Little Ice Age (clearly marked on the first graph by Gebbie), resulting in images similar to Gebbie’s Figure 2 — despite the fact that most 2 millennia reconstructions clearly show the Roman and Medieval Warm Periods as generally in the same range as the Modern Warm Period.   Given the acknowledged range of error  in any temperature reconstruction and in modern estimates of global surface temperatures (today, in absolute temperatrures,  around +/- 0.5ºC  or a range of 1ºC)  — there may be little, if any,  significant-to-the-global-environment difference  between the two periods.

The Medieval Warm period did not result in a “Climate Catastrophe”  and the [iffy] little additional 0.2°C  seen today  is very unlikely to spark a modern Climate Catastrophe either.

SAN FRANCISCO TIES 1896 RECORD FOR COLDEST NOVEMBER DAY EVER!

by Cap Allon, November 30, 2019 in Electroverse


The mercury in San Francisco reached a high of just 8.8C (48F) on Thursday, November 28, tying the 1896 (solar minimum of cycle 12) record for the city’s lowest-max temp ever recorded in November.


And San Francisco wasn’t alone in dealing with below-average temperatures late last week. According to the National Weather Service, much of the interior North Bay suffered sub-zero readings overnight Thursday:

Novato Airport recorded a nipple-hardening -5C (23F).

Santa Rosa and Napa County Airport dipped to -3.3C (26F).

Sonoma Airport bottomed out at -2.8C (27F).

While temps touched freezing point at Livermore Airport.

2.8C (37F) at Oakland Airport and San Jose.

And 5C (41F) in San Francisco.

(Readings all highly unusual for the time of year).


New Paper Presents Photo Evidence Affirming Equatorial Region Sea Levels Have FALLEN Since The 1600s

by K. Richard, November 29, 2019 in NoTricksZone


In a new paper (Mörner, 2019, expanding upon Mörner, 2017), photo evidence confirms sea levels in 5 studied equatorial regions have fallen by about 60 cm since the 17th century…and remained stable since the 1970s.

Another new study (Haryono et al., 2019) of sea level change in equatorial Indonesia also supplies photos of marine terrace biomarker evidence affirming sea levels were about 5 meters higher than they are today between 5000 to 3000 years before present, suggesting “it means it was warmer than the present day” back then.

WH’S “POLAR BEAR VIEWING SEASON” ENDS EARLY FOR THE THIRD YEAR IN A ROW BECAUSE OF TOO MUCH ICE!

by Cap Allon, November 19, 2019 in Electroverse


2019 is now the third year in a row in which the refreezing of Western Hudson Bay (WH) ice has come earlier than the 1980s average date of November 16, as reported by polarbearscience.com.

Livecams over at explore.org have confirmed a key indicator that the ice is back — the polar bears of WH have begun their winter trek back onto the bay.

The redeveloping sea ice may be good news for the bears, but it’s bad for tourists — after a short five months with the Sailors of the Floe on land, their departure now means the ‘polar bear viewing season’ in Churchill, Manitoba, is ending early, just as it did last year, and the year before. In fact, on the back of what have been five good sea ice seasons in succession for WH polar bears, this year’s repeat of an early freeze-up means a sixth good ice season is now likely for 2019-2020 — less kerching for the region.

L’Optimum Climatique Médiéval : ce Grand Oublié !

by A. Préat, 29 novembre 2019 in ScienceClimatEnergie


1/ Introduction

Comme rappelé dans un précédent article (ici) les événements hyperthermiques sont fréquents tout au long de l’histoire de la Terre. Bien que fréquents et étudiés avec détail, force est de reconnaître que le ‘fin’ mot de leur origine n’est toujours pas connu, sauf à leur attribuer à tous un lien de parenté avec l’un ou l’autre des gaz dits à effet de serre, sans qu’une démonstration en bonne et due forme soit présentée. C’est ce que décortique l’article paru dans SCE (ici) pour un des événements hyperthermiques les plus intenses (événement PETM pour Paleocene-Eocene Thermal Maximum) s’étant déroulé au début de l’ère Cénozoïque il y a environ 56 millions d’années.

Rappelons la succession de ces événements au Cénozoïque, d’abord l’événement PETM, ensuite E-O (Eocene-Oligocene transition with climatic shift), MMCO (Mid-Miocene Climatic Optimum), MPTO (Mid-Pliocene Thermal Optimum) et depuis environ 10 000 ans l’Optimum Holocène. Ces événements montrent tous que la Terre a régulièrement connu de longues périodes chaudes avec des ‘températures moyennes globales’ plus élevées que l’actuelle (voir par exemple Cronin 2010, également mentionné sur de nombreux sites web). L’indicateur climatique communément utilisé , la température moyenne globale est loin d’être parfait (ici et ici). Il ne faut donc pas prendre au pied de la lettre cette notion de ‘température moyenne globale’ car déjà pour aujourd’hui elle est plus que discutable, et pour le passé elle est plus qu’inconnue. Mais il n’en reste pas moins vrai que lors des événements hyperthermiques ou des optima climatiques la température était plus élevée qu’actuellement, nous le savons grâce à de nombreux indicateurs ou ‘proxies’ (voir plus loin). Ces événements ne concernent pas uniquement le Cénozoïque (y compris l’Holocène) mais l’ensemble de l’échelle des temps géologiques au-delà du Cénozoïque, avec parfois des températures fort supérieures à celles du Cénozoïque, comme par exemple au Permien (ici).

2/ L’Optimum Climatique Médieval

Revenons aux temps actuels, c’est-à-dire aux temps historiques. Plusieurs Optima Climatiques se succèdent depuis environ 6000 ans, avec pour la période la plus proche de nous, c’est-à-dire environ 3500 ans, la succession des Optima Climatiques Minoen, Romain, Médiéval et Actuel (Figure 1). Le plus récent est l’Optimum Climatique Médiéval (OCM) dont l’acmé se situe aux alentours de l’an mil. S’agissant de températures à peine plus élevées (1,5°C cfr ici et Le Roy Ladurie, 1967, également 1.0-1.4°C in Easterbrook, 2011), la délimitation précise de cet intervalle par rapport aux périodes encadrantes est difficile et l’OCM est finalement compris du 8ème au 13ème siècle (= le ‘petit optimum du Moyen Age’ d’environ 700 à 1350 sensu Le Roy Ladurie, 1967).

Figure 8 (cfr. Figure 5 in Préat, 2019). Capture d’écran de la Figure 8 de Scafetta (2019) : On the reliability of computer-based climate models. IJEGE, 19, 49-70. En comparant les deux courbes on peut se demander si l’on parle de la même chose! (RWP Roman Warm Period, DACP Dark Age Cold Period ou période froide post-romaine, MWP Medieval Warm Period, LIA Little Ice Age, CWP Current  Warm Period). Pour rappel la courbe A du haut, est la fameuse courbe en forme de hockey de Mann et al. 1998 du GIEC.

Why Apocalyptic Claims About Climate Change Are Wrong

by P. Homewood, November 29, 2019 in NotaLotoPeopleKnowThat


Journalists and activists alike have an obligation to describe environmental problems honestly and accurately, even if they fear doing so will reduce their news value or salience with the public. There is good evidence that the catastrophist framing of climate change is self-defeating because it alienates and polarizes many people. And exaggerating climate change risks distracting us from other important issues including ones we might have more near-term control over.

I feel the need to say this up-front because I want the issues I’m about to raise to be taken seriously and not dismissed by those who label as “climate deniers” or “climate delayers” anyone who pushes back against exaggeration.

With that out of the way, let’s look whether the science supports what’s being said.


See also: Michael Shellenberger: Apocalypse Cancelled?

UK ON COURSE FOR AN HISTORICALLY COLD NOVEMBER

by Cap Allon, November 19, 2019 in Electroverse


After decades of being lectured by the Met Office -among others– that global warming will bring an end to extreme-cold temperatures, the UK still somehow keeps-on clocking them — yet another example of how simple real-world observations can unravel the AGW-ruse.

Brits have been suffering-through an historically cold month, too — November’s average temperature has held well-below the norm for the first 17 days, continuing October’s dramatic cooling trend:

The Central England Temperature (CET) record measures the monthly mean surface air temperatures for the Midlands region of England, and is the longest series of monthly temperature observations in existence anywhere in the world.

Its mean reading for November 2019 (to the 17th) is sitting at 6.6C — that’s 0.7C below the already cool 1961-1990 average, the current standard period of reference for climatological data used by the WMO.

In the 360 years of CET data, there have only been 10 other years with an November average temperature of 6.6C — these are 1804, 1833, 1835, 1849, 1886, 1932, 1941, 1949, 1977, 1980.

Note also how the majority of these years fall in or around solar minimums of the past (1804, 1849, and 1980 being the only exceptions).

More Real Data Totally Contradict Fake Media… Show Scandinavia, Ireland NOT WARMING Over Past Decades

by P. Gosselin , November 27, 2019 in NoTricksZone


Global warming alarmists like to tell us the planet is warming faster and faster.

Yet, when we look objectively at the untampered data, we see this is not the case at all at many locations.  Today we look at the (untampered) data from the Japan Meteorology Agency (JMA) for some stations across northern Europe for the month of October.

According to global warming believers, winter is supposed to be coming later, and spring arriving earlier. So looking at the season transition month of October is interesting.

Ireland

At the JMA we find seven stations in Ireland that have October data going back sufficiently to 1994:

European Parliament Told: There is No Climate Emergency

by H. Wilkinson, Nov. 13, 2019 in Intl.NewsEu/GWPF


At a press conference on Wednesday (20th November), the European Parliament was told: ‘there is no climate emergency’. One MEP became emotional and accused the organisers of ‘collective manslaughter’ on future generations.

The press conference was hosted by the European Conservatives and Reformists group in the European Parliament, who formally received the climate declaration from Professor Guus Berkhout.

Professor Berkhout represents the Climate Intelligence Foundation (Clintel), a Dutch group who have collected signatures from over 700 prominent scientists and professionals in support of the basic statement: there is no climate emergency.

Signatories include Nobel laureate, Professor Ivar Giaever, who made important experimental discoveries regarding superconductors, and the influential mathematician and physicist Professor Freeman Dyson.

The Liberal Democrat MEP, Irina von Wiese, took umbrage at the declaration, and refused to believe IPCC statements about a lack of any global trends in extreme weather events.

The declaration was supported by an addendum, setting out the scientific justification for the statement:

Natural as well as anthropogenic factors cause warming

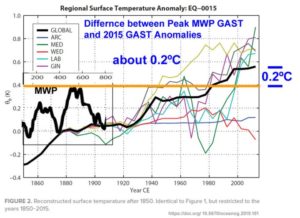
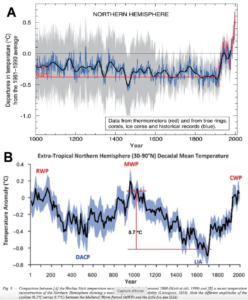
The geological archive reveals that Earth’s climate has varied as long as the planet has existed, with natural cold and warm phases. The Little Ice Age ended as recently as 1850. Therefore, it is no surprise that we now are experiencing a period of warming.

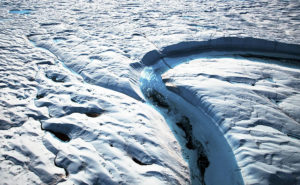
Warming is far slower than predicted

The world has warmed at less than half the rate predicted by IPCC on the basis of modeled anthropogenic forcing and radiative imbalance. It tells us that we are far from understanding climate change.

Climate policy relies on inadequate models

Climate models have many shortcomings and are not remotely plausible as global policy tools. They blow up the effect of greenhouse gases such as CO2. In addition, they ignore the fact that enriching the atmosphere with CO2 can also be beneficial.

CO2 is plant food, the basis of all life on Earth

CO2 is not a pollutant. It is essential to all life on Earth. Photosynthesis is a blessing. More CO2 is beneficial for nature, greening the Earth: additional CO2 in the air has promoted growth in global plant biomass. It is also good for agriculture, increasing the yields of crops worldwide.

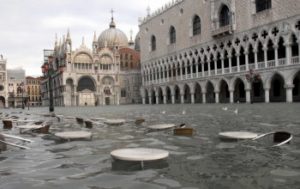
Global warming has not increased natural disasters

There is no statistical evidence that global warming is intensifying hurricanes, floods, droughts and suchlike natural disasters, or making them more frequent. However, there is ample evidence that CO2-mitigation measures are as damaging as they are costly.

Climate policy must respect scientific and economic realities

There is no climate emergency. Therefore, there is no cause for panic and alarm. We strongly oppose the harmful and unrealistic net-zero CO2 policy proposed for 2050. If better approaches emerge, and they certainly will, we have ample time to reflect and re-adapt. The aim of global policy should be ‘prosperity for all’ by providing reliable and affordable energy at all times. In a prosperous society men and women are well educated, birthrates are low and people care about their environment.

No, Venice Isn’t Flooding Due To Climate Change

by J. Delingpole, No. 14, 2019 in ClimateChangeDispatch


Venice is flooded – again – and the mayor Luigi Brugnaro is blaming climate change.

This has become the standard dog-ate-my-homework excuse for desperate politicians and administrators who want to dodge their responsibilities while simultaneously attracting media sympathy and aid money.

But it’s rubbish, of course. The real reason for Venice’s plight is in whichever idiot decided all those years ago to build the city on a series of swampy islands at the edge of a lagoon.

On the plus side, this helped the Venetians build a wealthy maritime empire and later to extract gazillions of euros from tourists who think it’s romantic being propelled in a funny looking boat down rancid, rat-infested canals by a man in a stripy shirt with a long stick. On the downside, Venice is slowly going the way of Atlantis.

There is nothing weird about Venice flooding at this time of year. From Autumn to Spring is the season known as ‘acqua alta’, when the tides in the Adriatic are higher than usual, so it’s not uncommon for attractions like Piazza San Marco to be inundated with water rather than the usual hapless travelers being fleeced for a 20 Euro cappuccino.

In 2003, Venice began building a flood barrier – known as Moses – which was supposed to put an end to all that.

But as is the way with Italian public works projects — in fact, all public works projects everywhere — it has run fearfully overbudget, become riddled with corruption, and taken much longer than originally planned.

According to Business Insider:

N. Hemisphere In Hypothermia! Widespread Early Winter…”Historic Snowstorms”…”Record Books Rewritten”

by P. Gosselin, November 13, 2019 in NoTricksZone


Winter has not even officially arrived, but already large areas of the northern hemisphere are seeing “historic snowfalls”, frigid temperatures and even avalanche alarms.

The Northern Hemisphere has certainly caught a major cold, one certainly not caused by the human CO2 virus. Instead of fever, parts of the northern hemisphere are in hypothermia!

Alarmists, media desperate

Though global warming scientists will never admit it, they are really surprised and stunned. All that is left for them is to make up some cockamamie warming-causes-cold explanations and hope there are enough severely stupid among the media and masses to believe it.

“United States — Rewrite the Record Books”

Beginning in North America, “sub-zero temperatures are now blasting” millions of Americans following “the three historic snowstorms which buried parts of the U.S. last month,” reports weather site electroverse.net here.

Electroverse writes that “lows throughout the week will be more like January temperatures” with readings below zero for many U.S. states and “temps down into the teens are even forecast as far south as Texas.” Yesterday, 97 records toppled.

“It’s a big deal,” Electroverse writes in its headline.

Solar activity suspected

It’s not the sort of thing we are supposed to be expecting from a “warming planet”.  Some climate experts blame natural factors, like solar activity, for the cold, and that these warnings have long been known since the sun has entered a new period of calm.

Freeze watches and warnings also extend as far south as Florida. And it’s only early November. And don’t expect to see many FFF activists to show up at rallies protesting hot weather any time soon.

Polar Bear Science site here also reports that the Hudson Bay in Canada has started freezing up earlier than normal three years in a row!

Europe starting to get clobbered by snow, 2m in Alps

Meanwhile cold has also spread across Europe, though not quite as brutal as what we’ve been seeing across North America.

THE DANISH METEOROLOGICAL INSTITUTE ADMITS IT WRONGLY REPORTED GREENLAND’S “RECORD WARM TEMPERATURE” THIS SUMMER

by Cap Allon, November 17, 2019 in Electroverse


The Danish Meteorological Institute (DMI) admitted it wrongly reported Greenland’s record summer warmth, in what it called “good news from a climate perspective”…?

The DMI, a key player in monitoring Greenland’s climate, reported a “shocking” early-August temperature of between 2.7C (37F) and 4.7C (40.5F) at the Summit weather station, located some 3,202m above sea level at the center of the Greenland ice sheet.

This news quickly spread to every corner of the left-leaning web, like some nasty EOTW rash. But just a few days later the DMI posted a tweet retracting that record temp, saying that after a “closer look” (whatever that means exactly) it was revealed that the monitoring equipment had been giving “erroneous results”.

“Was there record-level warmth on the inland ice on Friday?” said the institute’s tweet dated Aug 08. “No! A quality check has confirmed out suspicion that the measurement was too high.”

Blue Melt River, Petermann Glacier, in remote northwestern Greenland, on Nares Strait. (Photo by: Dave Walsh/VW Pics/Universal Images Group via Getty Images)

New Report Says Fracking Saved Americans $1.1 Trillion Over Past Decade

by A. Watts, November 21, 2019 in WUWT


Research & Commentary by Tim Benson

A new report prepared by Kleinhenz & Associates for the Ohio Oil and Gas Energy Education Program shows increased oil and natural gas production from hydraulic fracturing  (“fracking”) has saved American consumers $1.1 trillion in the decade from 2008 to 2018. This breaks down to more than $900 in annual savings to each American family, or $9,000 in cumulative savings. Continuer la lecture de New Report Says Fracking Saved Americans $1.1 Trillion Over Past Decade

Scientists Cite Uncertainty, Error, Model Deficiencies To Affirm A Non-Detectable Human Climate Influence

by K. Richard, November 21, 2019 in NoTricksZone


Observational uncertainty, errors, biases, and estimation discrepancies in longwave radiation may be 100 times larger than the entire accumulated influence of CO2 increases over 10 years. This effectively rules out clear detection of a potential human influence on climate.

The anthropogenic global warming (AGW) hypothesis rides on the fundamental assumption that perturbations in the Earth’s energy budget – driven by changes in downward longwave radiation from CO2 — are what cause climate change.

According to one of the most frequently referenced papers advancing the position that CO2 concentration changes (and downward longwave radiation perturbations) drive surface temperature changes, Feldman et al. (2015) concluded there was a modest 0.2 W/m² forcing associated with CO2 rising by 22 ppm per decade.

Again, that’s a total CO2 influence of 0.2 W/m² over ten years.

In contrast, analyses from several new papers indicate the uncertainty and error values in downwelling (and outgoing) longwave radiation in cloudless environments are more than 100 times larger than 0.2 W/m².

In other words, it is effectively impossible to clearly discern a human influence on climate.


1.  Kim and Lee, 2019   Measurement errors of outgoing longwave radiation (OLR) reach 11 W/m², more than 50 times larger than total CO2 forcing over 10 years. Cloud optical thickness (COT) and water vapor have “the greatest effect” on OLR – an influence of 2.7 W/m². CO2 must rise to 800 ppm to impute an influence of 1 W/m².

Scientists: CO2 Causes Cooling When Not Causing Warming And It’s A ‘Weak’ To ‘Negligible’ Climate Factor

by K. Richard, November 14, 2019 in NoTricksZone


It’s been acknowledged by mainstream scientists for years now that at certain locations on planet Earth, rising carbon dioxide levels cause cooling. It’s now been determined that rising CO2 also causes “negligible” cooling (or warming) depending on the season.

A few years ago a seminal paper (Schmithüsen et al., 2015) was published in Geophysical Research Letters that indicated raising the concentration of CO2 causes a negative greenhouse effect, or cooling, in central Antarctica.

The forcing from the CO2 greenhouse effect ranges from -2.9 W/m² to +1 W/m², and the forcing for the Arctic (central Greenland) is said to be “comparably weak”.

Forget Climate Excuses: Environment Agency Ignored Flood Warnings For Years–The Times

by P. Homewood, Nov. 21, 2019 in NotaLotofPeopleKnowThat


As flooding spread across the country yesterday, the Association of Drainage Authorities said that warnings had been issued each year since 2007 at its annual conference, attended by Environment Agency staff.

The warnings were made by the association’s members in South Yorkshire, including John Duckitt, a farmer and elected commissioner of the drainage board that covers Fishlake near Doncaster, where parts of the village are still submerged more than a week after flooding began.

Speaking from his home yards from the Don, Mr Duckitt, 83, said that his concerns fell on “deaf ears”. He claimed that the agency “chooses to do as little as possible” and had allowed trees and plants to grow on the side of the river narrowing the channel after “ignoring local knowledge”.

“They knew about the problem and chose to ignore it,” he said. “This made the floods worse. Fair enough this flood was unprecedented but the Environment Agency, through lack of maintenance on the river, protracted the flood. It didn’t get away fast enough and did more damage.”

China Set for Massive Coal Expansion in Threat to Climate Goals

by  Bloomberg News, November 20, 2019


China has enough coal-fired power plants in the pipeline to match the entire capacity of the European Union, driving the expansion in global coal power and confounding the movement against the polluting fossil fuel, according to a report.

The nation has almost 148 gigawatts of coal-fired capacity under active construction or likely to be resumed after being suspended, Global Energy Monitor, a non-profit group that tracks coal stations, said in the report Thursday based on plant-by-plant data. That’s almost equivalent to 150 gigawatts of existing coal fleet capacity in the EU and more than the combined 105 gigawatts under construction in the rest of the world, it said.

In contrast to many other countries, including the U.K.’s pledge to shut all coal plants by 2025, Beijing remains committed to coal as its biggest source of power, representing a major challenge to global emissions reduction targets. Its additions in the 18 months to June dwarf declines elsewhere in the world, according to the report.

Raw Data Bombshell: no change in Very Hot Days in Australia since World War I

by JoNova, November 20, 2019


After we were shocked at the latest ACORN changes to our Very Hot Days data, I asked Chris Gillham if we could see the effect of Bureau of Meteorology changes to the original raw data – and he replied it would be too time-consuming writing the code to calculate 40C+ days among the millions of daily temperatures from 112 weather stations across Australia since 1910. Then he did it anyway.

Wow. In 2011, the BoM’s ACORN 1 adjustments wiped out some of the “very hot days” recorded at weather stations in the early 1900s. These were records that had stood for a whole century. Then, quietly six years later, the ACORN 2 readjustments turned the statistical air conditioner on again and cooled people from 100 years in the future.

It’s all especially miraculous given that even the old World War I  data was recorded in official BoM-approved Stevenson screens. The BoM won’t consider pre 1910 data because it wasn’t standardized, but even when it is, they still have to “fix” it. And in the intervening years after 1910, the Urban Heat Islands have grown and electronic equipment that can record one-second-records have been introduced across the nation. With the old equipment, 40C+ extremes were harder to get than with today’s micro-minute spikes caused by gusts of hot air rolling off carparks and tarmacs.

What we see in the 60 longest running ACORN sites, all open in 1910, is that the raw temperature data had just as many “very hot days” in the World War I era as it does now. Oh boy.

No wonder the BOM was keen to move the “Very Hot Days” graphics and data and tuck them away in a remote page on their website.


Thugs bully Munich Conference Center – Force Cancellation of Climate Skeptic Conference

by Anthony Watts, November 19, 2019 in WUWT


Reprinted with permission from No Tricks Zone

Just like the 1030s, and again Munich. There’s no question that freedom of science and speech are under heavy attack in Germany after dozens of distinguished but dissenting scientists have seen their long planned science conference cancelled due to intimidation by leftwing extremists.


This latest climate conference cancellation comes just after leftists coerced the University of Hamburg to disinvite political leaders from making speeches.

The same has also just occurred at the famed University of Göttingen.

The problem of suppressing open discussion has deteriorated to such an extent across Germany over the recent years that even according to leftist Spiegel 75% of journalists and writers are “very concerned” or “somewhat concerned” about the state of free speech in Germany!

Free speech in Germany is in state of crisis.

Munich NH Congress Center bullied, cancels at last minute

The latest free speech suppression and intimidation has unfolded in Munich: The 13th International Climate and Energy Conference, sponsored by the European Institute for Climate and Energy (EIKE) and CFACT, has seen its contractual agreement torn up, and was booted out of the conference facility at the last minute.

Also : Climate Extremism in the Age of Disinformation

Judith Curry: Legacy of Climategate – 10 years later

by Charles the moderator, November 15, 2019 in WUWT


As we approach the tenth anniversary of Climategate and are deluged with whitewashing and revisionist history, we will post a few articles, but cannot counter everything.

As far as we are concerned the tenth anniversary is on November 17th, the day I personally received the files.

The following post by Dr. Curry is one of the best historical retrospectives I’ve seen on the topic.~ctm

Reposted from Dr. Judith Curry’s Climate Etc.

Legacy of Climategate – 10 years later

Posted on November 12, 2019 by curryja | 121 Comments

by Judith Curry

My reflections on Climategate 10 years later, and also reflections on my reflections of 5 years ago.

Last week, an email from Rob Bradley reminded me of my previous blog post The legacy of Climategate: 5 years later. That post was the last in a sequence of posts at Climate Etc. since 2010 on Climategate; for the entire group of posts, see  [link]  Rereading these was quite a blast from the past.

While I still mention Climategate in interviews, the general reaction I get is ‘yawn . . . old hat . . . so 2010 . . . nothingburger . . . the scientists were all exonerated . . . the science has proven to be robust.’ I hadn’t even thought of a ’10 years later’ post until Rob Bradley’s email.

Now I see that, at least in the UK, the 10 year anniversary looks to be rather a big deal. Already we are seeing some analyses published in the mainstream media:

Two starkly different perspectives. While I personally think Delingpole’s article is a superb analysis, it would not surprise me if the ‘establishment’ media in the UK is looking to rewrite history and cement the ‘exoneration,’ especially with this forthcoming one hour BBC special Climategate: Science of a Scandal, set to air November 14.

According to Cliscep  (not sure what the source of this information is), McKitrick and McIntyre were both interviewed for the BBC special, but apparently McKitrick was cut completely. Lets see how they edit McIntyre.


Also:  It’s Officially the Tenth Anniversary of Climategate – and they’ve learned nothing

Also : Climategate: 10 Year Anniversary Reading List