Tous les articles par Alain Préat

Full-time professor at the Free University of Brussels, Belgium apreat@gmail.com apreat@ulb.ac.be • Department of Earth Sciences and Environment Res. Grp. - Biogeochemistry & Modeling of the Earth System Sedimentology & Basin Analysis • Alumnus, Collège des Alumni, Académie Royale de Sciences, des Lettres et des Beaux Arts de Belgique (mars 2013). http://www.academieroyale.be/cgi?usr=2a8crwkksq&lg=fr&pag=858&rec=0&frm=0&par=aybabtu&id=4471&flux=8365323 • Prof. Invited, Université de Mons-Hainaut (2010-present-day) • Prof. Coordinator and invited to the Royal Academy of Sciences of Belgium (Belgian College) (2009- present day) • Prof. partim to the DEA (third cycle) led by the University of Lille (9 universities from 1999 to 2004) - Prof. partim at the University of Paris-Sud/Orsay, European-Socrates Agreement (1995-1998) • Prof. partim at the University of Louvain, Convention ULB-UCL (1993-2000) • Since 2015 : Member of Comité éditorial de la Revue Géologie de la France http://geolfrance.brgm.fr • Since 2014 : Regular author of texts for ‘la Revue Science et Pseudosciences’ http://www.pseudo-sciences.org/ • Many field works (several weeks to 2 months) (Meso- and Paleozoic carbonates, Paleo- to Neoproterozoic carbonates) in Europe, USA (Nevada), Papouasia (Holocene), North Africa (Algeria, Morrocco, Tunisia), West Africa (Gabon, DRC, Congo-Brazzaville, South Africa, Angola), Iraq... Recently : field works (3 to 5 weeks) Congo- Brazzaville 2012, 2015, 2016 (carbonate Neoproterozoic). Degree in geological sciences at the Free University of Brussels (ULB) in 1974, I went to Algeria for two years teaching mining geology at the University of Constantine. Back in Belgium I worked for two years as an expert for the EEC (European Commission), first on the prospecting of Pb and Zn in carbonate environments, then the uranium exploration in Belgium. Then Assistant at ULB, Department of Geology I got the degree of Doctor of Sciences (Geology) in 1985. My thesis, devoted to the study of the Devonian carbonate sedimentology of northern France and southern Belgium, comprised a significant portion of field work whose interpretation and synthesis conducted to the establishment of model of carbonate platforms and ramps with reefal constructions. I then worked for Petrofina SA and shared a little more than two years in Angola as Director of the Research Laboratory of this oil company. The lab included 22 people (micropaleontology, sedimentology, petrophysics). My main activity was to interpret facies reservoirs from drillings in the Cretaceous, sometimes in the Tertiary. I carried out many studies for oil companies operating in this country. I returned to the ULB in 1988 as First Assistant and was appointed Professor in 1990. I carried out various missions for mining companies in Belgium and oil companies abroad and continued research, particularly through projects of the Scientific Research National Funds (FNRS). My research still concerns sedimentology, geochemistry and diagenesis of carbonate rocks which leads me to travel many countries in Europe or outside Europe, North Africa, Papua New Guinea and the USA, to conduct field missions. Since the late 90's, I expanded my field of research in addressing the problem of mass extinctions of organisms from the Upper Devonian series across Euramerica (from North America to Poland) and I also specialized in microbiological and geochemical analyses of ancient carbonate series developing a sustained collaboration with biologists of my university. We are at the origin of a paleoecological model based on the presence of iron-bacterial microfossils, which led me to travel many countries in Europe and North Africa. This model accounts for the red pigmentation of many marble and ornamental stones used in the world. This research also has implications on the emergence of Life from the earliest stages of formation of Earth, as well as in the field of exobiology or extraterrestrial life ... More recently I invested in the study from the Precambrian series of Gabon and Congo. These works with colleagues from BRGM (Orléans) are as much about the academic side (consequences of the appearance of oxygen in the Paleoproterozoic and study of Neoproterozoic glaciations) that the potential applications in reservoir rocks and source rocks of oil (in collaboration with oil companies). Finally I recently established a close collaboration with the Royal Institute of Natural Sciences of Belgium to study the susceptibility magnetic signal from various European Paleozoic series. All these works allowed me to gain a thorough understanding of carbonate rocks (petrology, micropaleontology, geobiology, geochemistry, sequence stratigraphy, diagenesis) as well in Precambrian (2.2 Ga and 0.6 Ga), Paleozoic (from Silurian to Carboniferous) and Mesozoic (Jurassic and Cretaceous) rocks. Recently (2010) I have established a collaboration with Iraqi Kurdistan as part of a government program to boost scientific research in this country. My research led me to publish about 180 papers in international and national journals and presented more than 170 conference papers. I am a holder of eight courses at the ULB (5 mandatory and 3 optional), excursions and field stages, I taught at the third cycle in several French universities and led or co-managed a score of 20 Doctoral (PhD) and Post-doctoral theses and has been the promotor of more than 50 Masters theses.

UK Climate Trends – 2018

by P. Homewood, January 4, 2019 in NotaLotofPeopleKnowThat


The Met Office has now published its data for 2018. We can expect plenty of claims about last year being the 7th warmest in the UK since records began (in 1910). Or that all of the ten warmest years have occurred this century.

The real significance of these latest numbers, however, is that they continue to confirm that UK temperatures stopped rising more than a decade ago, after a step up during the 1990s.


https://www.metoffice.gov.uk/climate/uk/summaries/actualmonthly…


Sea level oscillations in Japan and China since the start of the 20th century and consequences for coastal management – Part 1: Japan Author links open overlay panel

by Albert Parker, March 1, 2019 in Ocean&CoastalManagement


Highlights
• Japan has strong quasi-20 and quasi-60 years low frequencies sea level fluctuations.
• These periodicities translate in specific length requirements of tide gauge records.
• 1894/1906 to present, there is no sea level acceleration in the 5 long-term stations.
• Those not affected by crustal movement (4 of 5) do not even show a rising trend.
Proper consideration of the natural oscillations should inform coastal planning.

See also here

Global-scale evaluation of role of soil minerals in carbon storage

by U. of California – Santa Barbara, January 2, 2019 in ScienceDaily


“We’ve known for quite a long time that the carbon stored on minerals is the carbon that sticks around for a long time,” said Chadwick, co-author of the paper, “Climate-driven thresholds in reactive mineral retention of soil carbon at the global scale,” published in the journal Nature Climate Change. How much carbon the soil can take and how much it can keep, he said, are dependent on factors including temperature and moisture.

“When plants photosynthesize, they draw carbon out of the atmosphere, then they die and their organic matter is incorporated in the soil,” Chadwick explained. “Bacteria decompose that organic matter, releasing carbon that can either go right back into the atmosphere as carbon dioxide or it can get held on the surface of soil minerals.”

..

Heads up Newfoundland & Labrador: polar bear season has begun

by Susan Crockford, January 2, 2019 in PolarBearScience


There is now enough sea ice off southern Labrador and the northern tip of Newfoundland for Davis Strait polar bears to come ashore looking for food. Baby seals won’t be available for months yet. And since winter is the lean season for these bears, some may seek food sources onshore. The bears come down from the area of Hudson Strait and southern Baffin Island: as the sea ice expands south, so do the bears.


Can wind and solar replace fossil fuels?

by Richard Patton, January 1, 2019 in WUWT


Statements implying that wind and solar can provide 50% of the power to the grid are not difficult to find on the internet. For example, Andrew Cuomo announced that

“The Clean Energy Standard will require 50 percent of New York’s electricity to come from renewable energy sources like wind and solar by 2030…”

Considering that the wind is erratic, and the solar cells only put out full power 6 hours per day, it seems a remarkable statement. Can intermittent energy actually supply that much power?

For some answers, we turn to Germany, which has some of the highest electric bills in the world as well as a high proportion of its electric power produced by wind and solar (19%). Let’s take a look at German consumption and generation.


Global Warming Win: Venezuelan Socialists On Track to Eliminate Their Nation’s Oil Industry

by Eric Worrall, December 31, 2018 in WUWT


Despite oil accounting for a whopping 90% of Venezuela’s export earnings, President Maduro, a fervent supporter of the Paris Agreement, has courageously put principle before profits by implementing his version of a new green deal. Maduro has eliminated the capitalist exploiters from his nation’s oil industry, and replaced them with loyal army officers who are rapidly dismantling the infrastructure left behind by the capitalists.

Read more: https://www.businessinsider.com/r-special-report-oil-output-goes-awol-in-venezuela-as-soldiers-run-pdvsa-2018-12/

TOP 12 DEBUNKED CLIMATE SCARES OF 2018

by GWPF, December 31, 2018


January 2018:  Worst-case global warming scenarios not credible: Study

PARIS (AFP) – Earth’s surface will almost certainly not warm up four or five degrees Celsius by 2100, according to a study released Wednesday (Jan 17) which, if correct, voids worst-case UN climate change predictions.

A revised calculation of how greenhouse gases drive up the planet’s temperature reduces the range of possible end-of-century outcomes by more than half, researchers said in the report, published in the journal Nature.

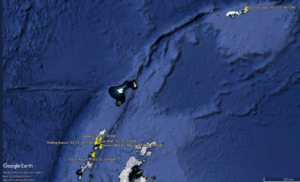
February:  ‘Sinking’ Pacific nation Tuvalu is actually getting bigger, new research reveals

The Pacific nation of Tuvalu — long seen as a prime candidate to disappear as climate change forces up sea levels — is actually growing in size, new research shows.

A University of Auckland study examined changes in the geography of Tuvalu’s nine atolls and 101 reef islands between 1971 and 2014, using aerial photographs and satellite imagery.

It found eight of the atolls and almost three-quarters of the islands grew during the study period, lifting Tuvalu’s total land area by 2.9 percent, even though sea levels in the country rose at twice the global average.

 March …. April… etc.

China Ignores Paris Climate Accord As CO2 Emissions Rapidly Rise

by Chriss Street, December 31, 2018 in ClimateChange Dispatch


Despite being lauded by President Obama for signing the Paris UN Climate Change Accords, China is still rapidly expanding greenhouse gas emissions.

President Obama and China’s President Xi Jinping issued a ‘U.S.-China Joint Presidential Statement on Climate Change’on March 31, 2016 stating that both nations were signing the Paris Accords and would take further “concrete steps” to “use public resources to finance and encourage the transition toward low carbon technologies as a priority.”

Arctic Ice Volume Shames Climate Experts …Antarctic Stations Show Cooling, Not Warming

by P. Gosselin, December 28, 2018 in NoTricksZone


By Kirye in Tokyo

We constantly hear from the untrustworthy media how polar ice is melting rapidly – due to human-induced global warming.

But when we look at the real data, we understand why audiences worldwide increasing distrust the mainstream media and their constant stream of doomsday reports, which they uncritically produce.

Recently I looked at some island stations near Antarctic, a continent where we are told melting ice will lead to many meters of sea level rise if we continue emitting CO2 into the atmosphere business as usual. These stations I examined are:

Base Arturo P
Bellingshause
Centro Met.An, Marsh
Base Orcadas
Great Wall
Jubany

hese six stations in the South Shetland Islands or the South Orkney Islands (located in the Antarctic Ocean) have even seen a slight cooling trend for decades.

Why all you’ve been told about these polar bears could be WRONG

by David Rose, December 30, 2018 in DailyMail


Animals driven to the edge of their natural habitat by shrinking ice have become one of the defining images of climate change, but Inuits who know the predators have a very different story
  • Aaron Gibbons, 31, was mauled to death by a polar bear earlier this year 
  • Inuit leaders want to be allowed to increase the amount of bears they kill
  • Climate change activists say bears are in decline, due to global warming
  • But locals say polar bears are adapting and are perfectly able to breed

Going Nowhere Fast on Climate, Year After Year

by Paul Bledsoe, December 2018 in TheNewYorkTimes


Three decades after a top climate scientist warned Congress of the dangers of global warming, greenhouse gas emissions keep rising and so do global temperatures.

Thirty years ago, a NASA scientist, James Hansen, told lawmakers at a Senate hearing that “global warming is now large enough that we can ascribe with a high degree of confidence a cause-and-effect relationship with the greenhouse effect.” He added that there “is only 1 percent chance of accidental warming of this magnitude.”

By that, he meant that humans were responsible.

His testimony made headlines around the United States and the world. But in the time since, greenhouse gas emissions, the global temperature average and cost of climate-related heat, wildfires, droughts, flooding and hurricanes have continued to rise.

Recently Dropping Global Temperatures Demonstrate IPCC Claims are Impossible

by Tim Ball, December 29, 2018 in WUWT


When you put the claims of the Intergovernmental Panel on Climate Change (IPCC) in perspective, you get a very different picture that defies logic. I decided to do this because of their recent hysterical claims in Special Report 15 (SR-15) designed to frighten and bully the world into completely unnecessary and enormously expensive environmental and energy policies. Charles Steele summarized their claims and proposed policies in his article, “Climate Doom Ahead? Think Twice,”

Current Solar Cycle The Third Quietest In More Than 250 Years Of Observation

by F. Bosse & Prof. F. Vahrenholt, December 27, 2018 in ClimateChangeDispatch


The sun was much less active in November than normal, comparing all solar cycles 1-23 up to month no. 120 since the beginning of the systematic survey in 1755, the first year of solar cycle 1.

The latest observed SSN (sunspot number) was a meager 5.9 for the monthly average.

On 16 days the sun was completely “spotless.” The maximum number over the days of November was 15, which does not mean that there were 15 spots – no, the number indicates that 5 spots were observed in a maximum of 1 spot group.

So there was very low spot activity, only 20% of the average value.

92 New Papers (2018) Link Solar Forcing To Climate . . . Some Predict Solar-Induced Global Cooling By 2030!

by K. Richard, December 27, 2018 in NoTricksZone


When it comes to the Sun’s influence on climate, one conclusion is certain: there is no widespread scientific agreement as to how and to what extent solar activity and its related parameters (i.e., galactic cosmic rays, geomagnetic activity, solar wind flux) impact changes in the Earth’s temperature and precipitation.

The disagreement is so chasmic and the mechanisms are so poorly understood that scientists’ estimates of the influence of direct solar irradiance forcing between the 17th century and today can range between a negligible +0.1 W m-2 to a very robust +6 W m-2 (Egorova et al., 2018Mazzarella and Scafetta, 2018).

There is no consensus on the amplitude of the historical solar forcing. The estimated magnitude of the total solar irradiance difference between Maunder minimum and present time ranges from 0.1 to 6 W/m2 making uncertain the simulation of the past and future climate.”  (Egorova et al., 2018)


2018 will be the first year with no violent tornadoes in the United States

by Charles the moderator, December 27 2018 in WUWT


From LMT Online

In the whirlwind that is 2018, there has been a notable lack of high-end twisters.

We’re now days away from this becoming the first year in the modern record with no violent tornadoes touching down in the United States. Violent tornadoes are the strongest on a 0 to 5 scale, or those ranked EF4 or EF5.

It was a quiet year for tornadoes overall, with below normal numbers most months. Unless you’re a storm chaser, this is not bad news. The low tornado count is undoubtedly a big part of the reason the 10 tornado deaths in 2018 is also vying to be a record low.

While we still have several days to go in 2018, and some severe weather is likely across the South to close it out, odds favor the country making it the rest of the way without a violent tornado.

If and when that happens, it will be the first time since the modern record began in 1950.

Land motion drives varying rates of sea level along the US East Coast

by Charles the moderator, December 26, 2018 in WUWT


From Science Magazine

Dec 20, 2018

Along the US East Coast, the Earth’s continued response to the end of the last ice age explains variances in relative sea level rates

Chestnut Hill, Mass. (12/20/2018) – Along the East Coast of the United States, relative sea level change does not happen uniformly between Maine and Florida.

Data have shown that sea level rise in the Mid-Atlantic region surpassed changes in relative sea level along the coastlines of the South Atlantic and the Gulf of Maine. A team of researchers took a look back at historical data through new analytical methods to pinpoint the reason behind the different rates of sea level change.

Assessing data from a range of sources and previous studies, the team concluded that the movement of the earth – referred to as vertical land motion – is the dominant force behind variations in rates of sea level rise up and down the East Coast, the team reports today in the journal Nature.

Une autre hypothèse pour expliquer la hausse des températures

by Prof. dr. P. Berth, 26 décembre 2018 in ScienceClimatEnergie


Comme tout le monde le sait, pour expliquer la légère hausse des températures de l’atmosphère observée au 20e siècle, le GIEC invoque un seul responsable : le taux de CO2 atmosphérique, et donc l’activité humaine. Les médias, bien entendu, suivent le GIEC et le monde entier diabolise le CO2. Cependant, n’existe-t-il pas d’autres hypothèses? Les lecteurs attentifs de ce site (SCE) savent que l’hypothèse du GIEC est mise à mal par toute une série d’observations (voir par exemple ici, ici et ici) et que certains problèmes théoriques existent dans la théorie même de l’effet de serre (voir ici et ici). Quelle est donc l’explication pour le réchauffement si ce n’est pas le taux de CO2? Bien qu’il y ait probablement des causes multiples, nous allons voir qu’une équipe de chercheurs du CERN propose une hypothèse alternative en se basant sur les résultats du projet CLOUD. Une vidéo récente (octobre 2018) présentant les résultats de cette expérience sera d’ailleurs présentée en fin d’article. Avant de regarder cette vidéo, faisons d’abord le point.


Figure 1. Formation de nuages en présence de noyaux de condensation (CCN : Cloud Condensation Nuclei).


CORAL REEFS CAN TAKE THE HEAT, UNLIKE EXPERTS CRYING WOLF

by Peter Ridd, December 26, 2018 in GWPF


Scientists from James Cook University have just published a paper on the bleaching and death of corals on the Great Barrier Reef and were surprised that the death rate was less than they expected, because of the adaptability of corals to changing temperatures.

It appears as though they exaggerated their original claims and are quietly backtracking.

To misquote Oscar Wilde, to exaggerate once is a misfortune, to do it twice looks careless, but to do it repeatedly looks like unforgivable systemic unreliability by some of our major science organisations.

The very rapid adaptation of corals to high temperatures is a well-known phenomenon; besides, if you heat corals in a given year, they tend to be less susceptible in the future to overheating. This is why corals are one of the least likely species to be affected by climate change, irrespective of whether you believe the climate is changing by natural fluctuations or because of human influence.

Corals have a unique way of dealing with changing temperature, by changing the microscopic plants that live inside them. These microscopic plants, called zooxanthellae, give the coral energy from the sun through photosynthesis in exchange for a comfortable home inside the coral. When the water gets hot, these little plants effectively become poisonous to the coral and the coral throws them out, which turns the coral white — that is, it bleaches.


“…it is the change in temperature compared to what we’ve been used to that matters.” – Part 3

by Bob Tisdale, December 24, 2018 in WUWT


In this post, we’re going to present monthly mean TMIN and TMAX Near-Land Surface Air Temperatures (not in anomaly form) for a group of ten (10) Countries in an effort to add a little perspective to global warming. The list of countries, which follows, will, hopefully, reflect the home countries of recent visitors to WattsUpWithThat. The list is based on the number of visitors per country to my blog ClimateObservations during my peak year of 2014.

And, as always with my posts, as part of the text, there are hyperlinks to the data that were used to prepare the graphs. Just click on the links if you’re looking for the data.

This series of posts are logged under the Category of “Global Warming in Perspective” at WattsUpWithThat, with the link to that category here. The category link at my blog ClimateObservations is here.

The Discovery Of Tree Trunks Under Glaciers 600 Meters Atop Today’s Treeline Date To The Last ICE AGE

by K. Richard, December 24, 2018 in NoTricksZone


Between 60 and 40 thousand years ago, during the middle of the last glacial, atmospheric CO2 levels hovered around 200 ppm – half of today’s concentration.

Tree remains dated to this period have been discovered 600-700 meters atop the modern treeline in the Russian Altai mountains.  This suggests surface air temperatures were between 2°C and 3°C warmer than today during this glacial period.

Tree trunks dating to the Early Holocene (between 10.6 and 6.2 thousand years ago) have been found about 350 meters higher than the modern treeline edge.  This suggests summer temperatures were between 2°C and 2.5°C warmer than today during the Early Holocene, when CO2 concentrations ranged between about 250 and 270 ppm.

None of this paleoclimate treeline or temperature evidence correlates with a CO2-driven climate.


HOW CAN SO MANY SCIENTISTS BE SO WRONG ABOUT THE PAUSE?

by David Whitehouse, December 20, 2018 in GWPF


Using simple statistics it looked at and dismissed over 200 peer-reviewed papers that analysed the pause and concluded it was a real phenomenon. How did they, and the IPCC, get it all so wrong?

Source: Clive Best

Nobody who keeps an eye on climate research will be at all surprised by this “new” paper. Its conclusions were well aired in April 2018 at a meeting of the European Geophysical Union.

The authors must have been rather frustrated at the time as the paper describing their work had been submitted to the journal Environmental Research Letters over a year earlier, in February 2017 in fact, still had not been published. This was remedied a few days ago when it was finally published — one year and nine months after its submission!