by Mark P. Mills, March 26, 2019 in ManhattanInstitute
EXECUTIVE SUMMARY
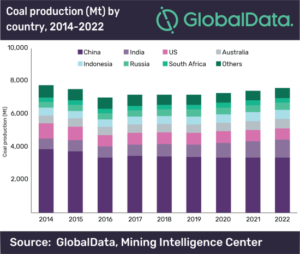
A movement has been growing for decades to replace hydrocarbons, which collectively supply 84% of the world’s energy. It began with the fear that we were running out of oil. That fear has since migrated to the belief that, because of climate change and other environmental concerns, society can no longer tolerate burning oil, natural gas, and coal—all of which have turned out to be abundant.
So far, wind, solar, and batteries—the favored alternatives to hydrocarbons—provide about 2% of the world’s energy and 3% of America’s. Nonetheless, a bold new claim has gained popularity: that we’re on the cusp of a tech-driven energy revolution that not only can, but inevitably will, rapidly replace all hydrocarbons.
This “new energy economy” rests on the belief—a centerpiece of the Green New Deal and other similar proposals both here and in Europe—that the technologies of wind and solar power and battery storage are undergoing the kind of disruption experienced in computing and communications, dramatically lowering costs and increasing efficiency. But this core analogy glosses over profound differences, grounded in physics, between systems that produce energy and those that produce information.
In the world of people, cars, planes, and factories, increases in consumption, speed, or carrying capacity cause hardware to expand, not shrink. The energy needed to move a ton of people, heat a ton of steel or silicon, or grow a ton of food is determined by properties of nature whose boundaries are set by laws of gravity, inertia, friction, mass, and thermodynamics—not clever software.
This paper highlights the physics of energy to illustrate why there is no possibility that the world is undergoing—or can undergo—a near-term transition to a “new energy economy.”
Among the reasons:
…