Archives de catégorie : climate-debate

La croissance du CO2 dans l’atmosphère est-elle exclusivement anthropique? (1/2) et Effet Suess

by J.C. Maurin, 13 juin 2019 in ScienceClimatEnergie


Une croissance du COatmosphérique qui serait exclusivement anthropique est contradictoire avec les observations du carbone 13 dans l’atmosphère (ici). Cet article en 2 parties va montrer qu’il existe également des contradictions avec les observations du carbone 14. Celui-ci  est utilisé à des fins de datation jusqu’à 50 000 ans BP  (Before Present)et on dispose de nombreuses études (pour calibration) sur son évolution dans l’atmosphère.  


La première partie s’intéresse, non pas aux datations, mais à la dilution du carbone 14 que provoque l’ajout de COanthropique (effet SUESS)  avant les essais thermonucléaires de 1952-1963.
Dans la seconde partie nous verrons que l’évolution du carbone 14 après 1963 est aussi en contradiction avec une croissance du COexclusivement anthropique.

1. Le carbone dans l’atmosphère [1] [5]

Le carbone existe habituellement sous 3 formes isotopiques : 12C pour ≈ 98.9% , 13C pour ≈ 1.1 % et 14C à l’état de traces (Fig. 1a).
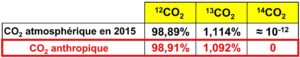
Figure 1a.  La seule différence entre COanthropique et COatmosphérique réside dans les proportions du mélange des isotopes: le COanthropique est appauvri en 13C et 14C.  L’ajout de COanthropique va modifier, au fil des années, les proportions du mélange isotopique dans l’atmosphère.

Study: Cattle Methane is a moooot point in global climate

by Anthony Watts, June 12, 2019 in WUWT


Via No Tricks Zone: Agrobiologist and scientific researcher Dr. Albrecht Glatzle, author of over 100 scientific papers and two textbooks, has published research that shows:

“…there is no scientific evidence, whatsoever, that domestic livestock could represent a risk for the Earth’s climate” and the “warming potential of anthropogenic GHG [greenhouse gas] emissions has been exaggerated.”

Glatzle, 2018

Domestic Livestock and ItsAlleged Role in Climate Change

Abstract:

“Our key conclusion is there is no need for anthropogenic emissions of greenhouse gases (GHGs), and even less so for livestock-born emissions, to explain climate change. Climate has always been changing, and even the present warming is most likely driven by natural factors.

The warming potential of anthropogenic GHG emissions has been exaggerated, and the beneficial impacts of manmade CO2 emissions for nature, agriculture, and global food security have been systematically suppressed, ignored, or at least downplayed by the IPCC (Intergovernmental Panel on Climate Change) and other UN (United Nations) agencies.

Furthermore, we expose important methodological deficiencies in IPCC and FAO (Food Agriculture Organization) instructions and applications for the quantification of the manmade part of non-CO2-GHG emissions from agro-ecosystems.

However, so far, these fatal errors inexorably propagated through the scientific literature.

Finally, we could not find a clear domestic livestock fingerprint, neither in the geographical methane distribution nor in the historical evolution of mean atmospheric methane concentration.”

Ouragans en Atlantique : prévisions pour la saison 2019

by Regis Crepet, 2 juin 2019 in LaChaîneMétéo


Ces deux dernières années ont été marquées par une activité cyclonique supérieure aux moyennes statistiques en Atlantique Nord, notamment en 2017 avec des phénomènes puissants tels Irma et Maria dans les Caraïbes. Cette année, alors que la saison démarre officiellement le 1er juin, nos prévisions sont plus rassurantes avec la perspective d’une activité cyclonique légèrement plus faible que la moyenne.


En ce début d’été météorologique, la saison cyclonique débute dans l’Atlantique nord (les ouragans). Cette saison s’étend officiellement du 1er juin au 30 novembre, avec un pic d’activité d’août à octobre. Il est donc l’heure pour les différents organismes météo de la planète et les météorologues et climatologues de La Chaîne Météo de se pencher sur les prévisions de cette saison à venir.

En 2017, la saison dans l’océan Atlantique nord a figuré parmi les plus actives depuis le début des relevés, avec des phénomènes dévastateurs (Harvey, Irma ou encore Maria dans les Caraïbes). Comme 2017, la saison 2018 s’est située au-dessus des moyennes (calculées par la NOAA d’après la période 1981/2010). Cette dernière saison a présenté, pour l’Atlantique nord, 15 phénomènes cycloniques, avec 8 ouragans dont 2 qui ont atteint la catégorie 3 sur 5, qualifiés alors de “majeurs”.

Ending Fossil Fuels Would Bring The World Back To The Dark Ages

by Washington Times, June11, 2019 in ClimateChange Dispatch


German engineering, as good as it is, has not been able to eliminate the effect of “green” politics, which would replace fossil and nuclear power with renewables. The result is 172,000 localized blackouts in Germany in 2017.

Poverty was a constant companion of humanity until modern times. The proportion of people worldwide living in poverty was cut in half between 1990 and 2010, according to the World Bank, an achievement unprecedented in human history.

It was the result of a rapid boost in global energy production — up 43 percent during that period, according to the U.S. Energy Information Administration. Nearly 81 percent of that power was generated by fossil fuels, such as oil and gas.

A billion people around the globe still suffer extreme energy poverty, with no access to electricity. Everyone gets a hint of what that means when storms knock out the power, and everything in the house stops.

Fumbling occasionally for candles is a mere inconvenience, but life beyond carbon — entirely dependent on sunshine and a breeze — would be insanity.

Why Climate Models Can’t Predict The Future (And Never Have)

by Jay Lehr, June 11, 2019 in Climate ChangeDispatch


SEE ALSO: Climate Models Of Incompetence

Consider the following: we do not know all the variables that control our climate, but we are quite sure they are likely in the hundreds.

Just take a quick look at ten obviously important factors for which we have limited understanding:

1- Changes in seasonal solar irradiation;

2- Energy flows between ocean and atmosphere;

3- Energy flow between air and land;

4- The balance between Earth’s water, water vapor, and ice;

5- The impacts of clouds;

6- Understanding the planet’s ice;

7- Mass changes between ice sheets, sea level and glaciers;

8- The ability to factor in hurricanes and tornadoes;

9- The impact of vegetation on temperature;

10- Tectonic movement on ocean bottoms.

Yet, today’s modelers believe they can tell you the planet’s climate decades or even a century in the future and want you to manage your economy accordingly.

Dr. Willie Soon of the Harvard-Smithsonian astrophysics laboratory once calculated that if we could know all the variables affecting climate and plugged them into the world’s largest computer, it would take 40 years for the computer to reach an answer.

In Coal We Trust: The Need For Coal Power In Asia

by Tilak Doshi, June 7, 2019 in Forbes


The reigning narrative of impending global environmental catastrophe dominates the airwaves and print media. Short of a drastic reduction in the use of fossil fuels, it is asserted, we are fast approaching the “end of days”. The demonization of fossils fuels in general, and coal in particular, has been wrought under pressure from special interests groups and organized lobbies of the climate-industrial complex where aspects of economic reality are caricatured or presented out of context. Complex trade-offs in energy policy are spun into tales of spurious simplicity, leading to misleading conclusions. Nowhere is this more apparent than in the debate over the role of coal-fueled power generation in Asia.

Opposition to the building of coal power plants in the poorer countries has been justified by environmental activists, banks and multilateral development agencies such as the World Bank in two key ways. The first revolves around the claim that climate change mitigation programs carry “co-benefits” for public health in developing countries. The second utilizes the assertion that renewable energy such as solar and wind power are effective substitutes for centralized grid electricity generated by fossil fuels.

Climate change policy does not help the poor

Central Europe temperature constrained by speleothem fluid inclusion water isotopes over the past 14,000 years

by Affolter et al., June 5, 2019 in ScienceAdvance


Abstract

The reasons for the early Holocene temperature discrepancy between northern hemispheric model simulations and paleoclimate reconstructions—known as the Holocene temperature conundrum—remain unclear. Using hydrogen isotopes of fluid inclusion water extracted from stalagmites from the Milandre Cave in Switzerland, we established a mid-latitude European mean annual temperature reconstruction for the past 14,000 years. Our Milandre Cave fluid inclusion temperature record (MC-FIT) resembles Greenland and Mediterranean sea surface temperature trends but differs from recent reconstructions obtained from biogenic proxies and climate models. The water isotopes are further synchronized with tropical precipitation records, stressing the Northern Hemisphere signature. Our results support the existence of a European Holocene Thermal Maximum and data-model temperature discrepancies. Moreover, data-data comparison reveals a significant latitudinal temperature gradient within Europe. Last, the MC-FIT record suggests that seasonal biases in the proxies are not the primary cause of the Holocene temperature conundrum.

Radiation versus Temperature

by Willis Eschenbach, June 8, 2019 in WUWT


Due to the recent posts by Lord Monkton and Nick Stokes, I’ve been thinking about the relationship between radiation and temperature. So I turned to the CERES dataset. Here is a scatterplot of the monthly global average surface temperature versus the monthly global average downwelling total radiation absorbed by the surface. The total radiation is the sum of the net solar radiation at the surface and the downwelling longwave radiation at the surface. I’ve removed the seasonal variations from the data.

Note that 3.7 W/m2 is the increase in downwelling longwave radiation expected from a doubling of CO2 …

When I saw that, I thought well, maybe the increase is small because there’s a lag between the absorption of the radiation and the warming. To see if that was the case, I did a cross-correlation analysis of the relationship.

‘Skeptical Environmentalist’ Bjorn Lomborg sets fire to the scourge of ‘unbridled climate alarmism’

by Charles the moderator , June 7, 2019 in WUWT


Fear’s a great motivator, right? So what better way to motivate people to care about climate change than to scare the crap out of them? Even if you have to leave out some details to do it?

New York Magazine climate columnist David Wallace-Wells seems to be a student at the School of We’re Hurtling Toward Global Environmental Catastrophe and We’re All Gonna Die. Last night, he shared a short piece by James Dyke, a senior lecturer in global systems at the University of Exeter, explaining some of the horrible things humanity is in for:

Latest Global Temp. Anomaly (May ’19: +0.32°C) A Simple “No Greenhouse Effect” Model of Day/Night Temperatures at Different Latitudes

by Dr. Roy Spencer, June 7, 2019 in WUWT


Abstract: A simple time-dependent model of Earth surface temperatures over the 24 hr day/night cycle at different latitudes is presented. The model reaches energy equilibrium after 1.5 months no matter what temperature it is initialized at. It is shown that even with 1,370 W/m2 of solar flux (reduced by an assumed albedo of 0.3), temperatures at all latitudes remain very cold, even in the afternoon and in the deep tropics. Variation of the model input parameters over reasonable ranges do not change this fact. This demonstrates the importance of the atmospheric “greenhouse” effect, which increases surface temperatures well above what can be achieved with only solar heating and surface infrared loss to outer space.

PATAGONIA ICE SHEETS THICKER THAN PREVIOUSLY THOUGHT

by GWPF, June 05, 2019


After conducting a comprehensive, seven-year survey of Patagonia, glaciologists from the University of California, Irvine and partner institutions in Argentina and Chile have concluded that the ice sheets in this vast region of South America are considerably more massive than expected.

hrough a combination of ground observations and airborne gravity and radar sounding methods, the scientists created the most complete ice density map of the area to date and found that some glaciers are as much as a mile (1,600 meters) thick. Their findings were published today in the American Geophysical Union journal Geophysical Research Letters.

Glacier National Park Quietly Removes Its ‘Gone by 2020’ Signs

by Roger I. Roots, May 30, 2019 in WUWT


Founder, Lysander Spooner University

May 30, 2019. St. Mary, Montana. Officials at Glacier National Park (GNP) have begun quietly removing and altering signs and government literature which told visitors that the Park’s glaciers were all expected to disappear by either 2020 or 2030.
In recent years the National Park Service prominently featured brochures, signs and films which boldly proclaimed that all glaciers at GNP were melting away rapidly. But now officials at GNP seem to be scrambling to hide or replace their previous hysterical claims while avoiding any notice to the public that the claims were inaccurate. Teams from Lysander Spooner University visiting the Park each September have noted that GNP’s most famous glaciers such as the Grinnell Glacier and the Jackson Glacier appear to have been growing—not shrinking—since about 2010. (The Jackson Glacier—easily seen from the Going-To-The-Sun Highway—may have grown as much as 25% or more over the past decade.)

Montana Glacier National Park Mountains Cracker Lake

How deep-ocean vents fuel massive phytoplankton blooms

by Stanford’s School of Earth, Energy & Environmental Sciences, June 5, 2019 in WUWT


More “settled science” of the carbon cycle~ctm

Stanford study shows how hydrothermal vents fuel massive phytoplankton blooms — and possible hotspots for carbon storage

Researchers at Stanford University say they have found an aquatic highway that lets nutrients from Earth’s belly sweep up to surface waters off the coast of Antarctica and stimulate explosive growth of microscopic ocean algae.

Their study, published June 5 in the journal Nature Communications, suggests that hydrothermal vents – openings in the seafloor that gush scorching hot streams of mineral-rich fluid – may affect life near the ocean’s surface and the global carbon cycle more than previously thought.

Mathieu Ardyna, a postdoctoral scholar and the study’s lead author, said the research provides the first observed evidence of iron from the Southern Ocean’s depths turning normally anemic surface waters into hotspots for phytoplankton – the tiny algae that sustain the marine food web, pull heat-trapping carbon dioxide out of the air and produce a huge amount of the oxygen we breathe. “Our study shows that iron from hydrothermal vents can well up, travel across hundreds of miles of open ocean and allow phytoplankton to thrive in some very unexpected places,” he said.

Kevin Arrigo, a professor of Earth system science and senior author of the paper, called the findings “important because they show how intimately linked the deep ocean and surface ocean can be.”

2019 Atlantic hurricane forecast

by J. Curry and J. Johnstone, June4, 2019 in ClimateEtc.


CFAN predicts an active North Atlantic hurricane season season.

The Atlantic hurricane has begun.  We are off to an early start with one wimpy subtropical storm that lasted less than a day, and a small system that is trying to spin up in the Bay of Campeche.

Other forecast providers have begun issuing forecasts:

  • NOAA predicts a near normal season with 4-8 hurricanes.
  • Tropical Storm Risk predicts slightly below normal activity, with 6 hurricanes and ACE of 88.
  • Colorado State University predicts near normal season:  6 hurricanes and ACE of 100

Climate Forecast Applications Network (CFAN) is going bold, see below. [link] to forecast report.

CFAN’s seasonal forecast

Table 1. Current (May) 2019 hurricane forecasts of North Atlantic ACE, North Atlantic total hurricanes, U.S. landfalling hurricanes. 

….

The major emitters that are meeting their Paris Agreement pledges

by Axios, June 1, 2019


Of top 10 global carbon emitters, not a single one is hitting its climate goals as outlined under the Paris Agreement, per data from the Climate Action Tracker.

Why it matters: Even if every country that’s adopted the Paris Agreement were to meet their pledges, it would not avert the worst effects of climate change.

Driving the news: June 1 marks the 2-year anniversary of President Trump’s announcement that the U.S. would withdraw from the deal. Per the Climate Action Tracker, the U.S., the second-largest world emitter of greenhouse gasses (but top historical emitter), falls under “critically insufficient,” the worst category, in meeting its Paris pledge.

The backdrop: The Paris Agreement’s main goal is to keep global temperature rise this century to “well below 2ºC,” above pre-industrial levels, and pursue efforts to limit the temperature increase to 1.5ºC.

  • Each country determined what it would be willing to do under the agreement. Such commitments are known as intended nationally determined contributions (INDCs).
  • After ratifying the agreement, the INDC would become the country’s first nationally determined contribution.

So far, 185 countries have ratified or adopted the Paris Agreement. All of the NDCs are available here.

New Proxy Data Show Northern Europe Weather Variability In Sync With Natural Factors: Solar Activity, Oceanic Cycles

by J. Goslin in P. Gosselin, June 1, 2019 in NoTricksZone


Another new paper, which of course will be ignored by the government-funded IPCC because it contradicts claims CO2 drives climate, shows that natural factors dominated the earth’s climate variability.

A team of scientists led by Jerome Goslin have published a paper titled Decadal variability of north-eastern Atlantic storminess at the mid-Holocene: New inferences from a record of wind-blown sand, western Denmark in the journal Global and Planetary Change, suggesting climate variability is driven naturally.

Image: NASA, public domain

Climate change driven by solar and oceanic cycles

Not surprisingly, as evidenced by hundreds of other publications (which are entirely ignored by the IPCC), climate variability is indeed tied to solar activity and “internal atmospheric and oceanic modes”.

Germany’s Zugspitze Sees Snow Depth Spiral Upward To Highest Level in 38 Years – In Late Spring!

by P. Gosselin, June 2, 2019 in NoTricksZone


May normally is a month that sees rapid snow melt in Alps. But this year May was an unusually cold month across Central Europe and parts of the Alps saw heavy snow accumulation.

A week ago, on May 25, BR public broadcasting reported here how May snow levels at Germany’s tallest peak, Zugspitze, reached a 20-year high at just over 6 meters of depth. The article wrote that experts thought the depth would not rise further.

But that turned out to be wrong.

Highest level since February, 1981

Four days later, on May 29, another 35 cm were added and pushed the depth to 6.40 meters, according to wetteronline.ch here. the website wrote: “Zugspitze: Never so much snow since 1981.” The website added that the snow depth there was “higher than it has been since February 1981.”

What follows is a webcam image of the Zugspitze peak from May 29th:


10 Of 10 Coastal Antarctic Stations Show Zero Warming Over Past Decades. Failed Scientists Need To Resign

by Kirye in P. Gosselin, May 31, 2019 in NoTricksZone


Over the past few years, climate alarmists have increasingly been resorting to weather-ambulance chasing, which has necessitated the trotting of the globe in the search of weather anomalies to behold as proof of man-made climate change.

But one place they have been avoiding like the plague is Antarctica as a number of studies have been showing the opposite of what what predicted earlier has been happening down at the South Pole, except for volcanic activity beneath parts of the Antarctic ice shelf.

Analysis of Antarctic stations show cooling

Small increase in EU’s total greenhouse gas emissions in 2017, with transport emissions up for the fourth consecutive year

by European Environment Agency, May 29, 2019


Total greenhouse gas emissions in the European Union (EU) increased by 0.7 % in 2017, according to latest official data published today by the European Environment Agency (EEA). Less coal was used to produce heat and electricity but this was offset by higher industrial and transport emissions, the latter increasing for the fourth consecutive year.

According to the EEA’s Annual European Union greenhouse gas inventory 1990-2017 and inventory report 2019, total greenhouse gas emissions (including international aviation) rose by 0.7 % in 2017 compared with 2016. These official data confirm the preliminary estimates published by the EEA in October 2018. From 1990 to 2017, the EU reduced its net greenhouse gas emissions by 21.7 %. The EU is therefore still exceeding its 20 % reduction target set for 2020.

Roy Spencer: Why so many tornadoes this year? It’s not what AOC, Bernie Sanders (or maybe even you) think

by Charles the moderator, May 29, 2019 in WUWT


By Roy Spencer | Fox News

Progressive politicians like Al Gore, Sen. Bernie Sanders, I-Vt., and Rep. Alexandria Ocasio-Cortez, D.N.Y., don’t hesitate to blame any kind of severe weather – even if it is decreasing over time – on global warming.

With the devastating Dayton, Ohio tornadoes fresh on our minds, it is useful to examine exactly why (modest) global warming has produced fewer – not more – of such events.

The simple answer is that tornado formation requires unusually cool air.

Very few thunderstorms produce tornadoes. In the hot and humid tropics, they are virtually unheard of. The reason why is that (unlike hurricanes) tornadoes require strong wind shear, which means wind speed increasing and changing direction with height in the lower atmosphere.

These conditions exist only when a cool air mass collides with a warm air mass. And the perfect conditions for this have existed this year as winter has refused to lose its grip on the western United States. So far for the month of May 2019, the average temperature across the U.S. is close to 2 degrees Fahrenheit below normal.

Climate science violates the basic precepts of science

by Sanjeev Sabhlok,  May 9, 2019 in TheTimesofIndia


There are two key pillars of science. First, it doesn’t matter how many “scientists” believe something. All of them could be proven wrong by a single new scientific theory or experiment. Science is always tentatively proven, and it is incumbent on everyone who calls himself a scientist to ask questions even about things that are “settled”. The great physicist Richard Feynman rightly said, “Science is the belief in the ignorance of experts”. Scientists must continually question everything and everybody.

Second, science must necessarily make accurate predictions. The global positioning system (GPS) in our mobile phones works only because Einstein’s theories of relativity are accurate to the last possible decimal. Science must not just predict the future: it must predict backwards. Our scientific understanding of cosmic microwave background radiation allows us to literally see the universe as it existed a few thousand years after the Big Bang.

With climate change, things are dramatically unclear and unsettled. Even converting the basic logic of the greenhouse effect into actual estimates for planet Earth is not settled. The IPCC’s Third Assessment Report notes that "If the amount of carbon dioxide were doubled instantaneously … the temperature of the surface-troposphere system would have to increase by 1.2 degrees, in the absence of other changes”. However, some scientists calculate that its impact would be much lower.

German Government Falsified Key IPCC Statement In The Translation Of “IPCC Summary Report To Policy Makers”!

by Prof. dr. H.J. Lüdecke, May 26 2019 in


(German text translated/edited by P Gosselin)
Was it sloppiness or intent? In the IPCC Summary Report for Policymakers published by the Federal Government in German, the most important statement of the original English report was falsified.

IPCC reports are available as comprehensive status reports and get strongly condensed as reports for policymakers. The latter are not to be taken as IPCC-authorized extracts as the governments concerned are allowed contribute in the writing. As a result, information or formulations from the English IPCC original which do not agree with German politics are often omitted in the German IPCC reports for policymakers. This is popularly called censorship. As a result of such falsifications, the status reports and the corresponding reports for policymakers are often contradiction.

Key finding deleted from Summary for Policymakers

One example in the past was the famous Chapter 2.6 of the AR5 Report, in which the IPCC explained in detail that no increase in extreme weather events could be found in climate periods (about 30 years) from 1950 onwards (beginning of more extensive measurements and statistics). EIKE reported on this. But in the accompanying German IPCC report for policymakers, this IPCC finding, which is hardly trivial, was nowhere to be seen.

NOAA predicts near-normal 2019 Atlantic hurricane season

by Anthony Watts, May 23, 2019 in WUWT


El Nino and warmer-than-average Atlantic help shape this season’s intensity

From NOAA press release:

NOAA’s Climate Prediction Center is predicting that a near-normal Atlantic hurricane season is most likely this year. This outlook forecasts a 40% chance of a near-normal season, a 30% chance of an above-normal season and a 30% chance of a below-normal season. The hurricane season officially extends from June 1 to November 30.

For 2019, NOAA predicts a likely range of 9 to 15 named storms (winds of 39 mph or higher), of which 4 to 8 could become hurricanes (winds of 74 mph or higher), including 2 to 4 major hurricanes (category 3, 4 or 5; with winds of 111 mph or higher). NOAA provides these ranges with a 70% confidence. An average hurricane season produces 12 named storms, of which 6 become hurricanes, including 3 major hurricanes.

New Paper: Arctic Sea Ice Was Far Less Extensive Than Today During The ‘Ice Free’ Early Holocene

by K. Richard, May 23, 2019 in NoTricksZone


Biomarker evidence for Arctic-region sea ice coverage in the northern Barents Sea indicates the most extensive sea ice conditions of the last 9,500 years occurred during the 20th century (0 cal yr BP). In contrast, this region was ice free with open water conditions during the Early Holocene (9,500-5,800 years ago).