Archives de catégorie : climate-debate

The major emitters that are meeting their Paris Agreement pledges

by Axios, June 1, 2019


Of top 10 global carbon emitters, not a single one is hitting its climate goals as outlined under the Paris Agreement, per data from the Climate Action Tracker.

Why it matters: Even if every country that’s adopted the Paris Agreement were to meet their pledges, it would not avert the worst effects of climate change.

Driving the news: June 1 marks the 2-year anniversary of President Trump’s announcement that the U.S. would withdraw from the deal. Per the Climate Action Tracker, the U.S., the second-largest world emitter of greenhouse gasses (but top historical emitter), falls under “critically insufficient,” the worst category, in meeting its Paris pledge.

The backdrop: The Paris Agreement’s main goal is to keep global temperature rise this century to “well below 2ºC,” above pre-industrial levels, and pursue efforts to limit the temperature increase to 1.5ºC.

  • Each country determined what it would be willing to do under the agreement. Such commitments are known as intended nationally determined contributions (INDCs).
  • After ratifying the agreement, the INDC would become the country’s first nationally determined contribution.

So far, 185 countries have ratified or adopted the Paris Agreement. All of the NDCs are available here.

New Proxy Data Show Northern Europe Weather Variability In Sync With Natural Factors: Solar Activity, Oceanic Cycles

by J. Goslin in P. Gosselin, June 1, 2019 in NoTricksZone


Another new paper, which of course will be ignored by the government-funded IPCC because it contradicts claims CO2 drives climate, shows that natural factors dominated the earth’s climate variability.

A team of scientists led by Jerome Goslin have published a paper titled Decadal variability of north-eastern Atlantic storminess at the mid-Holocene: New inferences from a record of wind-blown sand, western Denmark in the journal Global and Planetary Change, suggesting climate variability is driven naturally.

Image: NASA, public domain

Climate change driven by solar and oceanic cycles

Not surprisingly, as evidenced by hundreds of other publications (which are entirely ignored by the IPCC), climate variability is indeed tied to solar activity and “internal atmospheric and oceanic modes”.

Germany’s Zugspitze Sees Snow Depth Spiral Upward To Highest Level in 38 Years – In Late Spring!

by P. Gosselin, June 2, 2019 in NoTricksZone


May normally is a month that sees rapid snow melt in Alps. But this year May was an unusually cold month across Central Europe and parts of the Alps saw heavy snow accumulation.

A week ago, on May 25, BR public broadcasting reported here how May snow levels at Germany’s tallest peak, Zugspitze, reached a 20-year high at just over 6 meters of depth. The article wrote that experts thought the depth would not rise further.

But that turned out to be wrong.

Highest level since February, 1981

Four days later, on May 29, another 35 cm were added and pushed the depth to 6.40 meters, according to wetteronline.ch here. the website wrote: “Zugspitze: Never so much snow since 1981.” The website added that the snow depth there was “higher than it has been since February 1981.”

What follows is a webcam image of the Zugspitze peak from May 29th:


10 Of 10 Coastal Antarctic Stations Show Zero Warming Over Past Decades. Failed Scientists Need To Resign

by Kirye in P. Gosselin, May 31, 2019 in NoTricksZone


Over the past few years, climate alarmists have increasingly been resorting to weather-ambulance chasing, which has necessitated the trotting of the globe in the search of weather anomalies to behold as proof of man-made climate change.

But one place they have been avoiding like the plague is Antarctica as a number of studies have been showing the opposite of what what predicted earlier has been happening down at the South Pole, except for volcanic activity beneath parts of the Antarctic ice shelf.

Analysis of Antarctic stations show cooling

Small increase in EU’s total greenhouse gas emissions in 2017, with transport emissions up for the fourth consecutive year

by European Environment Agency, May 29, 2019


Total greenhouse gas emissions in the European Union (EU) increased by 0.7 % in 2017, according to latest official data published today by the European Environment Agency (EEA). Less coal was used to produce heat and electricity but this was offset by higher industrial and transport emissions, the latter increasing for the fourth consecutive year.

According to the EEA’s Annual European Union greenhouse gas inventory 1990-2017 and inventory report 2019, total greenhouse gas emissions (including international aviation) rose by 0.7 % in 2017 compared with 2016. These official data confirm the preliminary estimates published by the EEA in October 2018. From 1990 to 2017, the EU reduced its net greenhouse gas emissions by 21.7 %. The EU is therefore still exceeding its 20 % reduction target set for 2020.

Roy Spencer: Why so many tornadoes this year? It’s not what AOC, Bernie Sanders (or maybe even you) think

by Charles the moderator, May 29, 2019 in WUWT


By Roy Spencer | Fox News

Progressive politicians like Al Gore, Sen. Bernie Sanders, I-Vt., and Rep. Alexandria Ocasio-Cortez, D.N.Y., don’t hesitate to blame any kind of severe weather – even if it is decreasing over time – on global warming.

With the devastating Dayton, Ohio tornadoes fresh on our minds, it is useful to examine exactly why (modest) global warming has produced fewer – not more – of such events.

The simple answer is that tornado formation requires unusually cool air.

Very few thunderstorms produce tornadoes. In the hot and humid tropics, they are virtually unheard of. The reason why is that (unlike hurricanes) tornadoes require strong wind shear, which means wind speed increasing and changing direction with height in the lower atmosphere.

These conditions exist only when a cool air mass collides with a warm air mass. And the perfect conditions for this have existed this year as winter has refused to lose its grip on the western United States. So far for the month of May 2019, the average temperature across the U.S. is close to 2 degrees Fahrenheit below normal.

Climate science violates the basic precepts of science

by Sanjeev Sabhlok,  May 9, 2019 in TheTimesofIndia


There are two key pillars of science. First, it doesn’t matter how many “scientists” believe something. All of them could be proven wrong by a single new scientific theory or experiment. Science is always tentatively proven, and it is incumbent on everyone who calls himself a scientist to ask questions even about things that are “settled”. The great physicist Richard Feynman rightly said, “Science is the belief in the ignorance of experts”. Scientists must continually question everything and everybody.

Second, science must necessarily make accurate predictions. The global positioning system (GPS) in our mobile phones works only because Einstein’s theories of relativity are accurate to the last possible decimal. Science must not just predict the future: it must predict backwards. Our scientific understanding of cosmic microwave background radiation allows us to literally see the universe as it existed a few thousand years after the Big Bang.

With climate change, things are dramatically unclear and unsettled. Even converting the basic logic of the greenhouse effect into actual estimates for planet Earth is not settled. The IPCC’s Third Assessment Report notes that "If the amount of carbon dioxide were doubled instantaneously … the temperature of the surface-troposphere system would have to increase by 1.2 degrees, in the absence of other changes”. However, some scientists calculate that its impact would be much lower.

German Government Falsified Key IPCC Statement In The Translation Of “IPCC Summary Report To Policy Makers”!

by Prof. dr. H.J. Lüdecke, May 26 2019 in


(German text translated/edited by P Gosselin)
Was it sloppiness or intent? In the IPCC Summary Report for Policymakers published by the Federal Government in German, the most important statement of the original English report was falsified.

IPCC reports are available as comprehensive status reports and get strongly condensed as reports for policymakers. The latter are not to be taken as IPCC-authorized extracts as the governments concerned are allowed contribute in the writing. As a result, information or formulations from the English IPCC original which do not agree with German politics are often omitted in the German IPCC reports for policymakers. This is popularly called censorship. As a result of such falsifications, the status reports and the corresponding reports for policymakers are often contradiction.

Key finding deleted from Summary for Policymakers

One example in the past was the famous Chapter 2.6 of the AR5 Report, in which the IPCC explained in detail that no increase in extreme weather events could be found in climate periods (about 30 years) from 1950 onwards (beginning of more extensive measurements and statistics). EIKE reported on this. But in the accompanying German IPCC report for policymakers, this IPCC finding, which is hardly trivial, was nowhere to be seen.

NOAA predicts near-normal 2019 Atlantic hurricane season

by Anthony Watts, May 23, 2019 in WUWT


El Nino and warmer-than-average Atlantic help shape this season’s intensity

From NOAA press release:

NOAA’s Climate Prediction Center is predicting that a near-normal Atlantic hurricane season is most likely this year. This outlook forecasts a 40% chance of a near-normal season, a 30% chance of an above-normal season and a 30% chance of a below-normal season. The hurricane season officially extends from June 1 to November 30.

For 2019, NOAA predicts a likely range of 9 to 15 named storms (winds of 39 mph or higher), of which 4 to 8 could become hurricanes (winds of 74 mph or higher), including 2 to 4 major hurricanes (category 3, 4 or 5; with winds of 111 mph or higher). NOAA provides these ranges with a 70% confidence. An average hurricane season produces 12 named storms, of which 6 become hurricanes, including 3 major hurricanes.

New Paper: Arctic Sea Ice Was Far Less Extensive Than Today During The ‘Ice Free’ Early Holocene

by K. Richard, May 23, 2019 in NoTricksZone


Biomarker evidence for Arctic-region sea ice coverage in the northern Barents Sea indicates the most extensive sea ice conditions of the last 9,500 years occurred during the 20th century (0 cal yr BP). In contrast, this region was ice free with open water conditions during the Early Holocene (9,500-5,800 years ago).

Climatologist: Climate Models Are Predicting Too Much Warming

by Dr. Benny Peiser, May 23, 2019 in GWPF


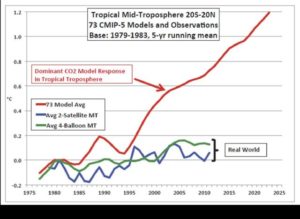
A leading climatologist has said that the computer simulations that are used to predict global warming are failing on a key measure of the climate today and cannot be trusted.

Speaking to a meeting in the Palace of Westminster in London, Professor John Christy of the University of Alabama in Huntsville told MPs and peers that almost all climate models have predicted rapid warming at high altitudes in the tropics:

A paper outlining Dr. Christy’s key findings is published today by the Global Warming Policy Foundation.

Greenland Glaciers Growing Again

by P. Homewood, May 22, 2019 in NotaLotofPeopleKnowThat


European satellites have detailed the abrupt change in behaviour of one of Greenland’s most important glaciers.

In the 2000s, Jakobshavn Isbrae was the fastest flowing ice stream on the island, travelling at 17km a year.

As it sped to the ocean, its front end also retreated and thinned, dropping in height by as much as 20m year.

But now it’s all change. Jakobshavn is travelling much more slowly, and its trunk has even begun to thicken and lengthen.

“It’s a complete reversal in behaviour and it wasn’t predicted,” said Dr Anna Hogg from Leeds University and the UK Centre for Polar Observation and Modelling (CPOM).

“The question now is: what’s next for Jakobshavn? Is this just a pause, or is it a switch-off of the dynamic thinning we’ve seen previously?”

The rapid flow, thinning and retreat of Jakobshavn’s front end in the mid to late 2000s were probably driven by warm ocean water from Disko Bay getting into the fjord and attacking the glacier from below.

The phase change, scientists think, may be related to very cold weather in 2013. This would have resulted in less meltwater coming off the glacier, which in turn might have choked the mechanism that pulls warm ocean water towards Jakobshavn.

Refuting the Smear Machine – Part 1

by Donna Laframboise, Lay 22, 2019 in BigPictureNews


When a journalist thinks for herself about climate change, insults and fabrications follow.

Two days ago I reported that a Washington, DC organization called the Government Accountability Project is smearing me on its website. I explained that PR firms target non-conformist climate reporting in an attempt to police what journalists say.

This story begins with a September 2013 opinion piece written by me and published in the Wall Street Journal. It concerned the Intergovernmental Panel on Climate Change (IPCC), and was headlined:

Warming Up for Another Climate-Change Report
Every six years, a U.N. panel issues its findings, and the media hail them as definitive. Skepticism may be in order.

Within hours, a Rockefeller Foundation funded entity called Climate Nexus released an error-riddled 600-word rebuttal that now resides on the Government Accountability Project’s official-looking website. An organization with ‘accountability’ in its name is smearing me by reprinting material whose actual author remains in the shadows, anonymous to this day.

Line by line, over the course of two blog posts, I will now respond to this collection of factual errors and lazy insults. Let us begin with the first sentence:

Scientists Find No Human Impact On Extreme Rainfall Events In Southeastern Australia…Rather ENSO Related

by P. Gosselin, May 21, 2019 in NoTricksZone


A new study appearing in the Journal of Weather and Climate Extremes titled “Historical extreme rainfall events in southeastern Australia” – led by LindenAshcroft, School of Earth Sciences, University of Melbourne – shows that even more extreme weather in terms of rainfall existed before 1900 in Melbourne, Sydney and Adelaide.

No real trend when examining Sydney, Australia data going back 178 years. Image: Ashcroft et al 2019.

Moreover, the authors found a “moderate and relatively stable relationship between El Niño–Southern Oscillation (ENSO) and annual variations of total rainfall and the number of raindays.”

Interview with Samuele Furfari: European elections

by European Scientist, May 21, 2009


In the context of the European elections, European Scientist is bringing you an series of views from experts from different countries on various topics around science and science policy in Europe, to provide an overview and analysis, which will be useful for the next commission.


ES: What is your assessment of energy policy in Europe? What have the major achievements of the outgoing commission been?

The greatest success of the outgoing commission is to have developed a policy to support gas interconnections by financing projects of common interest. The aim is that every single methane molecule that enters the territory of the Union can circulate to any other location. This will help to diversify gas supply sources, particularly from the south of the Union (thanks to more gas arriving as LNG and via the Southern Corridor).


ES: There is a wide disparity in energy policy between different countries (e.g. France and Germany). Do you think it is necessary to harmonise policy or on the contrary is it preferable to maintain diversity?

Greenland Has Been Cooling In Recent Years – 26 Of Its 47 Largest Glaciers Now Stable Or Gaining Ice

by K. Richard, May 20, 2019 in NoTricksZone


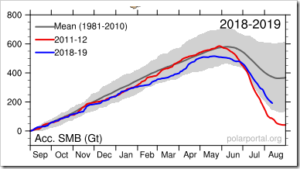
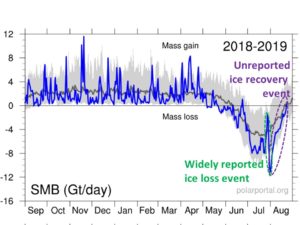
A new analysis of recent trends for the Greenland ice sheet reveals that since 2012 there has been an abrupt slowing of melt rates and a trend reversal to cooling and ice growth.
• In 2018, 26 of Greenland’s 47 largest glaciers were either stable or grew in size.
• Overall, the 47 glaciers advanced by +4.1  km² during 2018.  Of the 6 largest glaciers, 4 grew while 2 retreated.
• Since 2012, ice loss has been “minor” to “modest” due to the dramatic melting slowdown.
• Summer average temperatures for 2018 were lower than the 2008-2018 average by more than one standard deviation.
• Since 2000, the extent of the non-snow-covered areas of Greenland has increased by 500 km² per year.

EDITORIAL: A CLIMATE-CHANGE DRUBBING IN AUSTRALIA

by GWPF from WallStreetJ, May 19, 2019


The right in Australia won on the sharp contrast with the left on taxes, growth and climate change.

If American Democrats want a warning about the consequences of embracing the Green New Deal, look no further than Saturday’s election shocker in Australia. The opposition center-left Labor Party had led in the polls for months but lost as voters rejected its move left on taxes, spending and above all on climate change.

The ruling Liberal-National Coalition had been divided and tossed out two prime ministers during its nearly six years in power. Scott Morrison, the compromise choice as Prime Minister last year, managed to unite conservatives around a platform that stressed economic growth, tax cuts and support for the country’s energy producers.

Labor leader Bill Shorten promised to raise taxes on the “wealthy,” but his main theme was curbing climate change. Labor promised to cut carbon emissions nearly in half by 2030 compared to 2005 levels while subsidizing wind and solar. Mr. Shorten and Labor refused to support a job-producing coal mine in Queensland, and their candidates were routed in the resource-rich province.

Bill Shorten, leader of the Labor Party of Australia, reacts as he concedes defeat during the Labor party election night event in Melbourne, Australia, on Saturday, May 18, 2019. PHOTO: CARLA GOTTGENS/BLOOMBERG NEWS

140 Years to a PETM-Style Doomsday!!! Another PETM/Chicken Little of the Sea Epic Fail

by David Middleton, May 18, 2019 in WUWT


Gingerich, 2019 is a recent paper reiterating the PETM Chicken Little of the Sea meme. In the comments section of a recent post, it was cited as evidence of imminent catastrophe and followed up by a comment featuring this image from Clean Tecnica:

I just had to track this back to the Clean Tecnica article… Their scientific prowess is almost always laughable… And I was not disappointed.

Our Urban “Climate Crisis”

by Jim Steele, May 17, 2019 in WUWT


Based on a globally averaged statistic, some scientists and several politicians claim we are facing a climate crisis. Although it’s wise to think globally, organisms are never affected by global averages. Never! Organisms only respond to local conditions. Always! Given that weather stations around the globe only record local conditions, it is important to understand over one third of the earth’s weather stations report a cooling trend (i.e. Fig 4 below ) Cooling trends have various local and regional causes, but clearly, areas with cooling trends are not facing a “warming climate crisis”. Unfortunately, by averaging cooling and warming trends, the local factors affecting varied trends have been obscured.

It is well known as human populations grow, landscapes lose increasing amounts of natural vegetation, experience a loss of soil moisture and are increasingly covered by heat absorbing pavement and structures. All those factors raise temperatures so that a city’s downtown area can be 10°F higher than nearby rural areas. Despite urban areas representing less than 3% of the USA’s land surface, 82% of our weather stations are located in urbanized areas. This prompts critical thinkers to ask, “have warmer urbanized landscapes biased the globally averaged temperature?” (Arctic warming also biases the global average, but that dynamic must await a future article.)

‘Gimme Gimme Shock Treatment’

by Joe Bastardi, May 17, 2019 inThePatriotPost


Apparently, the new strategy to fight climate change is shock therapy. It’s like today’s environmental crusaders are channeling the Ramones song “Gimme Gimme Shock Treatment.” Here are some illustrations.

Shock treatment is for extreme measures. But take, for example, this Dr. Willie Soon plot of solar irradiance (a measure of solar energy) vs. water vapor:

Water vapor is the number-one greenhouse gas. So it’s no secret what temperatures do when water vapor increases.

Recent Studies Indicate Species Extinctions Decline With Warming – Mass Extinction Events Due To COOLING

by K. Richard, May 16, 2019 in NoTricksZone


In the past it has been widely reported that high and abruptly changing CO2 concentrations led to climate conditions that were “too hot for complex life to survive” on the planet.
More recently, though, scientists have determined that the opposite may have been true: mass extinction events occurred during periods of global cooling, expansive ice sheet growth, and marine-habitat-destroying sea level drops of more than 100 meters.
In fact, of the 5 previous mass extinctions, volcanism-induced glaciation is thought to be responsible for the 1st, 3rd, and 4th events, with the 2nd unknown and the 5th from an aseteroid impact.  None of these explanations have ties to CO2 concentrations or sudden warming.

Image Sources: Loehle & Eschenbach (2012), BBC, Wrightstone, 2019

No Hockey Sticks: Studies Reveal Long-Term Lack of Warming

by Vijay Jayaraj, May 16,2019 in WUWT


A new temperature reconstruction, using proxy temperature measurements from locations in central Asia, has revealed that there has been no warming in the past 432 years.

The Global Warming “Hiatus” or Pause

The word “hiatus” became popular in recent years after the discovery of a pause or hiatus in global warming. There has been a lack of warming in the atmosphere since 1999, despite the predictions of computer climate models.

HALF OF 21ST CENTURY WARMING DUE TO EL NINO

by Roy Spencer, May 15, 2019 in GWPF


A major uncertainty in figuring out how much of recent warming has been human-caused is knowing how much nature has caused. The IPCC is quite sure that nature is responsible for less than half of the warming since the mid-1900s, but politicians, activists, and various green energy pundits go even further, behaving as if warming is 100% human-caused.

The fact is we really don’t understand the causes of natural climate change on the time scale of an individual lifetime, although theories abound. For example, there is plenty of evidence that the Little Ice Age was real, and so some of the warming over the last 150 years (especially prior to 1940) was natural — but how much?

The answer makes as huge difference to energy policy. If global warming is only 50% as large as is predicted by the IPCC (which would make it only 20% of the problem portrayed by the media and politicians), then the immense cost of renewable energy can be avoided until we have new cost-competitive energy technologies.

The recently published paper Recent Global Warming as Confirmed by AIRSused 15 years of infrared satellite data to obtain a rather strong global surface warming trend of +0.24 C/decade. Objections have been made to that study by me (e.g. here) and others, not the least of which is the fact that the 2003-2017 period addressed had a record warm El Nino near the end (2015-16), which means the computed warming trend over that period is not entirely human-caused warming.

If we look at the warming over the 19-year period 2000-2018, we see the record El Nino event during 2015-16 (all monthly anomalies are relative to the 2001-2017 average seasonal cycle):


See also Spencer’s blog

The Little Ice Age: What Happened Around the World

by Marcia Wendorf, May 15, 2019 in InterestingEngineering


Between 1300 and 1850, the Earth experienced a Little Ice Age whose cause to this day is not known.

During the period 950 CE to 1250 CE, the earth experienced an unusually warm period, which became known as the Medieval Warm Period (MWP) or the Medieval Climatic Anomaly. At their height, temperatures during that period were similar to those experienced during earth’s mid-20th-century warming period.

Following the Medieval Warm Period came a period of intense cold, which has become known as the Little Ice Age (LIA). The term “Little Ice Age” was coined by Dutch-born American geologist F.E. Matthes in 1939. The LIA began around 1300 CE and lasted until about 1850 CE.

Within that stretch, NASA’s Earth Observatory has described three particularly cold periods: one around 1650, a second around 1770, and the third around 1850.