by Eric Worrall, April 20, 2019 in WUWT
Guest essay by Eric Worrall
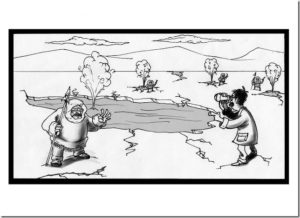
h/t Dr. Willie Soon; In climate science, when your model predictions are wrong, you wait for the world to correct itself.
…

by Eric Worrall, April 20, 2019 in WUWT
Guest essay by Eric Worrall
h/t Dr. Willie Soon; In climate science, when your model predictions are wrong, you wait for the world to correct itself.
…
by Jim Steele, April 19, 2019 in WUWT
In 2010 Nunavut’s Minister of Environment Daniel Shewchuk wrote, “Inuit hunters have a close relationship with the land and wildlife. They have observed that the overall population of polar bears in Nunavut is not declining as some suggest, but rather is thriving. No known environmental or other factors are currently posing a significant or immediate threat to polar bears overall. Furthermore, Inuit knowledge and science corroborate that the species can and will adapt to changing and severe climatic conditions, as it has done for centuries.”
The Inuit truly practice the concept of “it takes a village”. Hunters sit down in kappiananngittuq and respectfully share their observations of wildlife and their movements. Kappiananngittuq is the Inuit word for a “safe place to discuss”. Based on community discussions, Inuit have steadfastly claimed it is “The Time of the Most Polar Bears”. Overhunting has been one of the world’s greatest threats to wildlife. And the growing number of polar bears is testimony to wise hunting regulations now honored by the Inuit.
…
by GWPF, April 18, 2019

I have, so I researched how to identify a religious cult. Rick Ross, an expert on cults and intervention specialist,developed a list of ten warning signs for unsafe groups, which is published by the Cult Education Institute. So let’s take a look at all ten signs and compare:
…
by K. Richard, April 18, 2019 in NoTricksZone
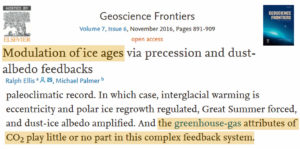
Image Source: Ellis and Palmer, 2016
…
by Todd Royal, April 17, 2019 in ClimateChangeDispatch
When pollsters realized that the public and elected officials weren’t buying global warming as a concept or policy, in a brilliant political move, they came up with the phrase “climate change.”
This helped sell the theory of man-made global warming. Weather is politicized, and computer models are only predictions that have been used as pawns in elections and justifying increased government budgets.
The global warming/climate change (GWCC) narrative has made Al Gore a rich man peddling unrealized fear.
In January 2012, sixteen eminent scientists published an article in the Wall Street Journal, titled, “No Need to Panic About Global Warming.” If mankind is causing global warming, then how do you explain this?
Today’s CO2 concentrations worldwide average about 380 parts per million. This level of CO2 concentration is trivial compared with the concentrations during earlier geologic periods.
For example, 460 million years ago, during the Ordovician Period, CO2 concentrations were 4,400 ppm, and temperatures then were about the same as they are today. With such high levels of CO2 the Earth should have been boiling.
It seems more reasonable to be agnostic based upon this fact:
…
by Prof. S. Furfari, April 4, 2019 in EuropeanScientist
The idea of replacing petroleum products with alternative fuels produced from agriculture dates back to the 1973 and 1979 oil crises. But apart from the development of bioethanol from cane sugar in Brazil, the idea had not come to fruition because it was not economically viable. It was the frenzy for some kind of sustainable development in the mid-2000s, combined with a perfect storm of realities, that led to the emergence of a political interest in biofuels.
…
by A. Watts, April 16, 2019 in WUWT
An El Niño that began to form last fall has matured and is now fully entrenched across the Pacific Ocean. Changes in sea surface temperatures (SSTs) brought about by an El Niño affect the atmosphere, resulting in distinctive changes in the rainfall pattern across the Pacific Basin. These changes show up as anomalies or deviations in NASA’s analysis of climatological rainfall.
…
As with a traditional El Niño, the effects from a Central Pacific El Niño can still spread to the U.S. Also, clearly visible in the NASA-generated monthly average rainfall was an area of heavy rain over the southeast coast of Africa associated with the passage of Cyclone Idai, which devastated the region with torrential flooding.
For more information about El Nino, visit: https://www.pmel.noaa.gov/elnino/definitions
Learn more about NASA’s Precipitation measurements: http://pmm.nasa.gov/trmm
by P. Gosselin, April 14, 2019 in NoTricksZone
At the latest Saturday Summary at Weatherbell Analytics, Joe Bastardi, a well-known 40-year veteran of meteorology, looks at tornadoes and hurricanes.
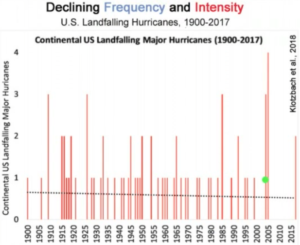
Although many meteorologists and climatologists confirm that there is no data suggesting global warming is causing more frequent and intense tornado and hurricane activity, there is a small but influential alarmist group who claim otherwise. And it’s no surprise who the click-baiting media parrot at maximum volume.
Landfalling hurricanes downward trend
At the 5:45 mark, Joe presents a chart depicting the frequency of US landfalling hurricanes since 1900:
…
by Judith Curry, April 14, 2019 in ClimateEtc.
A few things that caught my eye this past few weeks.
Why did the trend of
#Arctic#sea#ice loss accelerate after about 2000?” Meehl et al. (2018) offer an explanation. https://doi.org/10.1029/2018GL079989 …Antarctica’s iceberg graveyard could reveal the ice sheet’s future. [link]
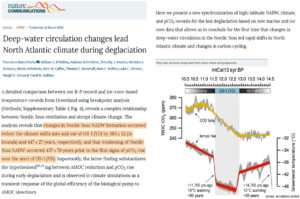
Latif: Decadal Atlantic Meridional Overturning Circulation slowing events in a climate model [link]
Koutsoyiannis: Extreme-oriented selection and fitting of probability distributions. [link]
Strengthened linkage between midlatitudes and Arctic in boreal winter [link]
Scientists discover evidence of long ocean memory [link]
Less ice in Arctic Ocean 6000-7000 years ago [link]
…
…
by University of Utah, April 14, 2019 in WUWT
Proteins help organisms form or inhibit ice crystals
Contrary to what you may have been taught, water doesn’t always freeze to ice at 32 degrees F (zero degrees C). Knowing, or controlling, at what temperature water will freeze (starting with a process called nucleation) is critically important to answering questions such as whether or not there will be enough snow on the ski slopes or whether or not it will rain tomorrow.
Nature has come up with ways to control the formation of ice, though, and in a paper published today in the Journal of the American Chemical Society University of Utah professor Valeria Molinero and her colleagues show how key proteins produced in bacteria and insects can either promote or inhibit the formation of ice, based on their length and their ability to team up to form large ice-binding surfaces. The results have wide application, particularly in understanding precipitation in clouds.
“We’re now able to predict the temperature at which the bacterium is going to nucleate ice depending on how many ice-nucleating proteins it has,” Molinero says, “and we’re able to predict the temperature at which the antifreeze proteins, which are very small and typically don’t work at very low temperatures, can nucleate ice.”
…
When heavy rain falls over the Indian Ocean and Southeast Asia and the eastern Pacific Ocean, it is a good indicator that temperatures in central California will reach 100°F in four to 16 days, according to a collaborative research team from the University of California, Davis, and the Asia-Pacific Economic Cooperation (APEC) Climate Center in Busan, South Korea.
The results were published in Advances in Atmospheric Scienceson April 12.
FROM PREDICTION TO PROTECTION
Heat waves are common in the Central California Valley, a 50-mile-wide oval of land that runs 450 miles from just north of Los Angeles up to Redding. The valley is home to half of the nation’s tree fruit and nut crops, as well as extensive dairy production, and heat waves can wreak havoc on agricultural production. The dairy industry had a heat wave-induced economic loss of about $1 billion in 2006, for instance. The ability to predict heat waves and understand what causes them could inform protective measures against damage.
…
by P. Homewood, April 13, 2019 in NotaLotofPeopleKnowThat
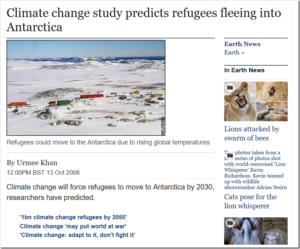
Climate change will force refugees to move to Antarctica by 2030, researchers have predicted.
Among future scenarios are the Olympics being held in cyberspace and central Australia being abandoned, according to the think tank report.
Forum for the Future, a research body committed to sustainable development, said they wanted to stir debate about how to avert the worst effects of global warming by presenting a radical set of ‘possible futures’.
There will be a shift towards greater energy efficiency, where desalination plants will run on solar power will turn the Sahara green.Refugees are expected to move to Antarctica because of the rising temperatures that will see the population of the continent increase to 3.5 million people by 2040.
As the world fails to act on climate change, researchers predict that global trade will collapse as oil prices break through $400 a barrel and electrical appliances will get automatically turned off when households exceed energy quotas.
…
…
by Science-Climat-Energie, 10 avril 2019
SCE fête son premier anniversaire avec 70 articles, près de 300 commentaires publiés (questions et réponses) et plus de 260 000 visiteurs.
Ce succès, il le doit à ses lecteurs car nous pensons qu’ils y trouvent une analyse critique des thèmes qui ne cessent d’occuper le devant de la scène médiatique nous montrant une dérive climatique tous azimuts symboliquement illustrée par la marche des lycéens, cautionnée par le monde politique et hélas aussi scientifique.
Notre site ne veut pas attiser la polémique mais bien susciter le débat car notre ligne directrice est l’argumentation et la discussion constructive en dehors de tous propos haineux, injurieux ou fantaisistes. Pas besoin de faire une dessin sur ce genre de propos que nous nous appliquons à ‘filtrer’ pour éviter les dérives qui sont monnaie courante sur les réseaux sociaux, mais finalement seulement moins de 5 % des commentaires sont refusés. Les commentaires argumentés qui contestent notre analyse sont bien entendu aussi publiés et c’est ainsi l’occasion de développer un débat serein, de mise au point réciproque. Tout le monde y gagne en clarté et compréhension. Nous ne prétendons pas détenir la vérité mais nos compétences nous permettent de discuter des problèmes climatiques et souvent de fournir un autre point de vue que celui relayé dans les médias.
L’hystérie climatique, vous l’aurez remarqué est hors norme, elle a récemment atteint des sommets que personne n’avait imaginé il y a seulement quelques années, et le ‘politiquement correct’ est devenu la règle de base pour qui ne veut pas d’ennuis. Combien de lycéens, de politiques, parfois même de scientifiques ont-ils lu les rapports du GIEC ? Connaissent-ils seulement les concentrations actuelle et passées du CO2, la composition de l’atmosphère… ? On peut en douter.

…
by T.M. Bonnicksen, November 12, 2018 in San FranciscoChronicle
The reason wildfires are burning California with unprecedented ferocity this year is because our public forests are so thick. It is our fault. We don’t manage our forests, we just let them grow. That is the simple truth. However, it is easier to deny the truth and blame a warming climate instead of admitting our guilt and taking action to prevent wildfires.
Hot, dry weather doesn’t cause catastrophic wildfires. It only makes them worse. In order for any fire to burn, it must have fuel. To spread wildly, it must have abundant fuel. Efforts in the 20th century to prevent fire and preserve forests have been too successful — they have disrupted the ecological balance and allowed more and more trees to grow.
…
by P. Gosselin, April 12, 2019 in NoTricksZone
German climate skepticism may have awakened, and ironically it may in large part be an unintended consequence of the “Greta demonstrations”. Germans may be finally getting fed up with the hysteria that has emptied out schools and turned into an ambush on their industrial jobs.
German geologist Dr. Sebastian Lüning, who together with Prof. Fritz Vahrenholt runs German climate skeptic site Die kalte Sonne, was recently interviewed by the conservative Junge Freiheit TV in Berlin (In German).
While the mainstream media focus almost exclusively on the ultra-alarmist climate scenarios, Lüning takes a far more moderate, non-alarmist view of climate and man’s impact on it.
In Lüning’s view, natural factors play an as big, or even bigger. role on climate than humans do.
Recent warming “not unusual”
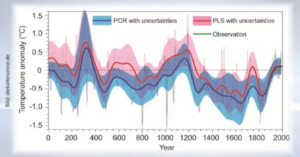
In the interview, Lüning explains how the assumptions made by the CO2 alarmists fall apart when tested against the observations of the past. The experienced German geologist explains why the modern 20th century warming is nothing unusual and that the same has already occurred numerous times over the past 10,000 years.
Start of industrialization coincided with end of Little Ice Age
One problem, Lüning says, is that scientists like to begin their temperature charts right before industrialization began in earnest, which happens to coincide near the temperature low point of the Holocene. He says that the term “pre-industrial” has been the source of “lots of confusion”.
…
by Tony Heller, April 12, 2019 in ClimateChangeDispatch
A quarter-century ago, the world’s leading climate experts predicted the end of skiing.
The exact opposite has occurred. Ski areas are receiving record snow and some are staying open all year round.
It wasn’t always like this though. In 1932, the Winter Olympics almost had to be canceled because of a lack of snow.
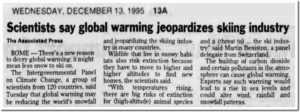
13 Dec 1995, Page 13 – The Times at Newspapers.com
…
by J. Curry and J. Johnstone, April 9, 2019 in WUWT
CFAN’s 2019 ENSO forecast is for a transition away from El Niño conditions as the summer progresses. The forecast for Sept-Oct-Nov 2019 calls for 60% probability of ENSO neutral conditions, with 40% probability of weak El Niño conditions. – Forecast issued 3/25/19
Introduction
CFAN’s early season ENSO forecast is motivated by preparing our seasonal forecast for Atlantic hurricane activity. ENSO forecasts made in spring have traditionally had very low skill owing to the ENSO ‘spring predictability barrier.’
During fall 2018, there was warming in the Central Equatorial Pacific, leading to a weak El Niño Modoki pattern, which impacted the latter part of the Atlantic hurricane season. This transitioned to a weak (conventional) El Niño in February 2019 and the atmospheric anomalies became more consistent with a conventional El Niño pattern.
NOAA’s latest forecast: Weak El Niño conditions are likely to continue through the Northern Hemisphere spring 2019 (~80% chance) and summer (~60% chance).
CFAN’s ENSO forecast analysis is guided by the ECMWF SEAS5 seasonal forecast system and a newly developed statistical forecast scheme based on global climate dynamics analysis.
ENSO statistics
…
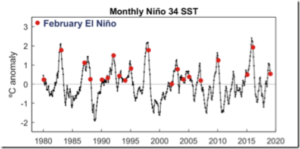
Figure 1 illustrates the recent ENSO history as depicted by monthly Niño 3.4 anomalies from 1980 to February 2019.
by Geological Survey of Norway, October 20, 2008 in ScienceDaily
Recent mapping of a number of raised beach ridges on the north coast of Greenland suggests that the ice cover in the Arctic Ocean was greatly reduced some 6000-7000 years ago. The Arctic Ocean may have been periodically ice free.
”The climate in the northern regions has never been milder since the last Ice Age than it was about 6000-7000 years ago. We still don’t know whether the Arctic Ocean was completely ice free, but there was more open water in the area north of Greenland than there is today,” says Astrid Lyså, a geologist and researcher at the Geological Survey of Norway (NGU).
…
by K. Richard, April 4, 2019 in NoTricksZone
…
by Roy Spencer, April 3, 2019 in GlobalWarming
Summary: The monthly anomalies in Australia-average surface versus satellite deep-layer lower-tropospheric temperatures correlate at 0.70 (with a 0.57 deg. C standard deviation of their difference), increasing to 0.80 correlation (with a 0.48 deg. C standard deviation of their difference) after accounting for precipitation effects on the relationship. The 40-year trends (1979-2019) are similar for the raw anomalies (+0.21 C/decade for Tsfc, +0.18 deg. C for satellite), but if the satellite and rainfall data are used to estimate Tsfc through a regression relationship, the adjusted satellite data then has a reduced trend of +0.15 C/decade. Thus, those who compare the UAH monthly anomalies to the BOM surface temperature anomalies should expect routine disagreements of 0.5 deg. C or more, due to the inherently different nature of surface versus tropospheric temperature measurements.
…
…
Conclusions
The UAH tropospheric temperatures and BOM surface temperatures in Australia are correlated, with similar variability (0.70 correlation).
Accounting for anomalous rainfall conditions increases the correlation to 0.80. The Tsfc trends have a slightly greater warming trend than the tropospheric temperatures, but the reasons for this are unclear. Users of the UAH data should expect monthly differences between the UAH and BOM data of 0.6 deg. C or so on a rather routine basis (after correcting for their different 30-year baselines used for anomalies: BOM uses 1961-1990 and UAH uses 1981-2010).
by IEA, April 7, 2019
|
Higher energy demand drove up global CO2 emissions in 2018
|
|
…
by K. Oroschakoff, April 6, 2019 in WUWT
The aftermath of the Dieselgate scandal is pushing drivers to switch from diesel to gasoline cars, undermining efforts to cut carbon dioxide emissions from road transport.
 Average CO2 emissions from new cars rose in 2017 for the first time since 2010 — largely due to the fuel change, according to final data released by the European Environment Agency (EEA) on Thursday.
That’s bad news for the EU’s efforts to cut emissions by at least 40 percent by 2030. Cars are responsible for around 12 percent of total EU CO2 emissions, according to the European Commission.
The EEA said that average CO2 emissions from new cars sold in 2017 increased by 0.4 grams of CO2 per kilometer to 118.5 grams, up from 118.1 grams in 2016. Under EU rules, carmakers need to meet a fleet-wide target of 95 grams by 2021.
Since 2010, emissions from new cars have fallen by 15.5 percent, or almost 22 grams of CO2 per kilometer; but emission reductions slowed between 2015 and 2016.
The rise in car pollution in 2017 is “stark confirmation that car makers need to achieve further and faster improvements in manufacturing and promoting more efficient cars,” the EEA said.
…
by P. Gosselin, April 5, 2019 in NoTricksZone
A new paper published in the Journal of Weather and Climate Extremes by Dittus et al confirms what many skeptics has strongly suspected all along: There’s no trend in precipitation extremes and there isn’t much predictability either.
…
by Judith Curry, April 1, 2019 in WUWT
Are values of equilibrium climate sensitivity > 4.5 C plausible?
For background, see these previous posts on climate sensitivity [link]
Here are some possibilistic arguments related to climate sensitivity. I don’t think the ECS example is the best one to illustrate these ideas [see previous post], and I probably won’t include this example in anything I try to publish on this topic (my draft paper is getting too long anyways). But possibilistic thinking does point you in some different directions when pondering the upper bound of plausible ECS values.
5. Climate sensitivity
Equilibrium climate sensitivity (ECS) is defined as the amount of temperature change in response to a doubling of atmospheric CO2 concentrations, after the climate system has reached equilibrium. The issue with regards to ECS is not scenario discovery; rather, the challenge is to clarify the upper bounds of possible and plausible worst cases.
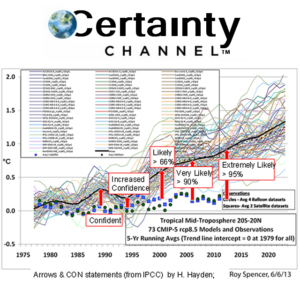
The IPCC assessments of ECS have focused on a ‘likely’ (> 66% probability) range, which has mostly been unchanged since Charney et al. (1979), to be between 1.5 and 4.5 oC. The IPCC AR4 (2007) did not provide any insight into a worst-case value of ECS, stating that values substantially higher than 4.5 oC cannot be excluded, with tail values in Figure 9.20 exceeding 10 oC. The IPCC AR5 (2013) more clearly defined the upper range, with a 10% probability of exceeding 6 oC.
Since the IPCC AR5, there has been considerable debate as to whether ECS is on the lower end of the likely range (e.g., < 3 oC) or the higher end of the likely range (for a summary, see Lewis and Curry, 2018). The analysis here bypasses that particular debate and focuses on the upper extreme values of ECS.
…
by Jim Steele, April 4, 2019 in WUWT
Extreme scientists and politicians warn we will suffer catastrophic climate change if the earth’s average temperature rises 2.7°F above the Little Ice Age average. They claim we are in a climate crisis because average temperature has already warmed by 1.5°F since 1850 AD. Guided by climate fear, politicians fund whacky engineering schemes to shade the earth with mirrors or aerosols to lower temperatures. But the cooler Little Ice Age endured a much more disastrous climate.
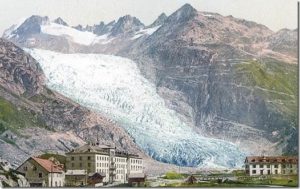
The Little Ice Age coincides with the pre-industrial period. The Little Ice Age spanned a period from 1300 AD to 1850 AD, but the exact timing varies. It was a time of great droughts, retreating tree lines, and agricultural failures leading to massive global famines and rampant epidemics. Meanwhile advancing glaciers demolished European villages and farms and extensive sea ice blocked harbors and prevented trade.
…