SHANGHAI/BEIJING (Reuters) – Approvals for new coal mine construction in China have surged in 2019, government documents showed, with Beijing expecting consumption of the commodity to rise in the coming years even as it steps up its fight against smog and greenhouse gas emissions.
Long-term cuts in coal consumption are a key part of China’s energy, environment and climate goals, but the fivefold increase in new mine approvals in the first-half of 2019 suggests China’s targets still provide ample room for shorter-term growth.
China’s energy regulator gave the go-ahead to build 141 million tonnes of new annual coal production capacity from January to June, compared to 25 million tonnes over the whole of last year, Reuters analysis of approval documents showed.
The projects included new mines in the regions of Inner Mongolia, Xinjiang, Shanxi and Shaanxi that are part of a national strategy to consolidate output at dedicated coal production “bases”, as well as expansions of existing collieries, the National Energy Administration (NEA) documents showed. […] Chinese coal output rose 2.6% in the first-half of 2019 to 1.76 billion tonnes.
MORE TO COME?
Industry groups still expect coal-fired power capacity to increase over the next few years, with investments in nuclear and renewables still insufficient to cover rising energy demand.
The research unit of the China State Grid Corporation last month forecast that total coal-fired capacity would peak at 1,230-1,350 gigawatts (GW), which would mean an increase of about 200-300 GW.
A study published earlier this year also suggested China’s targets would allow the construction of another 290 GW of coal-fired capacity in the coming years.
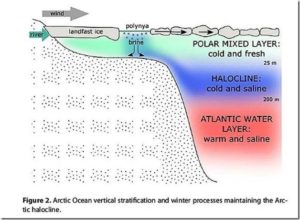
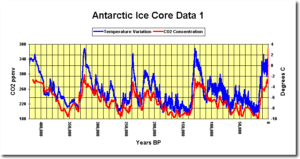
The globally averaged temperature rose 1.5°F from 1880 to today. Various narratives suggest the rise since 1950 was driven by increasing concentrations of CO2. The rising temperature before 1950 was considered natural. Since 1990, Arctic temperatures rose 2 to 3 times faster than the global average. So, are rapidly rising Arctic temperatures evidence of an impending climate crisis?
Astute students of climate history recall rapid Arctic warming has happened often and naturally. During the last Ice Age when CO2 concentrations were just half of today’s, 25 abrupt warming events happened. Arctic temperatures rose 9°F, and sometimes as much as 14°F in just 40 years. These rapid warming episodes are now called Dansgaard–Oeschger events (D-O events) in honor of the researchers who first detected them in Greenland’s ice cores. These D-O episodes affected global climate, changed ocean currents along California’s coast and altered the range of European forests.
What caused such abrupt warming? Basic physics dismisses changes in greenhouse gases or solar insolation because neither radiative effect induces such rapid warming. The most reasonable explanation suggests episodes of ventilating heat, that had accumulated in the Arctic Ocean, rapidly warmed the air.
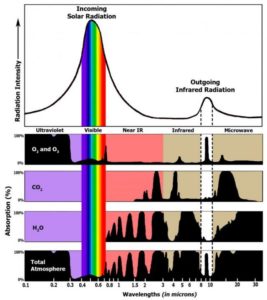
Of course, with a ~ 410 parts per million concentration of CO2 in the atmosphere, we know that is a physical impossibility. Carbon Dioxide is a colorless and odorless gas:
A field experiment was performed in Oak Ridge, TN, with four instrumented towers placed over grass at increasing distances (4, 30, 50, 124, and 300 m) from a built-up area. Stations were aligned in such a way to simulate the impact of small-scale encroachment on temperature observations. As expected, temperature observations were warmest for the site closest to the built environment with an average temperature difference of 0.31 and 0.24 °C for aspirated and unaspirated sensors respectively. Mean aspirated temperature differences were greater during the evening (0.47 °C) than day (0.16 °C). This was particularly true for evenings following greater daytime solar insolation (20+ MJDay−1) with surface winds from the direction of the built environment where mean differences exceeded 0.80 °C. The impact of the built environment on air temperature diminished with distance with a warm bias only detectable out to tower-B’ located 50 meters away.
The experimental findings were comparable to a known case of urban encroachment at a U. S. Climate Reference Network station in Kingston, RI. The experimental and operational results both lead to reductions in the diurnal temperature range of ~0.39 °C for fan aspirated sensors. Interestingly, the unaspirated sensor had a larger reduction in DTR of 0.48 °C. These results suggest that small-scale urban encroachment within 50 meters of a station can have important impacts on daily temperature extrema (maximum and minimum) with the magnitude of these differences dependent upon prevailing environmental conditions and sensing technology.
by Jean N., 17 avril 2019 in Science-Climat-Energie
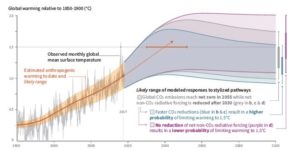
Cet article s’inscrit dans le cadre de l’activité actuelle médiatique tout azimut en Belgique, notamment relayée par les marches hebdomadaires des étudiants pour le climat. Comme vous le savez peut-être si vous êtes un lecteur fidèle de SCE, nous avons démontré dans plusieurs articles que l’hypothèse de l’effet de serre radiatif ne tient pas la route (ici, ici et ici) et n’explique pas le léger réchauffement actuel de la basse atmosphère. Les fins connaisseurs savent également qu’il existe de nombreuses publications scientifiques remettant en cause l’hypothèse de l’effet de serre radiatif (plus de 500 publications rien que pour 2018), toutes écrites par des physiciens, des chimistes, des géologues ou des climatologues. Si cette somme d’évidences vous a convaincu, le GIEC aurait alors tort sur toute la ligne et le CO2 d’origine anthropique n’aurait aucun rôle majeur déterminant la température de la basse troposphère. Cependant, admettons un instant que vous ne soyez pas convaincu et admettons donc que le GIEC ait raison. Tout ce qui est écrit dans son dernier rapport spécial devrait alors être vrai… Quelle serait alors la part de la Belgique dans le réchauffement? Asseyez-vous pour ne pas tomber, vous allez être surpris.
Figure 1. Extrait de la Figure SPM.1 du résumé pour décideurs (SPM) du rapport spécial publié par le GIEC fin 2018. Cette figure se trouve en page 8 du rapport du GIEC.
by Anthony Watts, March 22, 2019 in WUWT/BjornLomborg
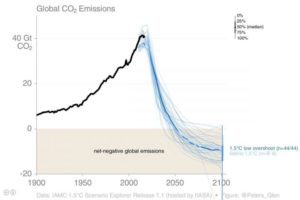
Bjorn Lomborg writes on Twitter:
“Wishful thinking: This graph starkly shows what power the 1.5°C target The black line is CO₂ emission increase last 118 years (last year was highest ever) The blue lines indicate the emissions necessary to ensure the widely politically agreed 1.5°C limit”.
Climate models play a central role in the attribution of global warming or climate change to human causes. The standard argument takes the following form: “We can get the model to do X, using human causes, but not without them, so human causes must be the cause of X.” A little digging reveals that this is actually a circular argument, because the models are set up in such a way that human causes are the only way to get change.
The finding is that humans are the cause of global warming and climate change is actually the assumption going in. This is circular reasoning personified, namely conclude what you first assume.
This circularity can be clearly seen in what many consider the most authoritative scientific report on climate change going, although it is actually just the most popular alarmist report. We are talking about the Summary for Policymakers (SPM), of the latest assessment report (AR5), of the heavily politicized UN Intergovernmental Panel on Climate Change (IPCC). Their 29 page AR5 SPM is available here.
After years of trying to suppress their release, and finally being ordered to be released by a judge, they are now public, and we have them here. This will remain as a “top post” for a day, new stories will be below this one.
There’s quite a treasure trove, but also some duplications from previous releases.
Comme déjà mentionné dans un article précédent publié sur SCE, la variation de la couverture nuageuse a probablement un effet majeur sur la température moyenne globale de la basse atmosphère. Si l’on veut prédire le climat du futur comme le prétend le GIEC il faut savoir modéliser la formation des nuages. Que nous dit le dernier rapport scientifique (AR5) du GIEC à ce sujet? Le but du présent article est simplement de vous présenter quelques phrases tirées de ce rapport. La science est-elle dite?
1. Le chapitre 7 du rapport AR5 publié par le GIEC en 2013
Le chapitre 7 du rapport AR5 du GIEC[1] fait 60 pages et est consacré aux nuages et aux aérosols (le rapport AR5 complet fait au total 1535 pages). Ce chapitre 7 comporte 22 pages de références et cite plus de 1100 articles scientifiques publiés dans des revues aussi prestigieuses que Science, Nature ou PNAS. Le chapitre 7 a été écrit sous la direction de Olivier Boucher (France) et David Randall (USA), deux spécialistes du domaine. Nous n’allons pas ici remettre en question la validité de ce chapitre. Nous allons simplement vous présenter quelques phrases tirées du rapport. Comme le rapport est écrit en anglais nous vous proposerons ci-dessous une “traduction maison” des phrases qui nous paraissent les plus importantes, assorties parfois de quelques explications pour bien les comprendre. Les lettres entre crochets ([A] à [P]) renvoient simplement au texte original en anglais, donné en Annexe du présent article.
A significant number of scientists say that the Earth’s climate is in large part impacted by solar activity, and less so by trace gas CO2 concentration. German scientists present new findings showing a link between solar activity and precipitation in Europe.
=================================================
How Changes on the Sun Influences Rain
A balanced level of precipitation provides the basis for a wide range of economic and social activities in Europe. Particularly agriculture, drinking water supply and inland waterway transport are directly affected. However, the amount of rain fluctuates strongly from year to year. While it may pour torrentially in one year, rain may remain absent for weeks in other year. The population is used to this variability and usually knows how to deal with it.
But what is behind the strong changes? A system, or pure atmospheric noise?
by Dr. Jean N., 16 janvier 2019 in ScienceClimatEnergie
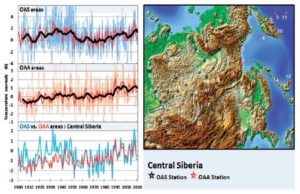
La théorie radiative de l’effet de serre prédit que la température de la basse atmosphère augmente lorsque le taux de CO2 croît. Si l’on prend par exemple une très vaste région, comme la Chine centrale ou le Midwest américain, qui couvrent tous deux des centaines de milliers de km2, on devrait donc observer un accroissement des températures moyennes de la basse atmosphère en fonction du temps. Effectivement, dans ces régions, et comme pour tout l’hémisphère Nord, le taux de CO2 n’a fait qu’augmenter depuis le début des mesures par spectrométrie infra-rouge en 1959. Cependant, une étude récente vient de montrer que la température moyenne n’aurait pas augmenté dans ces vastes régions, et ce malgré l’augmentation du taux de CO2 atmosphérique. L’étude en question a été publiée dans Energy & Environment en 2018 par deux chercheurs danois de la Danish Technical University, Frank Lansner et Jens Pedersen. Il faut rester prudent, mais si cette étude est confirmée, il s’agirait d’un sérieux problème pour la théorie radiative de l’effet de serre.
…
Figure 1. Anomalie de température pour la Sibérie centrale entre 1900 et 2010 (voir article)
Three minutes is not a lot of time, so let me be brief. I’ll start with something that might shock you. There is no evidence that CO2 has a large effect on climate. The two arguments used by the IPCC to so called “prove” that humans are the main cause of global warming, and which implies that climate sensitivity is high, are that: a) 20th century warming is unprecedented, and b) there is nothing else to explain the warming.
These arguments are faulty. Why you ask?
We know from the climate-gate e-mails that the hockey stick was an example of shady science. The medieval warm period and little ice ages were in fact global and real. And, although the IPCC will not admit so, we know that the sun has a large effect on climate, and on the 20th century warming in particular.
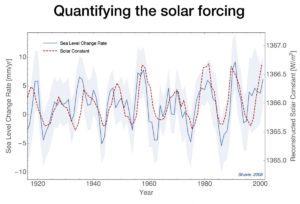
In the first slide we see one of the most important graphs that the IPCC is simply ignoring. Published already in 2008, you can see a very clear correlation between sea level change rate from tide gauges, and solar activity. This proves beyond any doubt that the sun has a large effect on climate. But it is ignored.
by S.J. Crockford, October 31, 2018 in ClimateChangeDispatch
What’s a good analogy for sea ice as essential polar bear habitat? Biologist Andrew Derocher claims that the soil in a forest is appropriate because without the soil you can’t have the forest ecosystem.
However, that’s a specious comparison because the amount of soil in a forest does not change markedly with the seasons the way that Arctic sea ice does.
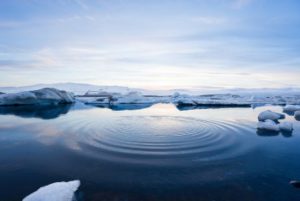
A much better analogy is a big pond that dries up a bit every summer. The amount of habitat available to sustain aquatic plants, amphibians and insects is reduced in the dry season but many species have special adaptations for surviving reduced water availability.
The large-scale syntheses of global mean temperatures in IPCC fourth report suggested that the Northern Hemisphere temperature in the second half of the 20th century was likely the highest in at least the past 1,300 years and the 1990s was likely the warmest decade. However, this remains debated and the controversy is centered on whether temperatures during the recent half century were higher than those during the Medieval Climate Anomaly (MCA, AD 800–1300) and the Roman Warm Period (RWP, BC 200–AD 400), the most recent two natural warm periods of the late Holocene. Here the high resolution sea surface temperatures (SSTs) of two time windows around AD 990 (±40) and AD 50 (±40), which located in the MCA and RWP respectively, were reconstructed by the Sr/Ca ratio and δ18O of Tradacna gigas shells from the northern South China Sea. The results suggested that the mean SSTs around AD 990 (±40) and AD 50 (±40) were 28.1 °C and 28.7 °C, 0.8 °C and 1.4 °C higher than that during AD 1994–2005, respectively. These records, together with the tree ring, lake sediment and literature records from the eastern China and northwest China, imply that the temperatures in recent decades do not seem to exceed the natural changes in MCA, at least in eastern Asia from northwest China to northern SCS.
L’ écologie a renoué avec l’environnement le lien fondamental et sacré qui le relie à l’homme. Par cette communion, elle remplit le vide laissé par les religions dans un contexte d’explosion technologique. Mais elle fait semblant d’ignorer que le fossé s’élargit de toutes parts entre la déclinaison politique de ses principes et le bilan de ses résultats.
La dimension mondiale du phénomène et les sommes inédites qui lui sont consacrées justifient une tentative d’analyse de son origine et de sa démarche, ainsi que de ses ressorts cachés et des conséquences géopolitiques qu’on peut en attendre.
Ces 2 faces de l’écologie politique sont l’objet des 2 parties du présent article.
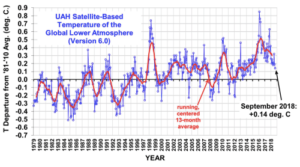
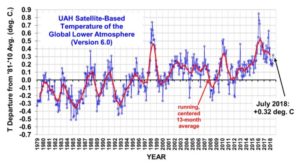
The Version 6.0 global average lower tropospheric temperature (LT) anomaly for September 2018 was +0.14 deg. C, down a little from +0.19 deg. C in August. This was the coolest September in the last 10 years in the global average. — Roy Spencer, 2 October 2018
In media interviews or discussions with the public, the most frequent opening challenge is; “But don’t 97% of scientists agree?” It is usually said obliquely to imply that you know a lot, and I don’t understand, but I assume you are wrong because you are in the minority. I don’t attempt to refute the statistics. Instead, I explain the difference in definitions between science and society. Then I point out that the critical 97% figure is that at least 97% of scientists have never read the claims of the IPCC Reports. How many people reading this article have read all the IPCC Reports, or even just one of them? If you have, it is probably the deliberately deceptive Summary for Policymakers (SPM). Even fewer will have read the Report of Working Group I: The Physical Science Basis. Naively, people, especially other scientists, assume scientists would not falsify, mislead, misrepresent, or withhold information. It is worse, because the IPCC deliberately created the false claim of consensus.
Climate scientists acknowledge that CO2 follows rather than leads temperature, but they insist that feedback loops drive the transitions from glacial to interglacial conditions.
by Dr. R. Pielke, August 14, 2018 in ClimateChangeDispatch
In his posthumously published book “Factfulness,” the Swedish statistician Hans Rosling describes a paradox: “The image of a dangerous world has never been broadcast more effectively than it is now, while the world has never been less violent and more safe.”
A case in point: natural disasters. The earth will always be volatile, but despite recent fires, volcanoes, and hurricanes, humanity currently is experiencing a stretch of good fortune when it comes to disasters.
It’s difficult to be “factful” about disasters—the vivid trauma of each event distracts observers from the long-term decrease in destructiveness.
But climate activists make the problem worse by blaming every extreme weather event on human-caused climate change, hoping to scare people into elevated concern.
Science is the enemy of global warming alarmists. And objective scientific data is that enemy on steroids. Let’s take a look at what the scientific data reveal:
Cela fait un an, le 31 juillet 2017, que le Professeur Istvan Marko nous quittait prématurément à l’âge de 61 ans.
Ce scientifique, chimiste, était un de ceux qui était le plus écouté à l’échelle nationale et internationale, pour ses avis pertinents sur les problèmes climatiques d’aujourd’hui, aussi bien sous l’angle scientifique que celui de leurs emballements médiatiques. Nous lui avons rendu hommage il y a un an à travers un numéro spécial dédié à sa personne, et poursuivons son action dans l’esprit qui fut toujours le sien , celui de la rigueur scientifique.
The famous Oxford Dodo died after being shot in the back of the head, according to new research. Using revolutionary forensic scanning technology and world-class expertise, researchers have discovered surprising evidence that the Oxford Dodo was shot in the neck and back of the head with a shotgun.
The significant and unexpected findings, made by Professor Paul Smith, director of the Museum of Natural History, and Professor Mark Williams from WMG at the University of Warwick, only became apparent when mysterious particles were found in the specimen during scans carried out to help analyse its anatomy.
In today’s post I am going to go over how I went about creating a reconstruction of the history of temperature from the GHCN data sets using a variable number of stations reporting each year for the years of 1900 to 2011. Before I go into the details of that reconstruction, let me cover how I went about discarding some alternative methods.
I decided to create a test case for reconstruction methods by picking five random, complete station records. I then deleted a portion of one of those records. I mimicked actual record conditions within the GHCN data so my testing would be realistic. In different trials I deleted all but the last 20 years, all but the first 20 years or some number of years in the middle. I tried normalizing each station to its own average and averaging the anomalies. I tried averaging the four complete stations, then normalizing the fourth station by its average distance from the main average. In all cases when I plotted the reconstruction against the true average the errors were quite large.normalizing the fourth station by its average distance from the main average. In all cases when I plotted the reconstruction against the true average the errors were quite large.
LONDON (Reuters) – Emissions regulated under Europe’s carbon market rose for the first time in seven years in 2017 due to stronger industrial output, data published on Tuesday by the European Commission and examined by carbon analysts at Thomson Reuters showed (…)
La géologie, une science plus que passionnante … et diverse