CFAN’s 2019 ENSO forecast is for a transition away from El Niño conditions as the summer progresses. The forecast for Sept-Oct-Nov 2019 calls for 60% probability of ENSO neutral conditions, with 40% probability of weak El Niño conditions. – Forecast issued 3/25/19
Introduction
CFAN’s early season ENSO forecast is motivated by preparing our seasonal forecast for Atlantic hurricane activity. ENSO forecasts made in spring have traditionally had very low skill owing to the ENSO ‘spring predictability barrier.’
During fall 2018, there was warming in the Central Equatorial Pacific, leading to a weak El Niño Modoki pattern, which impacted the latter part of the Atlantic hurricane season. This transitioned to a weak (conventional) El Niño in February 2019 and the atmospheric anomalies became more consistent with a conventional El Niño pattern.
NOAA’s latest forecast: Weak El Niño conditions are likely to continue through the Northern Hemisphere spring 2019 (~80% chance) and summer (~60% chance).
CFAN’s ENSO forecast analysis is guided by the ECMWF SEAS5 seasonal forecast system and a newly developed statistical forecast scheme based on global climate dynamics analysis.
ENSO statistics
…
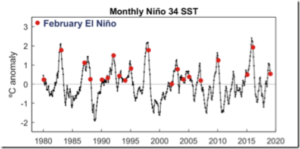
Figure 1 illustrates the recent ENSO history as depicted by monthly Niño 3.4 anomalies from 1980 to February 2019.
NOAA gives a 55% chance of El Niño conditions persisting through the spring.
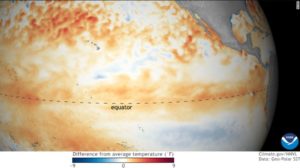
Sea surface temperatures in January — orange-red colors are above normal.
“While sea surface temperatures are above average, current observations and climate models indicate that this El Niño will be weak, meaning we do not expect significant global impacts through the remainder of winter and into the spring,” Halpert said.
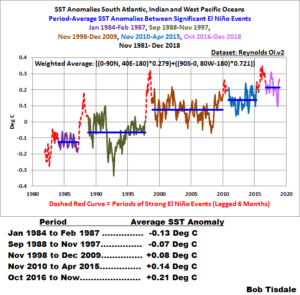
It was a little more than 10 years ago that I published my first blog posts on the obvious upward steps in the sea surface temperatures of a large portion of the global oceans…upward steps that are caused by El Niño events…upward steps that lead to sunlight-fueled, naturally occurring global warming.
There is a very simple explanation for those El Niño-caused upward shifts that also make themselves known in the sea surface temperature data for much larger portion of the global oceans than I first presented a decade ago…the upward steps that are blatantly obvious in the satellite-era (starts November 1981) of sea surface temperature data for the South Atlantic, Indian and West Pacific Oceans, as shown in Figure 1, which together cover about 52% of the surfaces of the global oceans.
In late 2018, there were some predictions that there would be a significant El Niño event in 2019. There were strong hints of an El Niño event in both SST data and forecasts. In an April 6th 2018 essay, Bob Tisdale suggested “Looks like one may be forming right now.”
Wavelet analyses of modern global temperature anomalies provides an excellent visualization tool of temperature signal characteristics and patterns over the past 150 years. Scafetta recognized key temperature oscillations of about 9, 20 and 60-years using power spectra of global surface temperature anomalies. There has been much discussion about the 60-year quasi-oscillation both in WUWT and publications.
Detrending the temperature time series and removing the 60-year underlying trend enables insights into the interplay of interannual and decadal scales. Wavelet analyses reveals these periodic signals have distinguished patterns and characteristics that repeat over time suggesting natural external and internal influences. Interannual wavelet patterns that consist of 9-year and 3 to 5-year quasi-oscillations are repeated and dominate over 70% of the instrumental record. The 3 to 5-year discontinuous breakouts are coincident to El Niño and La Niña events of the El Niño-Southern Oscillation (ENSO). A period of quiescence from 1925 to 1960 is devoid of most wavelet signals suggesting different or transitional climate processes.
The fast approaching solar minimum and its potential impact on the upcoming winter season
By Meteorologist Paul Dorian
Overview
In the long term, the sun is the main driver of all weather and climate and multi-decadal trends in solar activity can have major impacts on oceanic and atmospheric temperatures. In addition, empirical observations have shown that the sun can have important ramifications on weather and climate on shorter time scales including those associated with the average solar cycle of around 11-years. For example, there is evidence that low solar activity during solar minimum years tend to be well-correlated with more frequent “high-latitude blocking” events compared to normal and this type of atmospheric phenomenon can play an important role in the winter season.
…
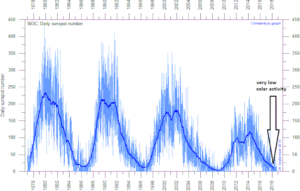
his plot shows the daily observations of the number of sunspots during the last four solar cycles back to 1 January 1977 according to Solar Influences Data Analysis Center (SIDC). The thin blue line indicates the daily sunspot number, while the dark blue line indicates the running annual average. The current low sunspot activity is indicated by the arrow at the lower right of the plot. Last day shown: 30 Sep 2018. Data source: climate4you.com.
Sometimes a chance comment sets off a whole chain of investigation. Somewhere recently, in passing I noted the idea of the slope of the temperature gradient across the Pacific along the Equator. So I decided to take a look at it. Here is the area that I examined.
…
I’ve written about this temperature gradient before, in a post called The Tao of El Nino. If you take time to read that post, this one will make more sense. …
A University of Aizu team has identified two distinct Indo-Pacific processes shaping the unique features and extraordinary ferocity of super El Ninos. A systematic analysis of these processes and their interactions will improve forecasts of the elusive super El Ninos, the researchers claim.
…
Extremely warm sea surface temperatures are a notable feature of the super El Ninos that occurred in 1972, 1982, and 1997. The fact that Pacific Ocean processes responsible for generating regular El Ninos could not explain this key signature of super El Ninos came as a big shock,” says Dachao Jin, co-author of the study.
Presently sea surface temperatures (SST) are the best available indicator of heat content gained or lost from earth’s climate system. Enthalpy is the thermodynamic term for total heat content in a system, and humidity differences in air parcels affect enthalpy. Measuring water temperature directly avoids distorted impressions from air measurements. In addition, ocean covers 71% of the planet surface and thus dominates surface temperature estimates. Eventually we will likely have reliable means of recording water temperatures at depth.
Recently, Dr. Ole Humlum reported from his research that air temperatures lag 2-3 months behind changes in SST. He also observed that changes in CO2 atmospheric concentrations lag behind SST by 11-12 months. This latter point is addressed in a previous post Who to Blame for Rising CO2?
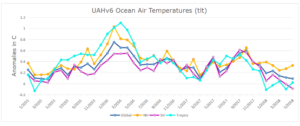
The May update to HadSST3 will appear later this month, but in the meantime we can look at lower troposphere temperatures (TLT) from UAHv6 which are already posted for May. The temperature record is derived from microwave sounding units (MSU) on board satellites like the one pictured above… (…)
Why do U.S. climate forecasters pay so much attention to a pattern that operates in the remote tropical Pacific? Because the Pacific is the world’s biggest ocean, and disruptions to its climate have a long reach. The seesawing changes in tropical rainfall, winds, and ocean temperature that accompany La Niña and its warm-phase partner, El Niño, trigger a cascade of potentially predictable impacts on seasonal climate in the United States and beyond.
by P. Homewood, April 5, 2018 in NotaLotofPeopleKnowThat
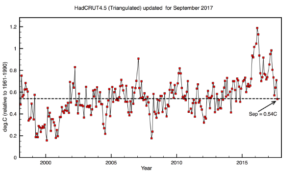
Hadcrut now have numbers out for February, giving an anomaly of 0.523C, measured against the 1961-90 baseline, slightly down on January’s 0.556C.
This means that the last six months have been below 0.59C.
It is clear that temperatures are settling down at a similar level to the period between 2002 and 2007, following the record El Nino of 2015/16. Bear in mind as well that the degree of accuracy, according to the Hadley Centre, is about +/-0.1C. As such, it cannot be said that there has been any statistically measurable warming since 2001, or indeed previously.
It is possible temperatures may drop further in coming months, with weak La Nina conditions established, although these are predicted to disappear by the summer.
Dans un communiqué du 18 janvier 2018, l’OMM (Organisation météorologique mondiale) classe 2017 dans les trois années les plus chaudes depuis le début des mesures. Le record reste détenu par l’année 2016 (+ 1,2° C au-dessus des températures de la période pré industrielle) suivie par l’année 2015 (+ 1,1° C) toutes deux influencées par un épisode El Niño intense.
L’année 2017 serait ainsi l’année la plus chaude sans influence d’un phénomène El Niño. L’OMM suggère ainsi une reprise du réchauffement mondial après une pause des températures de plus de 17 ans.
by Dr Benny Peiser, January 24, 2018 in ClimateChangeDispatch
The solar variability is not negligible in comparison with the energy imbalance that drives global temperature change.
Therefore, because of the combination of the strong 2016 El Niño and the phase of the solar cycle, it is plausible, if not likely, that the next 10 years of global temperature change will leave an impression of a ‘global warming hiatus.’ —James Hansen et al, 18 January 2018
The Global Warming Policy Foundation (GWPF) has lodged a new complaint with the BBC about its misleading reporting on global warming.
The 2014-2017 El Nino “warm blob” was likely created, maintained, and partially recharged on two separate occasions by massive pulses of super-heated and chemically charged seawater from deep-sea geological features in the western North Pacific Ocean. This strongly supports the theory all El Ninos are naturally occurring and geological in origin. Climate change / global warming had nothing to do with generating, rewarming, intensifying, or increasing the frequency of the 2014-2017 El Nino or any previous El Nino.
If proven correct, this would revolutionize climatology and key aspects of many interrelated sciences such as oceanography, marine biology, glaciology, biogeochemistry, and most importantly meteorology. Information supporting a geological origin of El Ninos is diverse, reliable, and can be placed into five general categories as follows: (…)
A new study published Jan. 8 in the journal Nature Geoscience reveals that strong El Nino events can cause significant ice loss in some Antarctic ice shelves while the opposite may occur during strong La Nina events.
The HadCRUT4.5 temperature anomaly for September calculated by spherical triangulation is 0.54C, a fall of 0.17C since August. Temperatures have seemingly returned to a long trend after the 2016 El Nino.
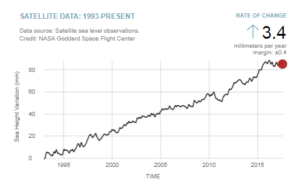
This is interesting. It appears that a “pause” has developed in global sea levels. For two years, since July 2015, there has been no sustained increase in global sea level, in fact, it appears to have actually fallen a bit. This graph, provided by NASA’s Global Climate Change website, tells the story:
Stratospheric aerosols from large tropical explosive volcanic eruptions backscatter shortwave radiation and reduce the global mean surface temperature. Observations suggest that they also favour an El Niño within 2 years following the eruption. Modelling studies have, however, so far reached no consensus on either the sign or physical mechanism of El Niño response to volcanism
by Anastasios Tsonis, September 15, 2017 in GWPF Report26 (.pdf)
This report describes this phenomenon and brings it into a modern global con- text. But the story is more than simply one of some old South American geophysical phenomenology seen from a global perspective; it is tied to an extraordinary story about new scienti c thinking, arising at the end of the 20th century, concerning the nature of change itself.
The only two people who were qualified to review this data tampering by RSS, Dr. Roy Spencer and Dr. John Christy, were not consulted and the changes were not submitted for peer review to them. This is very severe malfeasance, and standard practice for climate scientists. Their job is to push global warming, not do science.
Now, people often discuss procedures like “removing the effects of the El Nino from the global temperature record”. What they mean is that they have noted the similarity between the temperature of the NINO3.4 region and the global temperature. Figure 1 shows that relationship as seen in the CERES data.
The West Antarctic Ice Sheet, a landbound mass of ice larger than Mexico, experienced substantial surface melt through the austral summer of 2015-2016 during one of the largest El Niño events of the past 50 years, according to scientists who had been conducting the first comprehensive atmospheric measurements in the region since the 1960s.
The reduction in global temperature after the recent El Nino continues though not as swiftly as some predicted. The next few months will be interesting to see if it returns to levels seen before the recent El Nino took place when global annual average temperatures changed little for at least 15 years.
La géologie, une science plus que passionnante … et diverse