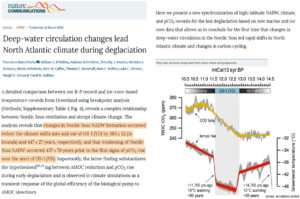
A new paper indicates the rise in CO2 concentration occurred well after the Northern Hemisphere’s ocean circulation changes drove the abrupt warming (~11,700 years ago) that ended the last ice age – a lag that effectively leaves no causal role for CO2 during deglaciation.
Summary:The monthly anomalies in Australia-average surface versus satellite deep-layer lower-tropospheric temperatures correlate at 0.70 (with a 0.57 deg. C standard deviation of their difference), increasing to 0.80 correlation (with a 0.48 deg. C standard deviation of their difference) after accounting for precipitation effects on the relationship. The 40-year trends (1979-2019) are similar for the raw anomalies (+0.21 C/decade for Tsfc, +0.18 deg. C for satellite), but if the satellite and rainfall data are used to estimate Tsfc through a regression relationship, the adjusted satellite data then has a reduced trend of +0.15 C/decade. Thus, those who compare the UAH monthly anomalies to the BOM surface temperature anomalies should expect routine disagreements of 0.5 deg. C or more, due to the inherently different nature of surface versus tropospheric temperature measurements.
…
…
Conclusions
The UAH tropospheric temperatures and BOM surface temperatures in Australia are correlated, with similar variability (0.70 correlation).
Accounting for anomalous rainfall conditions increases the correlation to 0.80. The Tsfc trends have a slightly greater warming trend than the tropospheric temperatures, but the reasons for this are unclear. Users of the UAH data should expect monthly differences between the UAH and BOM data of 0.6 deg. C or so on a rather routine basis (after correcting for their different 30-year baselines used for anomalies: BOM uses 1961-1990 and UAH uses 1981-2010).
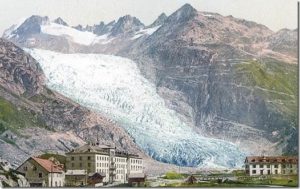
Extreme scientists and politicians warn we will suffer catastrophic climate change if the earth’s average temperature rises 2.7°F above the Little Ice Age average. They claim we are in a climate crisis because average temperature has already warmed by 1.5°F since 1850 AD. Guided by climate fear, politicians fund whacky engineering schemes to shade the earth with mirrors or aerosols to lower temperatures. But the cooler Little Ice Age endured a much more disastrous climate.
The Little Ice Age coincides with the pre-industrial period. The Little Ice Age spanned a period from 1300 AD to 1850 AD, but the exact timing varies. It was a time of great droughts, retreating tree lines, and agricultural failures leading to massive global famines and rampant epidemics. Meanwhile advancing glaciers demolished European villages and farms and extensive sea ice blocked harbors and prevented trade.
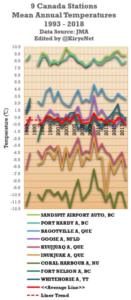
Canada’s CBC here recently cited “a leaked report” which claimed Canada is “warming at twice the global rate.”
According to the “leaked report”, Canada’s annual average temperature over land has warmed 1.7 C when looking at the data since 1948. But that claim is misleading when recent data is considered.
Over the past 25 years, since scientists began to warn that the planet was warming in earnest, there has not been any warming when one looks at the untampered data provided by the Japan meteorology Agency (JMA) that were measured by 9 different stations across Canada. These 9 stations have the data dating back to around 1983 or 1986, so I used their datasats.
Looking at the JMA database and plotting the stations with longer term recording, we have the following chart:
by P. Homewood, April 3, 2019 in NotaLotofPeopleKnowThat
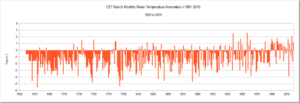
According to CET, March 2019 was the 17th warmest on record since 1659, 1.2C higher than the 1981-2010 average.
Sound impressed? No, thought not!
The month as a whole actually seemed to be pretty unremarkable. There was some mild weather at the start of the month, accompanied by very wet weather. The last few days were also pleasant and sunny.
But unusually warm?
The graph at the top gives a bit of perspective.
First of all it is obvious that last month was pretty typical of Marchs during the last 30 years or so.
The fact that it is 1.2C above the 30-year average means little, as natural variability means some years are warmer and others cooler, such as last year. That’s what an average is.
Indeed, in the last 30 years, eleven had March anomalies of 1C or more. Six of these years were warmer than this March.
By far the warmest Marchs were in 1957 and 1938, again suggesting that there was nothing unusual about last month.
The other thing which stands out is that most Marchs used to be much colder than normal until the 1980s.
One fellow climate blogger recently wrote on how he’s been been looking at GHCN ‘unadjusted’ data and noticed that scientists at NASA appear to have been altering them: “This is a fairly disturbing development,” he wrote.
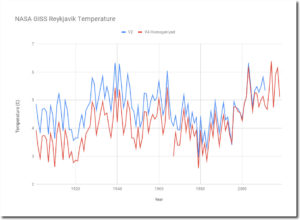
Heating up Reykjavik and Nuuk
Cited as an example is Reykyavik, Iceland. According to Tony Heller here, “The current version V4 has massively cooled the past, to make it look like Iceland is warming.”
Heller then posted a chart showing the difference between v2 unadjusted and the new v4 ‘unadjusted’ for the Reykjavik station.
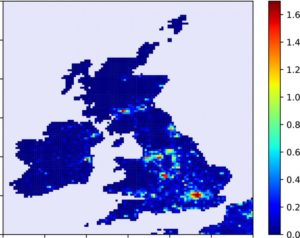
This study aims to estimate the affect of urbanisation on daily maximum and minimum temperatures in the United Kingdom. Urban fractions were calculated for 10 km × 10 km areas surrounding meteorological weather stations. Using robust regression a linear relationship between urban fraction and temperature difference between station measurements and ERA‐Interim reanalysis temperatures was estimated.
For an urban fraction of 1.0, the daily minimum 2‐m temperature was estimated to increase by 1.90 ± 0.88 K while the daily maximum temperature was not significantly affected by urbanisation. This result was then applied to the whole United Kingdom with a maximum Tmin urban heat island intensity (UHII) of about 1.7K in London and with many UK cities having Tmin UHIIs above one degree.
This paper finds through the method of observation minus reanalysis that urbanisation has significantly increased the daily minimum 2‐m temperature in the United Kingdom by up to 1.70 K.
…
Figure 5 Map showing the change in Tmin due to the urbanisation at the 10 km × 10 km scale over the United Kingdom and Ireland. The colour bar shows the magnitude of the temperature change in K
First in a two part series on Holocene climate variability.
Summary: Holocene climate is characterized by two initial millennia of fast warming followed by four millennia of higher temperatures and humidity, and a progressively accelerating cooling and drying for the past six millennia. These changes are driven by variations in the obliquity of the Earth’s axis. The four millennia of warmer temperatures are called the Holocene Climatic Optimum which was 1-2°C warmer than the Little Ice Age. This climatic optimum was when global glaciers reached their minimum extent. The Mid-Holocene Transition, caused by orbital variations, brought a change in climatic mode, from solar to oceanic dominated forcing. This transition displaced the climatic equator, ended the African Humid Period and increased El Niño activity.
…
Figure 36. Holocene temperature profile. A. Summer (July-August) Central England temperature reconstruction from multiple proxies and sources by H. H. Lamb.Crosses represent dating and temperature uncertainty. Black dots are centennial averages. Red dot is 1900-1965 average. Source: Lamb, H.H. 1977. Climate: Present, past and future. Volume 2. B. Greenland temperature reconstruction based on an average of uplift corrected δ18O isotopic data from Agassiz and Renland ice cores. This average has been corrected for changes in the δ18O of seawater and calibrated to borehole temperature records. Some historical periods are indicated. Source: B. Vinther et al., 2009.
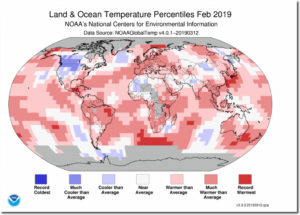
According to NCEI’s Regional Analysis, South America, Europe and Oceania had a February temperature that ranked among the eight warmest Februarys on record.
There is no such word as “Februarys” – plural for February is Februaries. But besides the fact they are illiterate, they are also lying
…
It looks like the world is burning up, with just a few slightly cool areas. It has an official government seal on it, so it must be accurate, right?
The map below shows where NOAA actually had surface temperatures in February.
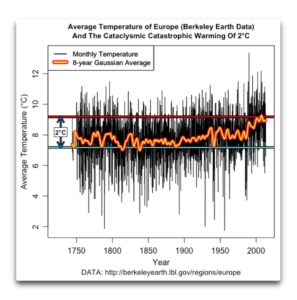
People often say that we’re heading into the unknown with regards to CO2 and the planet. They say we can’t know, for example, what a 2°C warming will do because we can’t do the experiment. This is seen as important because for unknown reasons, people have battened on to “2°C” as being the scary temperature rise that we’re told we have to avoid at all costs.
But actually, as it turns out, we have already done the experiment. Below I show the Berkeley Earth average surface temperature record for Europe. Europe is a good location to analyze, because some of the longest continuous temperature records are from Europe. In addition, there are a lot of stations in Europe that have been taking record for a long time. This gives us lots of good data.
So without further ado, here’s the record of the average European temperature.
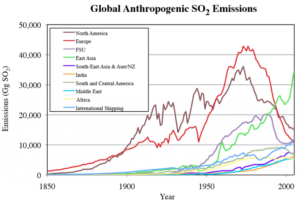
Anthropogenic emissions of SO2 into the troposphere peaked during year 1972 at about 131 Megatonnes. By year 2000, due to worldwide Clean Air Act efforts, SO2 emissions in the West had decreased by approximately 48 Megatonnes. However, during the same time period, emissions elsewhere rose by 23 Megatonnes, for a net worldwide decrease of 25 Megatonnes.
…
Figure 1: Global sulfur dioxide emissions by region (North Amer- ica = USA,Canada; East Asia, Japan, China, and South Korea). J.Smith et al., Fig 6.
…
It also proves that the IPCC “Graph of Radiative Forcings” is completely incorrect, since it does not include any warming due to the removal of dimming-aerosols from the atmosphere. To be correct, this forcing needs to be included (which will have the effect of completely eliminating any forcing due to CO2). As noted above, all of the warming can be accounted for by the reduction in SO2 emissions.
Chinese climate scientists are clearly off-message. They keep referring to the global warming hiatus which so many scientists and activists – those who shout on twitter and prowl the comment sections of off-colour articles on the subject – know has been trounced and discredited again and again. They clearly ought to have a word with the emerging science powerhouse that is China.
Writing recently in “Science of The Total Environment,” Li and Zha of Nanjing Normal University, say the global hiatus has played a prominent role in their thinking and they see it reflected in China. Using satellite data they found a hiatus in China between 2001-15. They found warming in western and southern China and a 15-year cooling trend in northern China. For China as a whole they estimate that the warming rate is just -0.02°C per decade. The conclude that, “there is a regional warming hiatus, a pause or slowdown in China, and (it) implies that greenhouse gas induced warming is suppressed by other natural forcing in the early 21st century.”
There is also Li et al writing in Climate Dynamics who are a little more forceful saying, “since the late 1990s, the global warming has ground to a halt, which has sparked a rising interest among the climate scientists. The hiatus is not only observed in globally average surface air temperature, but also in the China winter air temperature trend, which turns from warming during 1979-1997 to cooling during 1998-2013.” They attribute the effect to the melting of Arctic sea ice.
Gan et al (Lanzhou University and South Dakota State University), reporting in Earth and Space Science say that the hiatus, if not cooling, is seen over the Northern Hemisphere finding that the daily temperature minimum experienced an “obvious” decline in North America during the warming slowdown period. They relate the changes in daily temperature minimum to the Atlantic Multi-decadal Oscillation.
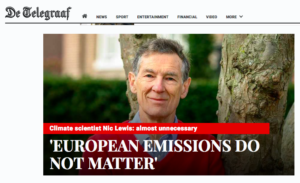
“What really matters is: what happens in developing countries such as China, India, Indonesia, Brazil and Nigeria”, says Lewis, who gave a presentation at De Groene Rekenkamer Foundation this week in Amsterdam. According to him, it is much more important that developing countries quickly become richer and how rising CO2 emissions that this entails can be limited.
“We have a lot of knowledge and expertise in Europe. We can spend our money better than investing billions in subsidies and other climate policies that have virtually no effect on global emissions.”
Lewis would prefer to see investments in the development of clean nuclear energy or techniques to get CO2 out of the air and shut down coal-fired plants. “That could then be rolled out over the rest of the world.”
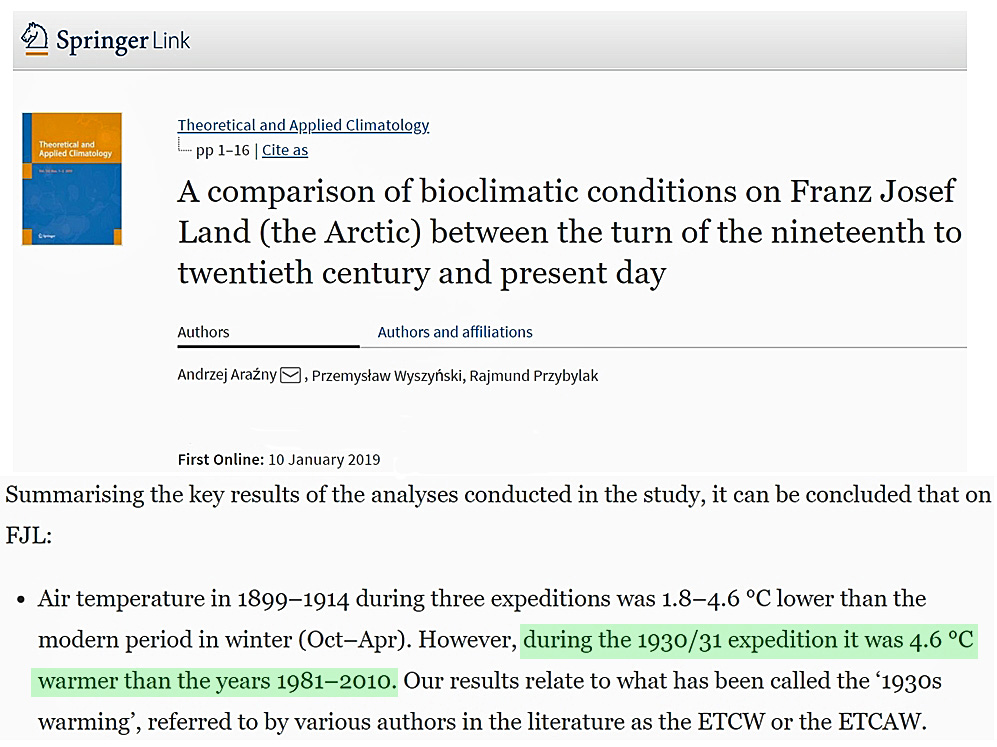
Yet another scientific paper presents evidence that the Arctic region was warmer than recent decades during the 1930s, leading scientists to conclude there is “still-insufficient knowledge of the mechanisms governing the Arctic Climate System.”
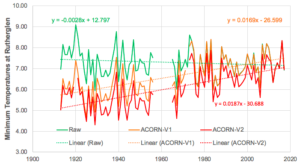
The Bureau of Meteorology has rewritten Australia’s temperature in this way for the second time in just six years – increasing the rate of warming by 23 percent between Version 1 and the new Version 2 of the official ACORN-SAT temperature record.
Temperatures from the Rutherglen research station in rural Victoria are one of the 112 weather stations that make-up ACORN-SAT. Temperature have been changed here by Blair Trewin, under the supervision of David Jones at the Bureau.
…
Annual average minimum temperatures at Rutherglen (1913 to 2017). Raw temperatures (green) show a mild cooling trend of 0.28 degrees Celsius per 100 years. This cooling trend has been changed to warming of 1.7 degrees Celsius per 100 years in ACORN-SAT Version 1 (orange). These temperatures have been further remodeled in ACORN-SAT Version 1 (red) to give even more dramatic warming, which is now 1.9 degrees Celsius.
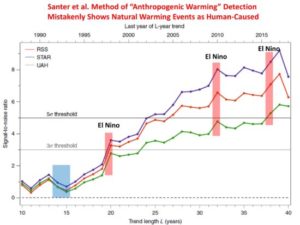
A new paper in Nature Climate Change by Santer et al. (paywalled) claims that the 40 year record of global tropospheric temperatures agrees with climate model simulations of anthropogenic global warming so well that there is less than a 1 in 3.5 million chance (5 sigma, one-tailed test) that the agreement between models and satellites is just by chance.
And, yes, that applies to our (UAH) dataset as well.
While it’s nice that the authors commemorate 40 years of satellite temperature monitoring method (which John Christy and I originally developed), I’m dismayed that this published result could feed a new “one in a million” meme that rivals the “97% of scientists agree” meme, which has been a very successful talking point for politicians, journalists, and liberal arts majors.
John Christy and I examined the study to see just what was done. I will give you the bottom line first, in case you don’t have time to wade through the details:
The new Santer et al. study merely shows that the satellite data have indeed detected warming (not saying how much) that the models can currently only explain with increasing CO2 (since they cannot yet reproduce natural climate variability on multi-decadal time scales).
That’s all.
But we already knew that, didn’t we? So why publish a paper that goes to such great lengths to demonstrate it with an absurdly exaggerated statistic such as 1 in 3.5 million (which corresponds to 99.99997% confidence)? I’ll leave that as a rhetorical question for you to ponder.
by P. Homewood, February 27, 2019 in NotaLotofPeopleKnowThat
But let’s take a closer look.
Daily temperature extremes are not especially meaningful in themselves.
If global warming is responsible for yesterday’s record , was it also responsible for the record January temperature set in 1958? Or in March 1968, April 1949, May 1922, June 1957, September 1906 or December 1948, when records, which still stand, were also set?
According to Yuan et al. (2018), “studies examining sea surface temperature variability over the past one century and their influence on climate change in China are seriously lacking.” And therefore, in an effort to remedy this information void, the team of eight Chinese scientists developed “the first tree-ring-based dendroclimatic sea surface temperature (SST) reconstruction for the South China Sea.”
In accomplishing their objective Yuan et al. cored 22 Pinus massoniana trees in the Changting Region of the Fujian Province, China. Analysis of the cores revealed a statistically significant relationship between the tree-ring series and gridded March SSTs (1°C resolution) of the South China Sea (16-20°N, 112-116°E). Ultimately, this relationship enabled them to produce a proxy temperature reconstruction over the period 1893-2011, which reconstruction is shown below.
by JC Maurin, 22 février 2019 in ScienceCimatEnergie
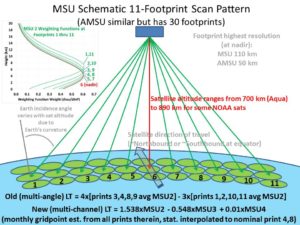
Afin d’élaborer les indicateurs de température, on utilise des radiomètres MSU, AMSU ou ATMS embarqués sur des satellites, puis on construit l’indicateur à partir des mesures et de diverses corrections. On obtient ainsi un indicateur qui concerne la quasi-totalité du globe, contrairement aux indicateurs terrestres basés essentiellement (avant 1980) sur quelques milliers de stations américaines et européennes. Au sujet des mesures par satellites, et sans être spécialiste dans ce domaine, un physicien peut néanmoins donner quelques éléments d’appréciation qu’ignore parfois un lecteur intéressé par la climatologie. Le but de la seconde partie de l’article sera atteint si ce lecteur a appris des éléments nouveaux, il pourra ensuite approfondir la question par lui-même.
The Las Vegas Valley Snow Event: What happened? Did we see this coming? Yes and no. We had been seeing very small chances for snow in the valley for a few days, but it wasn’t until Sunday afternoon that the hi-resolution models were consistently indicating that western parts of the valley could see up to 3 inches and up to an inch elsewhere. That’s when the decision was made to issue the Winter Weather Advisory.
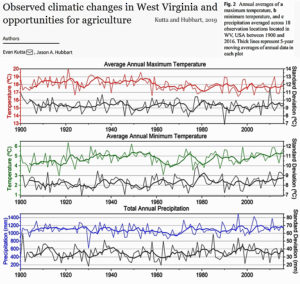
“Between 1900 and 2016, climatic trends were characterized by significant reductions in the maximum temperatures (−0.78°C/century; p = 0.001), significant increases in minimum temperatures (0.44 °C/century; p = 0.017) [overall -0.34°C/century], and increased annual precipitation (25.4 mm/century) indicative of a wetter and more temperate WV climate. Despite increasing trends of growing degree days during the first (p ≤ 0.015) and second half of the period of record, the long-term trend indicated a decrease in GDD [warm growing degree days] of approximately 100 °C/days.”
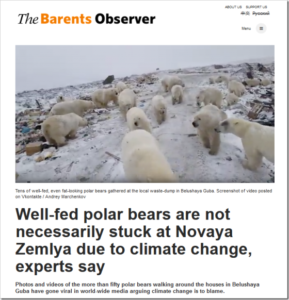
This story could very well be headlined: «When internet came to Novaya Zemlya».
Locals started to post photos and video of the more than 50 polar bears in their neighborhood. Over the last week, social media as well as online newspapers globally have gone mad over the news coming out from one of the remotest towns on the planet, the closed military settlement of Belushaya Guba.
The little-known town on the Russian Arctic archipelago have since last autumn been struggling with polar bears walking the streets and around the corners of apartment- and office buildings. Even walking by a baby-stroller inside an entrance, one of the video-recordings show.
Regional authorities have declared a state of emergency after the bears no longer react to noice- and light signals from guards trying to scare them off.
Belushaya Guba, like the entire Novaya Zemlya, is closed off military area. The newly upgraded air base Rogachevo is just a few kilometers outside of town.
Today any warming found anywhere almost always gets blamed on heat supposedly getting trapped by rising atmospheric CO2 concentrations. Moreover, activist scientists insist we ignore all other powerful factors such as solar and oceanic cycles.
In fact these activists have become so extreme that they insist that record cold today is caused by warming.
But as people learned already in the first grade, the earth’s surface warms when the sun shines on it, and tends to cool when clouds obstruct the sun.
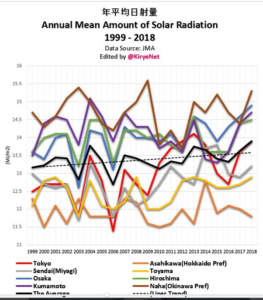
Solar radiation at the surface has risen over the past decades
In Japan, the Japanese Meteorology Agency (JMA) has 8 stations that measure solar radiation reaching the surface, and many other for recording temperature.
Data from the 8 stations recording solar radiation are plotted since 1999 (i.e. 20 years) as follows:
by G. Geuskens, 14 février 2019, in ScienceClimatEnergie
Le climat peut changer, comme il l’a toujours fait et continuera à le faire sous l’action de variables naturelles. Les activités humaines peuvent-elles avoir une influence comme le prétend la théorie du réchauffement climatique d’origine anthropique ? Cette théorie est basée sur l’existence d’un hypothétique effet de serre défini comme un phénomène radiatifcausé par des gaz tels la vapeur d’eau ou le CO2 qui absorbent une fraction du rayonnement infrarouge émis par la Terre et le réémettent ensuite dans toutes les directions et notamment vers la surface terrestre dont la température serait, de ce fait, plus élevée qu’en l’absence de gaz absorbant l’infrarouge. L’effet de serre résulterait donc essentiellement de l’émission par les molécules de CO2 d’un rayonnement de fluorescence dans le domaine infrarouge [1]. Cette définition est claire et scientifiquement valable car conforme au principe de réfutabilité défini par Karl Popper. Nous l’examinerons à la lumière de théories physiques bien établies et de faits expérimentaux connus.
1. Le CO2 dans les basses couches atmosphériques
…
La géologie, une science plus que passionnante … et diverse


