Archives par mot-clé : USA

Guerre du prix du pétrole : revanche de la technologie sur l’OPEP

by Samuel Furfari, 9 mars 2020 in Contrepoints


Le monde regorge de pétrole grâce au développement de la technologie. C’est elle qui est le vecteur de la marche du monde de l’énergie.

Je vous avoue que je ne suis pas le cours du pétrole tous les jours. Cela n’a d’importance que pour les traders et les spéculateurs qui engrangent des bénéfices plantureux en jouant sur quelques centimes de volumes gigantesques.

Si vous voulez comprendre la géopolitique du pétrole et donc de l’énergie , il faut observer les tendances lourdes, comme celle du week-end dernier.

Lorsque j’ai publié en mars 2014 un livre intitulé Vive les énergies fossiles qui indique qu’il n’y a aucune raison objective ou technologique pour que le prix du brut dépasse les 100 dollars le baril, on m’a pris pour un farfelu. Même si j’étais probablement le seul à oser le dire ouvertement en milieu francophone, nombreux étaient ceux qui l’affirmaient de vive voix et par écrit dans le monde. Les faits nous ont donné raison.

LA DEMANDE DE PÉTROLE EN CHUTE LIBRE

Face à la chute brusque de l’activité économique occasionnée par l’épidémie de coronavirus, la demande de pétrole est en chute libre. La consommation chinoise de pétrole a chuté de plus de 3 millions de barils par jour.

De toute évidence, cette crise sera bien plus profonde pour l’économie mondiale que celle déclenchée par les subprimes en 2008. On s’attend à un net recul de la demande en énergie primaire et singulièrement du pétrole.

Cela va de soi : les avions qui ne volent pas, les voitures qui restent au garage, les restaurants désertés, les stades fermés, les vacances annulées font dégringoler la consommation de produits pétroliers et partant, de toute l’économie. De quoi réjouir les écologistes profonds !

Vendredi dernier à Vienne, à la réunion de l’OPEP, comme d’habitude la Russie – non membre – a été conviée à participer aux travaux. L’OPEP, qui manipule le prix du brut depuis 1973 voulait réduire sa production pour maintenir le prix au niveau précédant l’arrivée sur scène du virus dévastateur. Par la même occasion Ryad aurait mis l’Iran encore plus à genoux pour le peu de pétrole que celui-ci parvient à écouler au marché noir (l’Iran ne sait plus où stocker le pétrole pompé qu’il ne peut pas vendre).

LES ORIGINES DE LA CHUTE DU PRIX DU PÉTROLE BRUT

Il est vrai que depuis trois ans, l’OPEP et la Russie se sont accordés pour ajuster leurs extractions à la demande mondiale. Il y a bien eu une tentative de faire chuter le prix de manière à restreindre le développement du pétrole de roche-mère des USA, mais en vain.

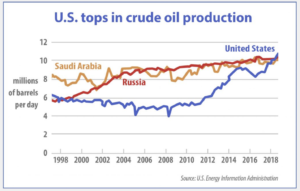
Cette fois, Moscou n’a pas voulu suivre le leader de l’OPEP – Ryad – et a refusé d’adhérer à la réduction de la production pour soutenir le prix. L’Arabie Saoudite, piquée au vif, a réagi de manière inverse et a déclaré son intention de porter sa production de brut à plus de 10 millions de barils par jour en avril, après l’expiration de l’accord actuel entre l’OPEP et la Russie fin mars – connu sous le nom d’OPEP+.

De plus, elle a réduit le prix de tous ses bruts vers toutes les destinations de 6 à 8 dollars le baril. La conséquence ne s’est pas fait attendre : le prix du brut a chuté à environ 32 dollars le baril.

Les contrats à terme sur le pétrole ont subi leur plus grosse perte quotidienne depuis 1991 lors de la guerre du Golfe. Lors de la crise asiatique de 1998, le Financial Times du 10 septembre 1998 titrait que la seule chose qui était plus basse que le cours du pétrole était le moral de l’économie. On pourrait dire la même chose aujourd’hui.

LE MONDE REGORGE DE PÉTROLE GRÂCE À LA TECHNOLOGIE


Continuer la lecture de Guerre du prix du pétrole : revanche de la technologie sur l’OPEP

New Study: Greenland’s Largest Glacier Has Rapidly Thickened Since 2016…Fueled By 1.5°C Regional Ocean Cooling

by K. Richard, February 17, 2020 in NoTricksZone


Greenland’s largest glacier (Jakobshavn) has quite abruptly thickened since 2016. The thickening has been so profound the ice elevations are nearly back to 2010-2011 levels. The nearby ocean has cooled ~1.5°C – a return to 1980s-era temperatures.

The world’s glaciers have not been following along with the CO2-driven catastrophic melting narrative.

Alaska

For example, in a study of 50 Alaskan glaciers for the warming period between 1972-2012, researchers (McNabb and Hock, 2014) found there was
“…no corresponding change in the number of glaciers retreating nor do we see corresponding acceleration of retreat rates. To the contrary, many glaciers in the region have advanced…”

Sea Level Rise Is Accelerating (If You Ignore Pre 1970 Data!)

by P. Homewood, February 19, 2020 in NotaLotofPeopleKnowThat


This has to go down as one of the most fraudulent climate studies yet!

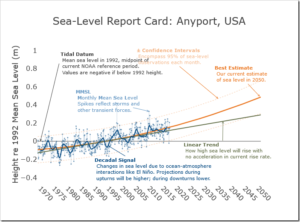
Want to know how sea level in your area is changing due to global warming and other factors? Our ‘report cards’ can help. Updated by the Virginia Institute of Marine Science each year as annual tide-gauge data become available, they display recent sea-level trends and project sea-level height to the year 2050 for 32 localities along the U.S. East, Gulf, West, and Alaskan coasts.

Report Card Components

Our report cards have 3 components: the 2050 projection, recent trends in the rates of sea-level change, and an explanation of processes affecting sea level at each locality.

The annotated chart below, using the latest data from Norfolk, Virginia, briefly explains the data and statistical approaches we use in our 2050 projections. Visit an individual locality for details on all its report-card components. You can also compare sea-level trends, projections and processes among localities and by region. For full technical details, read our report.

https://www.vims.edu/research/products/slrc/index.php

HISTORICAL DATA DESTROYS THE GLOBAL WARMING MYTH, AND PEOPLE ARE WAKING TO IT…

by Cap Allon, January 22, 2020 in Electroverse


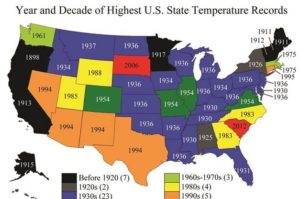
According to NOAA’s own historical data, of the 50 U.S. state all-time record high temperatures, 23 were set during the 1930s, while 36 occurred prior to 1960 — climate change proponents are feeding us a fairy tale, and I’m sick of it…

The maniacal sociopaths of the world may have won control of the narrative, but they seemingly have little sway over the will of the people. You need only browse the comment section below any “climate change” article or social media post to see the wave of folks resoundingly rejecting the scam-of-a-world-view assembled before them (one of the few positives of SM).

The man-made global warming rejection is likely down to two things: the first being that the so called “scientific consensus” has been failing for far too long — you can’t start warning people in the 1980s that we have 10 years left to save the planet, only to keep repeating that prophecy for the next 4 decades. This is probably the reason our youth have become the new target — kids don’t have this history of failure to draw-upon when browsing the bullet points of the latest IPCC report -for example- meaning they’re far easier to manipulate.


While NOAA/NASA claims 2019 as the “second warmest year ever”, other data shows 2019 cooler than 2005 for USA.

by Anthony Watts, January 15, 2020 in WUWT


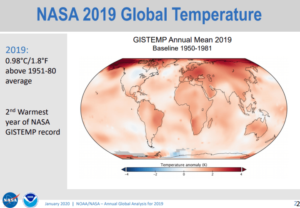
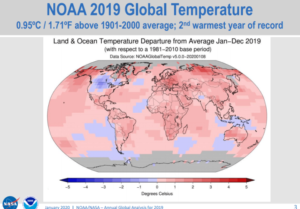
Today, at the big 100 year anniversary shindig of the American Meteorological Society (AMS) there was a press release session that featured NOAA and NASA GISS talking about how their climate data says that the world in 2019 was the second warmest ever.

Here is their slideshow presentation, released today: https://www.ncdc.noaa.gov/sotc/briefings/20200115.pdf

In my opinion, the NOAA/NASA press release (and slideshow) is inconsistently presented. For example, they can’t even agree on a common base period for comparisons. Some graphs use 1951-1980 while others compare to 1981-2010 averages to create anomaly plots. NOAA and NASA owe it to the public to present climate data with a consistent climate period for comparison, otherwise it’s just sloppy science. NASA GISS has consistently resisted updating the 1951-1980 NASA GISS baseline period to the one NOAA and other datasets use, which is 1981-2010. GISS stubbornly refuses to change even though they have been repeatedly excoriated for keeping it.

That 1951-1980 period just so happens to be the coolest period in the 20th century, so by using that as a baseline, the peak amount of warming anomaly is magnified in NASA GISS plots. Most laymen will never spot this. A simple comparison of the two maps show the difference in the peak values:


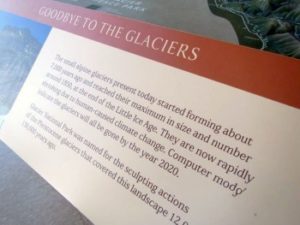
False Alarm: Glacier National Park Changes ‘Gone By 2020’ Signs

by Chris White, January 9, 2020 in ClimateChangeDispatch


Officials who manage Glacier National Park are swapping out signs warning visitors that climate change would cause the park’s glaciers to disappear by 2020.

The U.S. Geological Survey told the park in 2017 that the complete melting off of the glaciers was no longer expected, park spokeswoman Gina Kurzmen told CNN.

Forecast models over the years show the glaciers were no longer at risk of disappearing by that date, she noted.

Placards at the St. Mary’s Visitor Center, located in Montana’s mountain ranges, were reportedly changed in 2019. The park is waiting for budget authorization to update the park’s full set of signs, Kurzman noted.

The signs will be changed to say: “When they will completely disappear depends on how and when we act. One thing is consistent: the glaciers in the park are shrinking.”

SEE ALSO: National Park Stealth Removes Warning That All Glaciers Will Be Gone By 2020

SEE ALSO: Himalayan Glacier Loss Caused By Many Factors, Not Just Warming

USGS noted in a report to the Daily Caller News Foundation in 2019 that recent harsh winters had significantly changed forecasts from years past.

“Glacier retreat in Glacier National Park speeds up and slows down with fluctuations in the local climate,” a representative with the USGS told the DCNF at the time. The agency is responsible for managing the park.

“Subsequently, larger than average snowfall over several winters slowed down that retreat rate and the 2020 date used in the NPS display does not apply anymore,” the representative said.


Also : National Park Stealth Removes Warning That All Glaciers Will Be Gone By 2020

The Fracking Decade

by Noah Rothman, January 2020, in Commentary


The malady afflicting the country was unmistakable, according to George W. Bush. “America is addicted to oil,” the president observed in his 2006 State of the Union address. This wasn’t just an observation. It was a call to arms. If the U.S. failed to wean itself off foreign oil, the consequences for the domestic economy and U.S. foreign policy would be grave. Doing so would require substantial investments in America’s ethanol industry as well as the development of oil deposits in pristine natural parks and off the nation’s shores.

In 2008, the U.S. produced an average of just 5 million barrels of oil per day—the nadir of domestic energy production since the exploitation of fossil fuels began in the late 19th century. By 2009, the price of West Texas Intermediate crude was approaching $150 per barrel. The U.S., therefore, was obliged to spend over $1 billion per day on oil imports from foreign countries, few of which could be considered models of good governance. America’s thirst for oil propped up abusive governments in places such as the Democratic Republic of Congo, Venezuela, Pakistan, Saudi Arabia, Algeria, Mauritania, and Syria.


REE mineral-bearing rocks found in eastern Mojave Desert

by Geological Society of America, January 2, 2020 in ScienceDaily


Scientists from the U.S. Geological Survey (USGS) have mapped a rare earth element deposit of magmatic carbonatite located in the Mountain Pass region of the eastern Mojave Desert. The new report details the geophysical and geological setting of the deposit, including a map of the deposit’s subsurface extent, to help land-use managers evaluate sites for further exploration. The report was recently published in the Geological Society of America’s online journal, Geosphere.

Rare earth elements (REEs) are critical to emerging industrial technologies including strategic defense, science and medical, automotive and transportation, and civilian electronics. However, large economic REE sources are unique and uncommon worldwide. International concerns about increasing demand and global supply vulnerability have prompted many countries, including the U.S., to explore and assess domestic REE resources. Increased efforts to characterize geologic processes related to REE deposits in the U.S. have focused attention on the world-class Mountain Pass, California, deposit located approximately 60 miles southwest of Las Vegas, Nevada.

In their study, collaborators K.M. Denton and USGS colleagues use geophysical and geological techniques to image geologic structures related to REE mineral-bearing rocks at depth. Their work suggests REE minerals occur along a fault zone or geologic contact near the eastern edge of the Mescal Range. These findings could prove as a useful guide to future exploration efforts.

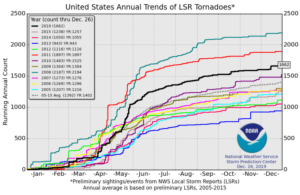
Another year, and still no increase in severe U.S. tornadoes

by P. Homewood, December 27, 2019 in WUWT


Climate scientists love to blame every bad weather event on global warming. Yet we never hear them cite climate change for the relative absence of bad weather!

One such example are tornadoes in the US, where we now have several decades of carefully collated data.

With the year near an end, we know that the number of tornadoes has been above average this year, though well below 2008 and 2011. Primarily this is due to several outbreaks in February and April:

https://www.spc.noaa.gov/wcm/#data

Energy Returned on Capital Invested: Ohio “Shale” vs Green “Schist”

by D. Middleton, December 2, 2019 in WUWT


Ohio’s shale energy industry attracts nearly $78 billion in investment since 2011
11/20/2019

COLUMBUS, OHIO – Total investment in Ohio’s resource rich shale energy sector has reached $78 billion since tracking began in 2011, according to a Cleveland State University (CSU) study.

Prepared for JobsOhio, the report represents the most recent data available and covers shale investment through the second half of 2018. Earlier in the year, IHS Markit released estimates that by 2040, the Utica and Marcellus shale region, of which Ohio is a significant part, will supply nearly half of all U.S. natural gas production.

The study from CSU’s Energy Policy Center at the Maxine Goodman Levin College of Urban Affairs, showed drilling investments were slightly down in the second half of 2018 compared to the first half, but total upstream investments were up. Total shale-related investment in Ohio for the second half of 2018, including upstream, midstream and downstream, was around $3.82 billion. Total investment from 2011-2018 totaled about $77.7 billion.

[…]

World Oil

Is coal power winning the US-China trade war?

by P.  Homewood, December 1, 2019 in NotaLotofPeopleKnowThat


China has signalled that coal power will be a top priority within national energy policy as the government prepares its next Five Year Plan (2021-25).

On 11 October, Premier Li Keqiang chaired a meeting of the National Energy Commission in Beijing that emphasised China’s energy security and coal utilisation and downplayed the importance of a rapid transition away from fossil fuels.

Each meeting of the commission, which was established in 2010 and has met only four times, has had a significant impact on policymaking. Chaired by Premier Li and attended by more than 20 chiefs of China’s ministries and bureaus, the commission is the top body for coordinating energy policy.

Why is energy security back at the top of the agenda?

Li told the conference: “The government should diversify energy supply to improve energy security… enhance domestic oil and gas exploration and development efforts, and promote oil and gas reserves and production, in order to improve oil and gas self-sufficiency”.

The renewed focus on energy security comes amid an increase in domestic consumption of oil and gas, which is largely being met through imports. China’s dependence on energy imports rose from 9% in 2014 to more than 20% in 2018.

China’s domestic crude oil production has declined and efforts to tap unconventional sources of natural gas, such as shale gas and coalbed methane, have faltered.

Other causes for concern lie outside China. The ongoing trade dispute with the US is a threat to the energy trade between the two superpowers, and supplies from the Middle East are at risk from mounting instability in the region.

SAN FRANCISCO TIES 1896 RECORD FOR COLDEST NOVEMBER DAY EVER!

by Cap Allon, November 30, 2019 in Electroverse


The mercury in San Francisco reached a high of just 8.8C (48F) on Thursday, November 28, tying the 1896 (solar minimum of cycle 12) record for the city’s lowest-max temp ever recorded in November.


And San Francisco wasn’t alone in dealing with below-average temperatures late last week. According to the National Weather Service, much of the interior North Bay suffered sub-zero readings overnight Thursday:

Novato Airport recorded a nipple-hardening -5C (23F).

Santa Rosa and Napa County Airport dipped to -3.3C (26F).

Sonoma Airport bottomed out at -2.8C (27F).

While temps touched freezing point at Livermore Airport.

2.8C (37F) at Oakland Airport and San Jose.

And 5C (41F) in San Francisco.

(Readings all highly unusual for the time of year).


New Report Says Fracking Saved Americans $1.1 Trillion Over Past Decade

by A. Watts, November 21, 2019 in WUWT


Research & Commentary by Tim Benson

A new report prepared by Kleinhenz & Associates for the Ohio Oil and Gas Energy Education Program shows increased oil and natural gas production from hydraulic fracturing  (“fracking”) has saved American consumers $1.1 trillion in the decade from 2008 to 2018. This breaks down to more than $900 in annual savings to each American family, or $9,000 in cumulative savings. Continuer la lecture de New Report Says Fracking Saved Americans $1.1 Trillion Over Past Decade

The Fossil Fuel Dilemma

by David L. Debertin, November 9, 2019 in WUWT


California again easily could become one of the top three fossil fuel producing states in the nation, but the largely liberal state has made drilling for fossil fuels within the state very difficult if not impossible. So the drillers have wisely looked elsewhere for locations that pose less of a political burden. North Dakota and its leaders welcomed the drillers. The result is tax dollars flowing into the state treasury from a variety of oil-related taxes levied not only on the drillers, but on individuals receiving mineral royalty income. In the past dozen years or so this has meant that taxpayers outside the oil producing counties have seen state-level taxes drop and the state can pursue projects that benefit the residents in a host of different ways simply by using funds that would not have been available had the drilling not occurred.

The new revenue coming into New Mexico as a result of recent oil drilling on the New Mexico side of the Permian basin via fracked oil wells is a more recent phenomena, only about 3-years old. The dilemma is that New Mexico has long been left-leaning politically whereas North Dakota has been a right-leaning state. Left-leaning politicians when they hear about new state revenue from an unexpected source generally think about new government program benefiting certain favored groups (maybe the younger voters who tend to favor left-leaning politicians) rather than lowering other taxes (sales, income) that would benefit a broader base of residents both young and old. Hence, we have the New Mexico idea of offering free college tuition to the state’s residents using oil-related tax revenue.

A STAGGERING 1,204 U.S. SITES RECORDED THEIR COLDEST-EVER OCTOBER TEMPERATURES LAST MONTH

by Cap Allon, November 4, 2019 in Electroverse


According to official NOAA data, more than twelve-hundred monthly low temperature records fell ACROSS the U.S. in October 2019 — multiple Arctic air masses rode anomalously-far south on the back of a wavy jet stream flow, itself associated with historically low solar activity.

The sun is currently in its deepest solar minimum of the past 100+ years, and the jet stream has weakened as a result; its usual tight ‘zonal’ flow has more-often-than-not reverted to a loose ‘meridional’ one. This wavy flow has diverted brutal Arctic air into the lower-latitudes, and is responsible for the U.S. either busting or tying a staggering 1204 all-time MONTHLY low temperature records in October 2019 (double the number of new heat records).


See also here and  here


Halloween Surprise: 96-Year-Old Record Snowfall In Chicago, Across U.S.

by K. Rodriguez, November 1, 2019 in ClimateChangeDispatch


A storm that made many areas of the Midwest feel more like winter than fall shattered a 96-year-old winter weather record in Chicago.

The historic storm system— which brought snow and cold over the Colorado Rockies this week— made it to the Midwest on Thursday morning, unleashing moderate-to-heavy snowfall in northeastern Kansas, eastern Iowa, Illinois, and southern Wisconsin.

The total accumulation expected in these areas is 3 to 5 inches of snow.

Chicago experienced its earliest snow day of the year where an inch or more of snow fell since October 20, 1989, and smashed its previous record of 0.7 inches at Chicago O’Hare International Airport on Wednesday with a whopping 1.2 inches of snow.

COLORADO: HEAVY SNOW BREAKS A 102-YEAR-OLD RECORD IN PUEBLO — CANCELS/DELAYS 800+ FLIGHTS AT DENVER INTERNATIONAL AIRPORT

by Cap Allon, Oct 30, 2019 in Electroverse


The Centennial State has seen a myriad of all-time cold records tumble this fall, and this week is continuing that trend towards cooler climes.

The 3.8 inches (9.7 cm) of snow that accumulated in Pueblo on Monday, October 28 comfortably eclipsed the city’s previous record for the date — the 2.9 inches (7.4 cm) from back in 1917. It also adds to the early-season inches already received during the first week of October.

For reference, Pueblo’s mean date for first measurable snowfall isn’t until Nov 6, according to weather.gov.

And yet more powder is forecast for the city on Wednesday, meaning this year will likely win third spot for snowiest October on record, surpassing the 8.2 inches (20.8 cm) that accumulated in October 1997(solar minimum of cycle 22).


Denver Weather: Another Record Broken As Temperatures Plunge To Near Zero

by Ashton Altieri, Oct 30, 2019 in 4CBSDenver


DENVER (CBS4) – The temperature in Denver officially dropped to 3 degrees above zero early Wednesday morning. It was cold enough to shatter the previous record low for October 30 by 4 degrees. It was our third record temperature in 3 days and one more record is expected Thursday morning.

One final record is expected Thursday morning when the combination of clear skies, mainly light winds, and snow on the ground allows temperatures to plunge below zero along the Front Range. If the temperature manages to drop below -2° early Thursday, the all-time record low for October in Denver will be broken.  That record was set on October 29, 1917.

Mother Nature, Not Global Warming, Behind The California Wildfires

by Chris Martz, Oct 30, 2019 in ClimateChangeDispatch


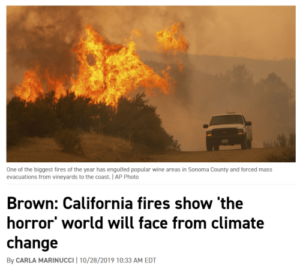
Articles, like the one from Politico above (Figure 1)¹, have been popping up left and right claiming that climate change is causing the wildfires.

Endless amounts of disinformation are being spread around on Twitter and Facebook from well-known media outlets, public figures, government officials, and even a handful of well-known scientists.

There’s no doubt that the dozen or more wildfires that have broken out in the state, including the Getty and Kincade fires, are serious.

Firefighters are doing their best to try and contain these fires before any more serious damage occurs. But, playing the blame game on climate change does nothing for public safety whatsoever.

What’s really to blame for these fires?

The Kincade Fire, in particular, was caused by a broken jumper wire of the Pacific Gas & Electric company(PG&E), though “mother nature,” as you will find out below, has enhanced the fire and others that have since broken out across the state.

October through March is the prime time of the year for wildfires to break out in the Western United States (Raphael, 2003).²

This is largely because atmospheric and surface conditions tend to be very favorable in the region for fire weather; that is a.) dry soil and vegetation, b.) low relative humidity, c.) warm temperatures, and d.) strong winds.³

See also here and here

USGS: Marcellus/Utica Natural Gas Resource Has Nearly Doubled Since 2012

by David Middleton, October 8, 2019 in WUWT


I had the good fortune of working with Jim Reilly at Enserch Exploration back in the 1980’s and early 1990’s… Before he became a NASA astronaut and then Director of the USGS.

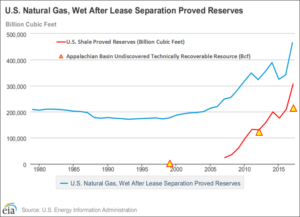
“Shale” comprises more than 60% of current U.S. proved natural gas reserves… The Marcellus/Utica comprise about 50% of “shale” proved reserves… And the undiscovered technically recoverable resource potential of the Marcellus/Utica is now larger than the proved reserves and nearly as large (70%) as the current proved reserves of all “shale” plays….

Figure 2. “The effects American ingenuity and new technology can have.”…
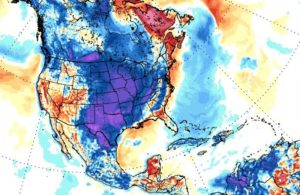
RECORDS CONTINUE TO FALL ACROSS THE NW + MORE HISTORIC COLD SET TO ENGULF ALL OF NORTH AMERICA BY OCT 10

by Cap Allon, October 3, 2019 in Electroverse


This weekend will mark the final phase of a major winter storm that ravaged the NW U.S. bringing whipping winds to the Flathead Valley, feet of snow along the Continental Divide and record-breaking/challenging temps for all.

A new all-time daily record low temperature was set in Kalispell, Montana on Wednesday, October 02 as the mercury plunged into the teens across the region.

The weather station at Glacier Park International Airport recorded a low of 19F (-7.2C) at 5 AM which busted the dates previous record low of 21F (-6.1C) set back in 1999.

Great Falls, Montana registered a record-smashing 9F (-12.8C) on Tue, Oct 01, according to the NWS, which annihilated the previous daily low of 22F (-5.6C) set back in 1959.

Additionally, areas to the northwest also saw record low daily temperatures on Tuesday as both Cut Bank and Browning comfortably surpassed their previous cold records from 1950.

And further south, crossing a few state lines into California, temperatures at Sacramento Executive Airport dropped to 42F (5.6C) early Wednesday morning, surpassing the old record of 43F (6.1C) set in 1971. Meaning that in less than a week, Sacramento has now set multiple all-time record lows; on Sunday, both downtown Sacramento and the airport set record lows of 45F (7.2C) and 46F (7.8C) respectively.

Nearly Half Of 53 Tidal Gauges Show Negative Sea-Level Rise

by K. Richard, Sep. 10, 2010 in ClimateChangeDispatch


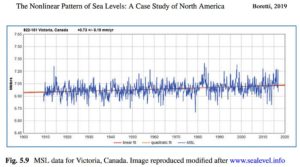
The West Coast of North America has 20 long-term (90+ years) tide gauges measuring relative sea-level changes.

The East Coast has 33. Of the 53 total tide gauges, 45% (24) are negatively accelerating, 14 document falling sea levels, and just 11 have sea levels rising more than 3 mm/yr.

mage Source: Boretti, 2019

A cooling/non-warming North America

A few months ago, Gan et al. (2019) reported that the North American continent as a whole (180-0°, 15-60°N) “is one of the major cooling centers” in the Northern Hemisphere, with temperatures dropping after 1998 and no significant net change since the early 1980s apparent.

The Gestalt of Heat Waves

by Clyde Spencer, Sep. 6, 2019 in WUWT


Abstract

Tmax and Tmin time-series are examined to look for historical, empirical evidence to support the claim that heat waves will become more frequent, of longer duration, and with higher temperatures than in the past. The two primary parameters examined are the coefficient of variation and the difference between Tmax and Tmin. There have been periods in the past when heat waves were more common. However, for nearly the last 30 years, there has been a reversal of the correlation of increasing CO2 concentration with the Tmax coefficient of variation. The reversal in differences in Tmax and Tmin indicate something notable happened around 1990.

Introduction

There was much in the press this Summer about the ‘global’ heat waves, particularly in France and Greenland. For an example of some of the pronouncements, see here. The predictions are that we should expect to see heat waves that are more frequent and more severe because of Anthropogenic Global Warming, now more commonly called “Climate Change.” The basis for the claim is unvalidated Global Climate Models, which are generally accepted to be running to warm. The simplistic rationale is that as the nights cool less, it takes less heating the next day to reach unusually high temperatures. Unfortunately, were that true, that would lead one to conclude that heat waves should never stop.

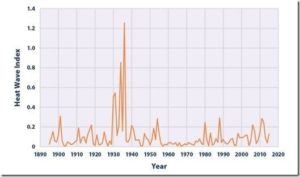
Fig. 1. U.S. Annual Heat Wave Index, 1895-2015

https://www.epa.gov/climate-indicators/climate-change-indicators-high-and-low-temperatures

If the predictions of worse future heat waves were valid, one might expect to be able to discern a change occurring already, inasmuch as it is commonly accepted that Earth has been warming at least since the beginning of the Industrial Revolution

Hurricane Camille Remembered

by P. Homewood, August 19, 2019 in NotaLotofPeopoleKnowThat


This month marks the 50th anniversary of Hurricane Camille, the second most powerful to git the US coast. The strongest was the Labor Day Hurricane of 1935.

The NWS has issued this press release:


Hurricane Camille
August 17, 1969

Late in the evening on August 17 in 1969, Hurricane Camille made landfall along the Mississippi Gulf Coast near Waveland, MS. Camille is one of only FOUR Category 5 hurricanes ever to make landfall in the continental United States (Atlantic Basin) – the others being the 1935 Labor Day Hurricane, which impacted the Florida Keys; Hurricane Andrew in 1992, which impacted south Florida; and Hurricane Michael in 2018, which impacted the Florida panhandle. (Note: It is worth mentioning that the 1928 San Felipe Hurricane made landfall as a Category 5 Hurricane on Puerto Rico)

Camille ranks as the 2nd most intense hurricane to strike the continental US with 900 mb pressure and landfall intensity of 150 knots. Camille ranks just below the 1935 Labor Day Hurricane with 892 mb and 160 knots, while slightly stronger than Hurricane Andrew with 922 mb and 145 knots and Hurricane Michael with 919 mb and 140 knots. The actual maximum sustained winds of Hurricane Camille are not known as the hurricane destroyed all the wind-recording instruments in the landfall area. Re-analysis data found peak winds of 150 knots (roughly 175 mph) along the coast. A devastating storm tide of 24.6 feet occurred west of our area in Pass Christian, MS.

AccuWeather Founder/CEO: No Evidence Heatwaves More Common From ‘Climate Change’

by Dr. J. N. Myers, Auhsut 8, 2019 in ClimateChangeDispatch


First, and most importantly, we warn people all the time in plain language on our apps and on AccuWeather.com about the dangers of extreme heat, as well as all hazards.

Furthermore, that is the reason we developed and patented the AccuWeather RealFeel® Temperature and our recently expanded AccuWeather RealFeel® Temperature Guide, to help people maximize their health, safety and comfort when outdoors and prepare and protect themselves from weather extremes.

The AccuWeather RealFeel Temperature Guide is the only tool that properly takes into account all atmospheric conditions and translates them into actionable behavior choices for people.

Second, although average temperatures have been higher in recent years, there is no evidence so far that extreme heatwaves are becoming more common because of climate change, especially when you consider how many heatwaves occurred historically compared to recent history.

New York City has not had a daily high temperature above 100 degrees since 2012, and it has had only five such days since 2002.

However, in a previous 18-year span from 1984 through 2001, New York City had nine days at 100 degrees or higher.