Negative CO2 Emissions

by Kevin Kilty, January 24, 2020 in WUWT


An article in the January 2020 Issue of Physics Today (1) presents an interesting and very readable overview of methods to capture and store away CO2 emissions. The purpose of this guest blog is to summarize a few key points the paper makes, and add some commentary. WUWT has covered some of this same territory recently here and here.

Motivation

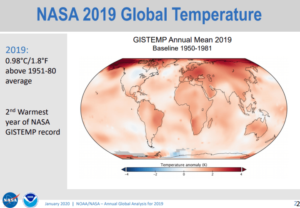
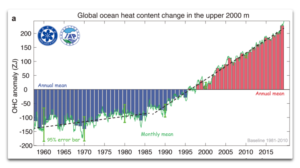
Of course, the motivation for negative emissions technologies (NETs), or CO2 capture, is to bring atmospheric CO2 back to safe levels. Although the article fails to mention what safe means in this context, and what levels are unsafe, it alludes to melting polar ice and methane escaping from melting permafrost as consequences of unsafe climate. Nothing unusual here. Despite relegating its case for an unsafe future to such enterprises as the IPCC, the article does provide some insight into the cause of what seems to be the current “crisis” mentality. It is 1.5°C temperature rise goal of the 2015 Paris agreement. As readers of WUWT already know, this is not a 1.5°C increase from now, but rather from an estimated pre-industrial level — meaning that two-thirds of that margin is already gone and we have but 0.5°C left to work with. I suspect most people do not understand this subtle point.

Eventually the article makes a brief excursion into more phenomena by which climate change would become unsafe — forest fires, droughts, and sea level rise. All of this is also familiar to WUWT readers.


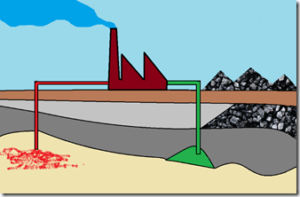
Technologies Involved

Why The Current Interglacial Might Be Coming To An End

by W. Jones, January 22, 2020 in ClimateChangeDispatch


Did you know that over the last 450,000 years there have been four Ice Ages lasting around 100,000 years each?

And five interglacial periods lasting around 12,000 years each?

Look at this graph of temperature data derived from the Vostok ice core from Antarctica.


What it means is that for around 90 percent of the last 450,000 years Earth has been in an Ice Age, where global temperatures have slumped to as low as 10 deg C colder than in the relatively brief interglacial periods.

The current interglacial period (the fifth) began about 11,600 years ago, suggesting it may not last much longer. It corresponds to the time when human beings began farming and building cities and civilizations.

It is notably cooler than the previous four interglacial periods. If we ‘zoom in’ on it (see the upper graph, below)

Des réchauffements répétitifs sans CO2 ?

by P. Berth & A. Préat, 24 janvier 2020 in ScienceClimatEnergie


Depuis le début des mesures thermométriques directes, les 4 principales séries de température  que nous possédons (thermomètres terrestres et satellites) nous montrent que la température globale de la basse troposphère a augmenté de ± 0,8°C en 138 ans (entre 1880 et 2018). Cela correspond à ± 0,28°C en 50 ans soit 0,006°C/an(actuellement environ 0,01°C/an pour les 30 dernières années). Les médias nous rappellent chaque jour que cette hausse est exceptionnelle et que le CO2 anthropique en est à l’origine, c’est-à-dire est le grand coupable suivant la terminologie consacrée.

Mais cette vitesse d’augmentation de la température, est-elle vraiment exceptionnelle? Dans les lignes qui suivent, nous allons vous démontrer qu’il n’en est rien. Au cours de la dernière période glaciaire, alors que l’espèce humaine existait déjà, la température moyenne a parfois augmenté à une vitesse vingt fois plus élevée, et ce à de nombreuses reprises. Ces phénomènes particuliers, qui n’ont pas fait disparaître la vie sur Terre, et que nous vous avions déjà mentionnés sur SCE (ici), sont appelés évènements de Dansgaard-Oeschger ou ‘DO’ (des noms des deux scientifiques -danois et suisse-  qui furent les premiers à les mettre en évidence) et sont reconnus par le GIEC. Comme nous allons vous le montrer dans le présent article, le taux de CO2 n’aurait qu’un rôle mineur dans ces évènements.

Figure 1. Stratigraphie isotopique de l’oxygène à partir des glaces du forage GRIP (Groenland).
En ordonnée valeurs du δ
18O en ‰ et en abscisse profondeur en mètres du forage (Cronin, 2010). Les compositions isotopiques de l’oxygène sont un indicateur de la température. La figure montre de manière très claire que l’interglaciaire actuel (Holocène, moitié gauche du graphique) est caractérisé par des fluctuations thermiques de faible amplitude (si l’on excepté un épisode plus froid vers 8,2 ka) alors que le Dernier Glaciaire (moitié droite du graphique) montre des changements climatiques fréquents, rapides et de grandes amplitudes (de 8°C à 16°C suivant les δ18O) enregistrés pas les événements ou ‘cycles’ DO (Dansgaard-Oeschger events). Nb: YD pour Younger Dryas, correspondant à un refroidissement il y a 12800 ans BP (non discuté dans cet article).


Extreme Arctic melting has a new suspect: The same powerful gases screwing over the ozone

by B.L. Beckman, January 21, 2020 in Mashable/Nature


They were once abundant, in our hairsprays, bug sprays, and refrigerators. And then scientists figured out these substances ripped a hole in the ozone layer, leading to a 1987 plan to phase them out that over time would be agreed to by every country in the world.

More than three decades later, researchers have made a new discovery.

Ozone-depleting substances do more than just gnaw at Earth’s protective layer. They’re also greenhouse gases, so they contribute to the planet’s overall warming by trapping heat, too. And now we may know just how much these substances have contributed to Arctic warming, thanks to a study published in the science journal Nature on Monday.

Between 1955 and 2005, ozone-depleting gases caused half of Arctic climate change (and a third of overall global warming), the study finds. This is primarily due to their heat-trapping qualities, not their ozone munching. The Arctic has seen rapidly melting sea ice for years and is warming faster than the rest of the world.

HISTORICAL DATA DESTROYS THE GLOBAL WARMING MYTH, AND PEOPLE ARE WAKING TO IT…

by Cap Allon, January 22, 2020 in Electroverse


According to NOAA’s own historical data, of the 50 U.S. state all-time record high temperatures, 23 were set during the 1930s, while 36 occurred prior to 1960 — climate change proponents are feeding us a fairy tale, and I’m sick of it…

The maniacal sociopaths of the world may have won control of the narrative, but they seemingly have little sway over the will of the people. You need only browse the comment section below any “climate change” article or social media post to see the wave of folks resoundingly rejecting the scam-of-a-world-view assembled before them (one of the few positives of SM).

The man-made global warming rejection is likely down to two things: the first being that the so called “scientific consensus” has been failing for far too long — you can’t start warning people in the 1980s that we have 10 years left to save the planet, only to keep repeating that prophecy for the next 4 decades. This is probably the reason our youth have become the new target — kids don’t have this history of failure to draw-upon when browsing the bullet points of the latest IPCC report -for example- meaning they’re far easier to manipulate.


Learning The Lessons From The Waroona Bushfires

by P. Homewood, January 22, 2020 in NotaLotofPeopleKnowThat


It has surely now been established beyond any possible doubt the major role that poor fire hazard management has played in the severity of recent Australian bushfires, despite disinformation campaigns from the BBC/Guardian/Met Office.

Back in 2016, a Special Inquiry was held following the catastrophic Waroona bushfire, just south of Perth that year. Their report not only reemphasised the crucial role of controlled burning, but also gives an insight into the evolution of such practices in recent decades:

Below is the key segment of the report. [The data relates to Western Australia, and P&W refers to the Department of Parks and Wildlife].

North Atlantic Sea Levels Have Been Falling At A Rate Of 7.1 mm/yr Since 2004…In Tandem With 2°C Cooling

by K. Richard/Chafik et al. 2019, January 20, 2020 in NoTricksZone


Rapid cooling in the North Atlantic has reversed regional sea level changes and has apparently spread to the Greenland ice sheet

Image Source: Chafik et al. (2019)

Despite stressing global sea level rise is worrisome and due to anthropogenic warming, Chafik et al. (2019) report a distinct cooling trend in the North Atlantic that coincides with a transition to falling regional sea levels since 2004.

Doomsday Climate Predictions: Wrong Then, Wrong Now

by CFACT, January 20, 2020, in ClimateChangeDispatch


How many doomsday predictions about the Earth’s climate must fail before they finally get broadly ignored and dismissed out of hand?

Considering the track record of climate predictions that turned out to be false, we are well passed the moment of ridicule.

The latest climate prediction fiasco, about glaciers disappearing in Glacier National Park by 2020, is the latest reminder of the falsity of the man-made global warming movement.  It’s 2020; the glaciers remain.

Predictions of climate catastrophe drone on, and get more hysterical, including many from the same people whose credibility was destroyed long ago.

Yet, the climate alarmists remain undaunted and impervious to embarrassment.

Instead, they simply move the goalposts by predicting more planetary weather Armageddon in the future and proposing more insanely expensive solutions to “address” it (notice they rarely promise to reverse assumed man-made warming).

It is not just actors like Ted Danson or Jane Fonda who make absurd climate predictions, but scientists, government bureaucrats and especially politicians continue this longstanding racket.

In the years leading up to the first “Earth Day” in 1970, there were so many climate predictions that ended up being laughably wrong, it’s hard to pick favorites.

Stanford University biologist, Paul Ehrlich, author of The Population Bomb, is perhaps the best-known alarmist of that period.


Continuer la lecture de Doomsday Climate Predictions: Wrong Then, Wrong Now

2019 Science Refutes Climate Alarm On Every Front… Shrinking Deserts, Growing Islands, Crumbling Consensus, Weaker Storms, Cooler Arctic Etc. Etc. Etc.

by P. Gosselin, December 31, 2019 in NoTricksZone


2019 science: Absolutely no climate alarm 

No alarm on every aspect: stable polar ice, normal sea level rise, no consensus, growing snow cover, less tropical storms, tornadoes, shrinking deserts, global greening, predictions wrong, models flawed, climate driven by sun, ocean cycles, biodiversity, warmer 1000 years ago…etc…


2019 saw a great amount of new science emerge showing that there’s nothing alarming or catastrophic about our climate. 

Some 2019 scientific findings

Need to make a presentation showing there is no climate alarm? The following findings we reported on in 2019 will put many concerns to rest.

Hundreds of peer-reviewed papers ignored by media

What follows are some selected top science-based posts we published here at NoTricksZone in 2019. These new findings show there is absolutely no climate alarm.

Hundreds of new peer-reviewed papers, charts, findings, etc – which the IPCC, activists and media ignore and even conceal. No wonder they’ve gotten so shrill.


‘Melting rock’ models predict mechanical origins of earthquakes

by Duke University, January 17, 2019 in ScienceDaily/Nature


Engineers at Duke University have devised a model that can predict the early mechanical behaviors and origins of an earthquake in multiple types of rock. The model provides new insights into unobservable phenomena that take place miles beneath the Earth’s surface under incredible pressures and temperatures, and could help researchers better predict earthquakes — or even, at least theoretically, attempt to stop them.

The results appear online on January 17 in the journal Nature Communications.

“Earthquakes originate along fault lines deep underground where extreme conditions can cause chemical reactions and phase transitions that affect the friction between rocks as they move against one another,” said Hadrien Rattez, a research scientist in civil and environmental engineering at Duke. “Our model is the first that can accurately reproduce how the amount of friction decreases as the speed of the rock slippage increases and all of these mechanical phenomena are unleashed.”

For three decades, researchers have built machines to simulate the conditions of a fault by pushing and twisting two discs of rock against one another. These experiments can reach pressures of up to 1450 pounds per square inch and speeds of one meter per second, which is the fastest underground rocks can travel. For a geological reference point, the Pacific tectonic plate moves at about 0.00000000073 meters per second.

Hadrien Rattez, Manolis Veveakis. Weak phases production and heat generation control fault friction during seismic slip. Nature Communications, 2020; 11 (1) DOI: 10.1038/s41467-019-14252-

Comprehensive Data, Recent Studies In Top Journals: Antarctica Stable, Temps Falling, Ice Mass Growing!

by P. Gosselin, January 14, 2020 in NoTricksZone


The ice in Antarctica, how is it doing? Is it melting, is it growing? In the following we wishto present the latest literature on the subject. There is a lot to report.

Fasten your seat belt, there’s a lot to cover.

Let’s start with the temperature development because along with snowfall, this is the most important control factor for Antarctic inland ice.

At NoTricksZone, Kirye shows ten coastal stations of Antarctica. None have been warming over the past 10 years. An example follows:


And here’s the temperature development of the entire Antarctic according to UAH and RSS satellite measurements (from Climate4You, via NoTricksZone):

NASA: 2020 Will Mark the Lowest Solar Activity in 200 Years

by James Murphy, January 16, 2020 in NewAmerican


With all of the pseudo-scientific propaganda being peddled about anthropogenic climate change, people sometimes forget that there are other, far more important drivers of the Earth’s climate than mankind’s carbon dioxide emissions. For example, that big ball of yellow light in the sky (aka the sun) has a huge effect on climate. And according to NASA, this year will mark the lowest level of solar activity in 200 years.

“Research now underway may have found a reliable new method to predict this solar activity. The Sun’s activity rises and falls in an 11-year cycle. The forecast for the next solar cycle says it will be the weakest of the last 200 years. The maximum of this next cycle — measured in terms of sunspot number, a standard measure of solar activity level — could be 30-50 percent lower than the most recent one. The results show that the next cycle will start in 2020 and reach its maximum in 2025.”

According to a growing number of scientists, the coming lower solar cycle — number 25 — may simply be a precursor to a period of prolonged solar minima such as the Maunder and Spörer minimums of the past millennium.


Major Greenland Glacier Is Growing

by NASA (Earth Observatory), June 6, 2019 in NASA.E.Observ.


Jakobshavn Glacier in western Greenland is notorious for being the world’s fastest-moving glacier. It is also one of the most active, discharging a tremendous amount of ice from the Greenland Ice Sheet into Ilulissat Icefjord and adjacent Disko Bay—with implications for sea level rise. The image above, acquired on June 6, 2019, by the Operational Land Imager (OLI) on Landsat 8, shows a natural-color view of the glacier.

Jakobshavn has spent decades in retreat—that is, until scientists observed an unexpected advance between 2016 and 2017. In addition to growing toward the ocean, the glacier was found to be slowing and thickening. New data collected in March 2019 confirm that the glacier has grown for the third year in a row, and scientists attribute the change to cool ocean waters.

“The third straight year of thickening of Greenland’s biggest glacier supports our conclusion that the ocean is the culprit,” said Josh Willis, an ocean scientist at NASA’s Jet Propulsion Laboratory and principal investigator of the Oceans Melting Greenland (OMG) mission

Gavin’s Falsifiable Science

by Willis Eschenbach, January 18, 2020 in WUWT


Folks are interested in why the temperature of the planet changes over time. That’s at the center of modern climate science. My theory, on the other hand, arose from my being interested in a totally different question about climate—why is the temperature so stable? For example, over the 20th Century, the temperature only varied by ± 0.3°C. In the giant heat engine that is the climate, which is constantly using solar energy to circulate the oceans and the atmosphere, this is a variation of 0.1% … as someone who has dealt with a variety of heat engines, I can tell you that this is amazing stability. The system is ruled by nothing more solid than waves, wind, and water. So my question wasn’t why the climate changes as it does.

My question was, why is the climate so stable?

And my answer is, there are a host of what are called “emergent phenomena” that arise when local temperatures go above some local threshold. They include the timing and strength of the daily emergence of the cumulus cloud field in the tropics; the development of thunderstorms; the emergence of dust devils when temperatures get hot; the action of the El Nino/La Nina pump moving warm water to the poles; and various “oscillations” like the Pacific Decadal Oscillation.

These emergent phenomena arise out of nowhere, last for some length of time, and then disappear completely. And acting together, they all work to prevent both the overcooling and the overheating of the planet. And as mentioned above, I say that these phenomena acted to reduce the length and the depth of the effect of the Pinatubo volcano. See my post called “When Eruptions Don’t” for another look at how the climate system responds to a decrease in incoming solar energy due to volcanic eruptions.


I originally published this theory in the journal Energy and Environment. I followed that up with a posting of the same ideas here at Watts Up With That in a post called The Thermostat Hypothesis.

Figure 2. Global stratospheric temperatures measured from space.

CHILLING 1200-YEAR-OLD VIKING STONE WARNS OF FUTURE LITTLE ICE AGES

by Cap Allon, January 18, 2020 in Electroverse


A secret code unsolved for 1200 years has finally been cracked — the mysterious inscription on famed Viking relic the Rök stone (or Rökstenen) reveals the warrior nation feared the return of the deadly ‘Late Antique Little Ice Age’ which wiped out more than HALF of Scandinavia — the stone speaks of an enduring battle against extreme cold weather in the sixth century.

According to a study led by Per Holmberg, a professor of Swedish language at the University of Gothenburg, the text is telling a tale of light and darkness, warmth and cold, and it expresses a deep fear of a coming climate disaster.

“The main theme is apparently the Sun, or the rhythm of light”, Holmberg explained.

Of the nine riddles contained on the stone, five of them have the answer “the Sun.”


The stone was erected in the late 800s near the lake Vattern in south central Sweden.

New 80-Year Deep-Ocean Temperature Dataset Compared to a 1D Climate Model

by Roy Spencer, January 15, 2020 in WUWT/Ch.Rotter


The increasing global ocean heat content (OHC) is often pointed to as the most quantitative way to monitor long-term changes in the global energy balance, which is believed to have been altered by anthropogenic greenhouse gas emissions. The challenge is that long-term temperature changes in the ocean below the top hundred meters or so become exceedingly small and difficult to measure. The newer network of Argo floats since the early 2000s has improved global coverage dramatically.

A new Cheng et al. (2020) paper describing record warm ocean temperatures in 2019 has been discussed by Willis Eschenbach who correctly reminds us that such “record setting” changes in the 0-2000 m ocean heat content (reported in Zettajoules, which is 10^^21 Joules) amount to exceedingly small temperature changes. I calculate from their data that 2019 was only 0.004 0.009 deg. C warmer than 2018.

Over the years I have frequently pointed out that the global energy imbalance (less than 1 W/m2) corresponding to such small rates of warming is much smaller than the accuracy with which we know the natural energy flows (1 part in 300 or so), which means Mother Nature could be responsible for the warming and we wouldn’t even know it.

The Cheng (2017) dataset of 0-2000m ocean heat content changes extends the OHC record back to 1940 (with little global coverage) and now up through 2019. The methodology of that dataset uses optimum interpolation techniques to intelligently extend the geographic coverage of limited data. I’m not going to critique that methodology here, and I agree with those who argue creating data where it does not exist is not the same as having real data. Instead I want to answer the question:

If we take the 1940-2019 global OHC data (as well as observed sea surface temperature data) at face value, and assume all of the warming trend was human-caused, what does it imply regarding equilibrium climate sensitivity (ECS)?

Fig. 1. Deep-ocean temperature variations 1940-2019 explained with a 2-layer energy budget model forced with RCP6 radiative forcing scenario and a model climate sensitivity of 1.85 deg. C. The model also matches the 1940-2019 and 1979-2019 observed sea surface temperature trends to about 0.01 C/decade. If ENSO effects are not included in the model, the ECS is reduced to 1.7 deg. C.

19 Papers Published In 2019 Affirm Sea Levels Were METERS Higher Than Today 4-8 Thousand Years Ago

by K. Richard, January 16, 2020 in NoTricksZone


The onslaught of paleoclimate evidence for warmer-than-now Mid-Holocene climates – when the Earth’s sea levels were meters higher than they are today –  stormed through 2019.

There were 107 scientific papers published this past year indicating today’s warmth isn’t even close to being unusual or unprecedented when compared to the climates of the last centuries to millennia.

As illustrated below, there were also 19 papers affirming today’s sea levels are among the lowest of the last ~8000 years.

This is added to the list of nearly 100 scientific papers published in the last handful of years indicating Mid-Holocene sea levels were multiple meters higher than they are today due to the much more extensive glacier and ice sheet melt occuring during these millennia.

Throwing More Cold Water On An Alarmist Ocean-Warming Paper

by Dr. D. Whitehouse, January 17, 2020 in ClimateChangeDispatch


It’s the usual story. It’s the beginning of the year and the statistics of the previous year are hurriedly collected to tell the story of the ongoing climate crisis.

First off, we have the oceans which, according to some, are living up to the apocalyptic narrative better than the atmosphere.

The atmosphere is complicated, subjected to natural variabilities, that make the temperature increase open to too much interpretation.

The oceans, however, are far more important than the air as they absorb most of the anthropogenic excess heat.

Looking at the literature reveals no one knows just how much excess heat (created in the atmosphere) it mops up or indeed exactly how or where it does it. Some say it is 60% which is a bit on the low side, most say 90% or 93%.

The real figure is unknown though it should be noted that a few percent errors translate to a lot of energy, about the same amount that is causing all the concern.

On 14 January the Guardian had the headline, “Ocean temperatures hit record high as the rate of heating accelerates.” The study that reached this conclusion was published in the journal Advances in Atmospheric Sciences.

It’s a badly written paper full of self-justifying statements and unwarranted assumptions that should have been stripped-out by the editor.


Also : Ocean Warming: Not As Simple As Headlines Say

Les Feux en Australie : la réalité des faits et rien d’autre…

by Yannick Colleu, 17 janvier 2020 in ScienceClimatEnergie


Les feux de brousse en Australie font la une des journaux écrits et audiovisuels. Ces annonces sont reprises par les réseaux sociaux.
La vérité médiatique est maintenant bien établie, ces feux sont l’œuvre du dérèglement climatique. Ces catastrophes humaine et écologique présagent, selon les réseaux dits sociaux, la fin du Monde annoncée par les « experts » du GIEC.

A ma connaissance pas un seul journaliste ne semble s’être penché sur le sujet. Du moins aucune autre conclusion, quant aux causes de cette catastrophe, n’a été, à ma connaissance, publiée sinon pour pointer le changement climatique comme seul et unique coupable.

Pourtant la réponse est moins évidente.

Il est de notoriété publique que l’Australie est un pays coutumier des sécheresses et des températures extrêmes. En outre c’est un pays quasi désertique de 7,7 millions de km² peuplé d’à peine 25 millions d’habitants principalement implantés dans les grandes villes de la côte Est et dans la principale métropole de l’Ouest.

Après les gigantesques feux de brousse de janvier à mars 1961 en Australie occidentale les réflexions sur les actions de prévention conduisaient à préconiser l’usage de feux déclenchés/contrôlés pour maîtriser la végétation à l’approche de la saison sèche. Cette technique permet en effet de créer des coupe-feux et de limiter la matière inflammable qui nourrit les brasiers.

Cette politique préventive a longtemps porté ses fruits, réduisant considérablement les incendies et surtout leur propagation. Néanmoins les chantres de la lutte contre le réchauffement et le CO2 ont poussé le gouvernement australien à changer de politique il y a une dizaine d’années (par exemple ici et ici).

La politique actuelle ne privilégie plus l’anticipation du risque d’incendie mais préconise de laisser les incendies se propager et de ne défendre autant faire se peut que les habitations et les vies humaines.
De fait la végétation n’est plus façonnée par l’homme pour limiter les risques de propagation et celle-ci offre dès lors un combustible abondant au moindre foyer qui se développe.

Le graphique ci-dessous fournit par l’association Bushfire Front Inc (BFF) de l’État d’Australie occidentale révèle l’impact que cet abandon d’une politique de prévention sur les feux de brousse sur la période 1950-2017.

En vert : surface de feux déclenchés.
En rouge : surface de feux de brousse


Source : https://www.bushfirefront.org.au/prescribed-burning/why-prescribed-burning/
Légende : La zone d’incendie contrôlé (réduction de ‘carburant’) est indiquée en vert et la zone des feux de brousse (feux de forêt) en rouge. Les pics causés par désastreuse saison des incendies de 1961 et les grands feux de brousse de ces dernières années sont clairement visibles.

Breakthrough gives insight into early complex life on Earth

by H. Devlin, January 15, 2020 in TheGuardian


For the first 2 billion years, life on Earth comprised two microbial kingdoms – bacteria and archaea. They featured an innumerable and diverse variety of species, but, ultimately, life on Earth was not that exciting judged by today’s standards.

Then, the theory goes, a rogue archaeon gobbled up a bacterium to create an entirely new type of cell that would go on to form the basis of all complex life on Earth, from plants to humans.

Now, for the first time, scientists have succeeded in culturing an elusive species of archaea believed to be similar to the ancestor that gave rise to the first sophisticated cells, known as eukaryotes. The work has been described as a “monumental” advance that sheds new light on this evolutionary milestone.

Nick Lane, professor of evolutionary biochemistry at UCL, described the work as “magnificent”, while a commentary by two other experts in the field said it marked a “huge breakthrough for microbiology”.

Like bacteria, archaea continue to thrive on Earth today. But despite the pivotal role they are thought to have played in the emergence of complex life there has been relatively little research on them. Many species are found in inhospitable environments and are incredibly difficult to grow in the lab.

The Japanese team behind the latest advance has dedicated 12 years to the effort, overcoming a series of setbacks along the way.

The archaeon which was cultured and characterised from deep marine sediment. Photograph: Nature


While NOAA/NASA claims 2019 as the “second warmest year ever”, other data shows 2019 cooler than 2005 for USA.

by Anthony Watts, January 15, 2020 in WUWT


Today, at the big 100 year anniversary shindig of the American Meteorological Society (AMS) there was a press release session that featured NOAA and NASA GISS talking about how their climate data says that the world in 2019 was the second warmest ever.

Here is their slideshow presentation, released today: https://www.ncdc.noaa.gov/sotc/briefings/20200115.pdf

In my opinion, the NOAA/NASA press release (and slideshow) is inconsistently presented. For example, they can’t even agree on a common base period for comparisons. Some graphs use 1951-1980 while others compare to 1981-2010 averages to create anomaly plots. NOAA and NASA owe it to the public to present climate data with a consistent climate period for comparison, otherwise it’s just sloppy science. NASA GISS has consistently resisted updating the 1951-1980 NASA GISS baseline period to the one NOAA and other datasets use, which is 1981-2010. GISS stubbornly refuses to change even though they have been repeatedly excoriated for keeping it.

That 1951-1980 period just so happens to be the coolest period in the 20th century, so by using that as a baseline, the peak amount of warming anomaly is magnified in NASA GISS plots. Most laymen will never spot this. A simple comparison of the two maps show the difference in the peak values:


Transition énergétique : une régression sans précédent ?

par J.P. Bardinet, 16 janvier 2020 in Contrepoints


L ’éolien ne sert à rien et la politique gouvernementale, voulue par l’Union européenne, Emmanuel Macron et ses deux prédécesseurs, est néfaste pour notre pays.

Lors de son évolution, l’humanité a utilisé des énergies primaires avec des densités énergétiques de plus en plus fortes : bois, charbon, gaz, pétrole, uranium. La densité énergétique des énergies renouvelables (EnR), éolien et solaire, est très faible, ce qui est une régression sans précédent dans l’histoire de l’humanité.

Chiffres de production totale RTE 2018 : 548,6 TWh dont

  • nucléaire 71,7 %
  • thermique à combustible fossile 7,2 %
  • hydraulique 12,5 %
  • éolien 5,1 %
  • solaire 1,9 %
  • agroénergies 1,8 %

Le facteur de charge de l’éolien est de 21 % et celui du solaire de 13,6 %.

Ces EnR intermittentes ont de faibles facteurs de charge, ce sont donc des moyens de production peu efficaces, mais particulièrement onéreux.
L’Espagne et l’Allemagne en ont fait la douloureuse expérience.

Avant le développement des EnR intermittentes, nous exportions environ 10 % de notre production d’électricité. Nous pouvons donc nous demander pourquoi nos gouvernants, à la suite des Directives de la Commission européenne, ont imposé  manu militari ces EnR intermittentes alors qu’une politique de prolongation de la durée de vie des centrales nucléaires, un programme de construction de plusieurs EPR, et un financement approprié de la R&D sur la surgénération à uranium appauvri auraient été les meilleures options.

La filière des SMR (small size reactors) qui utilise la technologie des sous-marins nucléaires, serait également une piste à développer, car elle permettrait de produire de l’électricité à proximité des centres de consommation, rendant ainsi les pertes lors du transport quasiment nulles.

LE CO2 LOURDEMENT TAXÉ

Les politiques climat-énergie de notre pays et de la plupart de pays de l’UE sont basées sur l’hypothèse non prouvée que nos émissions de CO2 ont une action mesurable sur la température moyenne annuelle globale (TMAG) et sur le climat de notre planète.


IPCC Expert’s 8 Discredited Papers

by Donna Laframboise, January 12, 2020 in BigPicturesNews


Philip Munday’s work falls to pieces whenever someone tries to verify it.

Last week, Nature published a damning refutation of a significant body of climate change research. The title of that article is self-explanatory: Ocean acidification does not impair the behaviour of coral reef fishes.

The authors studied more than 900 fish from six different species over a period of three years, attempting to verify earlier findings by a team of researchers at Australia’s James Cook University. Their attempts failed.

Scholarly convention being what it is, the now-discredited work isn’t identified in a clear manner. Readers are compelled to sift through footnotes to locate the “several high-profile papers” that are being refuted. So here they are:

….

Continuer la lecture de IPCC Expert’s 8 Discredited Papers

How nodules stay on top at the bottom of the sea

by Geological Society of America, January 13, 2020 in ScienceDaily


Rare metallic elements found in clumps on the deep-ocean floor mysteriously remain uncovered despite the shifting sands and sediment many leagues under the sea. Scientists now think they know why, and it could have important implications for mining these metals while preserving the strange fauna at the bottom of the ocean.

The growth of these deep-sea nodules — metallic lumps of manganese, iron, and other metals found in all the major ocean basins — is one of the slowest known geological processes. These ringed concretions, which are potential sources of rare-earth and other critical elements, grow on average just 10 to 20 millimeters every million years. Yet in one of earth science’s most enduring mysteries, they somehow manage to avoid being buried by sediment despite their locations in areas where clay accumulates at least 100 times faster than the nodules grow.

Understanding how these agglomerations of metals remain on the open sea floor could help geoscientists provide advice on accessing them for industrial use. A new study published this month in Geology will help scientists understand this process better.

“It is important that any mining of these resources is done in a way that preserves the fragile deep-sea environments in which they are found,” said lead author Adriana Dutkiewicz, an ARC Future Fellow in the School of Geosciences at The University of Sydney.

Rare-earth and other critical elements are essential for the development of technologies needed for low-carbon economies. They will play an increasingly important role for next-generation solar cells, efficient wind turbines, and rechargeable batteries that will power the renewables revolution.

The Ocean Warms By A Whole Little

by Willis Eschenbach, January 4, 2020 in WUWT


How much is a “Whole Little”? Well, it’s like a whole lot, only much, much smaller.

There’s a new paper out. As usual, it has a whole bunch of authors, fourteen to be precise. My rule of thumb is that “The quality of research varies inversely with the square of the number of authors” … but I digress.

In this case, they’re mostly Chinese, plus some familiar western hemisphere names like Kevin Trenberth and Michael Mann. Not sure why they’re along for the ride, but it’s all good. The paper is “Record-Setting Ocean Warmth Continued in 2019“. Here’s their money graph:


Figure 1. Original Caption: “Fig. 1. (a) Upper 2000 m OHC from 1955 through 2019. The histogram represents annual anomalies (units: ZJ), wherein positive anomalies relative to a 1981−2010 baseline are shown as red bars and negative anomalies as blue. The two black dashed lines are the linear trends over 1955–86 and 1987−2019, respectively.”


So here’s the hot news. According to these folks, over the last sixty years, the ocean has warmed a little over a tenth of one measly degree … now you can understand why they put it in zettajoules—it’s far more alarming that way.

Next, I’m sorry, but the idea that we can measure the temperature of the top two kilometers of the ocean with an uncertainty of ±0.003°C (three-thousandths of one degree) is simply not believable.

Also Ocean Warming Scares

Also : New 80-Year Deep-Ocean Temperature Dataset Compared to a 1D Climate Model

La géologie, une science plus que passionnante … et diverse