by Rice University, March 27, 2020 in WUWT
HOUSTON – (March 26, 2020) – There is no longer a need to guess what ocean temperatures were like in the remote tropical Pacific hundreds of years ago. The ancient coral that lived there know all.
A study in Science led by Rice University and Georgia Tech researchers parses the record archived by ancient tropical Pacific coral over the past millennium. That record could help scientists refine their models of how changing conditions in the Pacific, particularly from volcanic eruptions, influence the occurrence of El Niño events, which are major drivers of global climate.
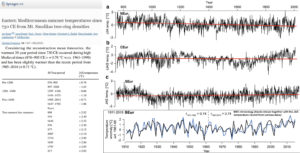
They found the ratio of oxygen isotopes sequestered in coral, an accurate measure of historic ocean temperatures, shows no correlation between estimates of sulfate particles ejected into the atmosphere by tropical volcanic eruptions and El Niño events.
That result could be of particular interest to scientists who suggest seeding the atmosphere with sun-blocking particles may help reverse global warming.
According to Rice climate scientist and primary author Sylvia Dee, previous climate model studies often tie volcanic eruptions, which increase sulfate aerosols in the atmosphere, to increased chances for an El Niño event. But the ability to analyze climate conditions based on oxygen isotopes trapped in fossil corals extends the climatological record in this key region across more than 20 ancient eruptions. Dee said this allows for a more rigorous test of the connection.
“A lot of climate modeling studies show a dynamical connection where volcanic eruptions can initiate El Niño events,” Dee said. “We can run climate models many centuries into the past, simulating volcanic eruptions for the last millennium.
“But the models are just that — models — and the coral record captures reality.”
Coral data that Georgia Tech climate scientist Kim Cobb and her team arduously collected on trips to the Pacific show little connection between known volcanoes and El Niño events over that time. Like tree rings, these paleoclimate archives hold chemical indicators, the oxygen isotopes, of oceanic conditions at the time they formed.
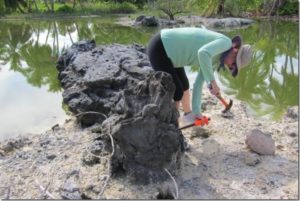
The coral data yields a high-fidelity record with a resolution of less than a month, tracking the El Niño-Southern Oscillation (ENSO) in the heart of the central tropical Pacific.
…


