Serious Errors In IPCC Ocean Report Revealed

by B. Peiser, October 11, 2019 in GWPF


London, 11 October: The Global Warming Policy Foundation (GWPF) has called on the Intergovernmental Panel on Climate Change (IPCC) to correct serious errors in its recent Special Report on the Ocean and Cryosphere in a Changing Climate.

In a letter to the IPCC, Dr Benny Peiser, the GWPF’s director, has highlighted a number of errors and misinterpretations in the IPCC’s report which are based, to a significant degree, on a flawed study which was recently retracted.

In his letter, Dr Peiser points out that the IPCC’s overall conclusion on ocean heat uptake

“is based to a significant degree on a paper by Cheng et al. (2019) which itself relies on a flawed estimate by Resplandy et al. (2018). An authors’ correction of this paper and its ocean heat uptake estimate was under review for nearly a year, but in the end Nature requested that the paper be retracted (Retraction Note, 2019).”

“While the [IPCC’s] conclusion that the rate of ocean heat uptake has increased in recent years may probably be right, the evidence you cite for there being ‘high confidence’ and ‘high agreement’ is rather doubtful due to your inclusion of flawed evidence of the retracted paper by Resplandy et al. (2018).”

What is more, there is also doubt about the IPCC’s conclusion that ocean heat uptake has been accelerating in recent years. According to its own report the overall ocean heat uptake between 0-2000 m was nearly 10% higher over 1993-2017 than over the second half of that period, 2005-2017, suggesting that OHU may have been declining slightly rather than accelerating over the last 25 years.

In light of these flaws, the GWPF is calling on the IPCC to correct the evident errors and reduce its confidence rating accordingly.

Letter to the IPCC (pdf)
https://www.thegwpf.org/content/uploads/2019/10/IPCC-letter-Oct2019.pdf?utm_source=CCNet+Newsletter&utm_campaign=67a9d80e1a-EMAIL_CAMPAIGN_2019_10_11_11_33_COPY_01&utm_medium=email&utm_term=0_fe4b2f45ef-67a9d80e1a-36415357&mc_cid=67a9d80e1a&mc_eid=b9fdc60fd9

Réchauffement des océans, Tchernobyl, cancer et pesticides, liste bio, QI mondial… une semaine de fake news scientifiques

by J.P. Oury, 11 octobre 2019 in EuropeanScientist


Si le sujet « vérité et connaissance scientifique » est un pilier de la philosophie classique et de l’épistémologie contemporaine, il se pourrait bien que, dans une ère de post-vérité, ce thème soit progressivement remplacé par celui de la chasse aux « fausses informations ». Pour le dire autrement, ce qui compte, ce n’est plus la quête d’un sens métaphysique ou une recherche de cohérence logique, mais qu’un énoncé tienne le plus longtemps possible à la Une de l’actualité avant d’être remis en cause.

En affirmant ceci notre objectif n’est pas de donner un blanc seing au relativisme ou d’abandonner la méthode scientifique, bien au contraire. Il s’agit de réfléchir sur la possibilité de redonner à celle-ci  sa superbe ; d’autant plus qu’elle n’est plus simplement une affaire de scientifiques : les médias, les politiques, les ONG et l’opinion s’emparent immédiatement de la moindre expérience rendue publique et se trouvent engagés de manière quasi instantanée dans le processus de « vérification » qui passe d’abord souvent par l’acceptation. Ce qui montre la nécessité d’éduquer l’opinion pour lui apprendre à détecter les différentes typologies d’erreurs scientifiques. Voici donc une petite grille de lecture que nous avons établie en classant cinq grandes typologies d’informations scientifiques qui se sont révélées fausses…


Rétractation d’un article sur le réchauffement des océans : l’erreur scientifique


USGS: Marcellus/Utica Natural Gas Resource Has Nearly Doubled Since 2012

by David Middleton, October 8, 2019 in WUWT


I had the good fortune of working with Jim Reilly at Enserch Exploration back in the 1980’s and early 1990’s… Before he became a NASA astronaut and then Director of the USGS.

“Shale” comprises more than 60% of current U.S. proved natural gas reserves… The Marcellus/Utica comprise about 50% of “shale” proved reserves… And the undiscovered technically recoverable resource potential of the Marcellus/Utica is now larger than the proved reserves and nearly as large (70%) as the current proved reserves of all “shale” plays….

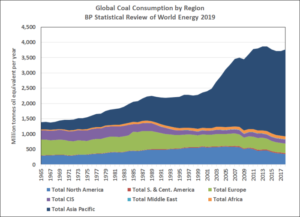
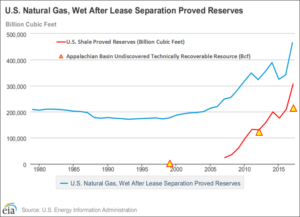
Figure 2. “The effects American ingenuity and new technology can have.”…

It’s Time To Move Beyond The Toy Models that Guide Climate Policy

by Roger Pielke, October 7, 2019 in Forbes


Underlying discussion and debate of climate policies are computer models that bring together idealized representations of policies, economics and climate to estimate the impacts of future climate change and the benefits of mitigation. Such models, typically called integrated assessment models, are incredibly technical and complex. At the same time, they are also simplistic toys. Here I argue that while these models are valuable for exploring concepts and ideas, they have come to serve as a huge distraction when it comes to the development of actual policies that have a chance to accelerate rates of decarbonization in the real world.

Before proceeding, it is important to note that climate change poses real risks to our collective future, and aggressive mitigation and adaptation policies make good sense. However, the pace of progress, particularly on mitigation, has been frustratingly slow.

One way that integrated assessment models warp our discussion of climate policies is through the pervasive use of what are called “baseline scenarios.” These scenarios seek to represent where the world may be headed into the future in the absence of climate policies. Here is how the Intergovernmental Panel on Climate Change (IPCC) defines such scenarios, and their role in evaluating futures with climate policy (called “mitigation scenarios”):

Methodological debates are of course common in policy research. But in no area of policy that I have encountered over the past 30 years as a policy researcher have I come across a subject matter both as important as climate change and completely captured by one school of thought.

Scenario planning has an important role to play in the tool box of policy analysts. However, in the case of climate change, scenarios generated by integrated assessment models have overwhelmingly become the main tool of analysis in climate policy, to the exclusion of other valuable approaches. The result of this methodological myopia is that much of our collective intellectual attention has been spent on trying to figure out how to address climate change in models, and not in the real world.

WWF Apologizes Over Doctored Polar Bear Image In Climate Campaign

by Uutiset, October 8, 2019 in ClimateChangeDispatch


Environmental NGO WWF Finland has apologized for using a retouched photo of a polar bear and cub standing on a tiny ice floe, apparently adrift in an ocean.

However, the organization’s communications head, Anne Brax, also defended the use of the image as an advertising tool commonly used as shorthand for climate change and its impact on arctic regions, rather than as a news item.

The photo was used as part of an anti-climate change fundraising campaign aimed at students participating in Finland’s annual “taksvärkki” or “day’s work” program, where middle schoolers work for a day to collect money for worthy causes.

The image used in the campaign was originally shot by nature photographer Steven Kazlowski and depicts a polar bear and a cub. In the original photo, however, the polar bears are set against an icy landscape with no ocean in sight.

Alongside the manipulated image used in the WWF Finland campaign is the text “sulaa hulluutta kun ilmasto lämpenee”, which roughly translated means “pure madness as the climate warms”, with a play on the word “sulaa”, which also means “to melt” in Finnish.

WWF Finland: “We Made A Mistake”

A Democratic professor explains what his party gets wrong about climate

by Caleb Rossiter, July 18, 2019 in WashingtonExaminer


As the Republican-called witness at a recent hearing, I was denounced by the Democrats for denying a fossil-fueled “climate crisis” that, as their witnesses testified, results in violence against women, asthma and obesity in children, and deadly storms. But few actually questioned me. After all, “the debate is over.”

So instead, the latest belle of my party’s ball, Rep. Alexandria Ocasio-Cortez, left the dais to urge protestors outside to drown me out. She’d previously written Google and Facebook, asking them to block me and the CO2 Coalition of 50 unalarmed scientists I direct from speaking at conferences they sponsor.

At the hearing, I presented data from the United Nations contradicting the accepted wisdom that extreme weather is destroying the planet and is traceable directly to a man-made climate crisis. There are no such trends in rates of sea-level rise, hurricanes, floods, or droughts. One Democrat who stuck around to actually question me simply asserted that our coalition is funded by energy companies. I wish! Another wanted to know, “Do you believe in climate change or not?” When I asked him to define it, he cut me off with: “That answers it all…That gives us a hint where you’re coming from.”

Indeed it does. Where I’m coming from is academia, where defining the scientific terms we discuss is elemental.

The whole affair shows just how much has changed. A decade ago I’d been the one pummeling a Republican-called witness, a little-known pollster named Kellyanne Conway, in my role as counsel to a Democratic committee chairman. And the last time I’d been a witness, as director of a foreign policy group in 1994, I’d been called in by Democrats who were backing our “no arms to dictators” bill. But now I am a heretic for using scientific facts to dispute exaggerated talking points.

Where I’m coming from is academia, where defining the scientific terms we discuss is elemental. (Photo by Graeme Jennings/Washington Examiner)

COLDEST OCTOBER 6 EVER RECORDED IN THE NETHERLANDS — ADDITIONAL ARCTIC AIR ON THE WAY FOR EUROPE

by Cap Allon, October 7, 2019 in Electroverse


Bone chilling cold descended into Europe over the weekend, exactly as forecast by the GFS. And the ‘Polar Invasion’ will continue to seize practically ALL of the continent throughout the week, sinking temps as much as 20C below average, with only far Western regions spared.

This past Sunday went down as the coldest October 6th ever recorded in ALL of Holland, in record books dating back to 1901 (solar minimum of cycle 13).

The country’s daily high, measured at the national weather station in De Bilt, climbed to just 9.6C (49F), which busted the previous record low of 10.1C (50F) set back in 1936 (just exiting solar min of cycle 16).

The weekend’s chill was thanks to a descending Arctic air mass which brought icy easterly winds, thick cloud cover and heavy rain. This pattern will run for rest of the week, and is expected to see further record lows temps tumble.

While across Europe the story is the same, too — all-time cold records will likely tumble in Central, Southern and Eastern parts, particularly during the first half of the week, with Italy, the Ukraine, Romania, Greece, Hungary, Slovakia, Austria and southern Poland on course to be worst hit:

Solar activity drives CO2 levels

by R. Mac, August 10, 2014  in TheHockeySchtick


Hypothesis: Increasing accumulated solar activity [sunspot time-integral] since the Maunder Minimum 1645-1715 AD has warmed the oceans and land, warming of the oceans has increased ocean outgassing of CO2 [Henry’s Law] and has been the primary cause of increased atmospheric CO2 levels. Ocean temperatures driven by solar activity control atmospheric CO2 levels on short, intermediate, and long-term timescales.

Also note if increased solar activity warms the oceans, the solubility of CO2 in the oceans decreases due to Henry’s Law, thus preventing “acidification” of the oceans. If the oceans are warming due to any cause, Henry’s Law says solubility of CO2 decreases and outgassing increases, preventing “acidification” from man-made and natural sources of CO2. Warnings about ocean acidification are misleading and overblown:

Solar-Climate Theory Sheds New Light On History Of Chinese Civilization

by S. Chen, Sep; 24, 2019 in ClimateChangeDispatch


Scientists say they have found evidence beneath a lake in northeastern China that ties climate change and 500-year sun cycles to ups and downs in the 8,000 years of Chinese civilization.

According to the study by a team at the Institute of Geology and Geophysics in Beijing published in the science journal Nature Communications this month, whenever the climate warmed, Chinese civilization prospered and when it cooled, it declined.

While historians have used various social and economic factors to explain changes over the millennia, Dr. Xu Deke, lead author of the paper, and his colleagues said that while people played their part, their study indicated that cycles in solar activity influenced human activity.

“We just point out there is a natural constraint on human efforts,” Xu said.

Previous research linking Chinese history to climate relied on written records, but ancient texts contained only subjective descriptions of the weather and social development. The records also go back only so far – writing in China was not invented until 3,600 years ago.

For this latest study, the team and its leader, Chinese Academy of Sciences professor Lu Houyuan, took plant and lake bed sediment samples to track climate change over the centuries and compared them with written records.


Mann, Hayhoe Try To Erase To The Pesky Medieval Warm Period

by J. Taylor, October 3, 2019 in ClimateChangeDispatch


Climate alarmists Michael Mann and Katharine Hayhoe have been caught using dubious, revisionist temperature data in their attempt, as one Climategate email author put it,  to “deal a mortal blow” to the extensively documented Medieval Warm Period.

Before climate change became a political issue, it was scientifically well-established that a significant global warming event occurred between approximately 900 AD and 1200 AD.

For example, the United Nations Intergovernmental Panel on Climate Change (IPCC) First Assessment Report presented a temperature history and visual graph documenting that the Medieval Warm Period existed and that it brought temperatures at least as warm as today (at pg. 7).

Multiple peer-reviewed studies provided additional confirmation of the Medieval Warm Period.

The warming climate of the Medieval Warm Period spurred abundant crop production, fewer extreme droughts and floods, a growing human population, and improving living standards.

The Little Ice Age terminated the Medieval Warm Period and brought devastating weather extremes, widespread crop failures, famines, plagues like the Black Death, and a contracting human population.

For a good summary of the extensive benefits of the Medieval Warm Period and the devastating harms of the Little Ice Age, see the excellent book, “In the Wake of the Plague: The Black Death and the World It Created.”

55 New (2019) Scientific Papers Link Solar Activity To Climate Change

by K. Richard, October 3, 2019 in NoTricksZone


In the last few years, hundreds of peer-reviewed scientific papers have been published linking changes in solar activity to Earth’s climate (2016, 2017, 2018). The evidence for a robust Sun-Climate connection continues to accumulate in 2019.

When it comes to the Sun’s influence on climate, one conclusion is certain: there is no widespread scientific agreement as to how and to what extent solar activity and its related parameters (i.e., galactic cosmic rays, geomagnetic activity, solar wind flux) impact changes in the Earth’s temperature and precipitation.

The disagreement is so chasmic and the mechanisms are so poorly understood that scientists’ estimates of the influence of direct solar irradiance forcing between the 17th century and today can range between a negligible +0.1 W m-2 to a very robust +6 W m-2 (Egorova et al., 2018Mazzarella and Scafetta, 2018).

There is no consensus on the amplitude of the historical solar forcingThe estimated magnitude of the total solar irradiance difference between Maunder minimum and present time ranges from 0.1 to 6 W/m2 making uncertain the simulation of the past and future climate.”  (Egorova et al., 2018)
“According to the IPCC (2013), solar forcing is extremely small and cannot induce the estimated 1.0–1.5 °C since the LIA. However, thesolar radiative forcing is quite uncertain because from 1700 to 2000 the proposed historical total solar irradiance reconstructions vary greatly from a minimum of 0.5 W/m2 to a maximum of about 6 W/m2 (cf..: Hoyt and Schatten 1993; Wang et al. 2005; Shapiro et al. 2011). Moreover, it is believed that the sun can influence the climate also via a magnetically induced cosmic ray flux modulation (e.g.: Kirkby 2007) or via heliospheric oscillation related to planetary resonances (e.g.: Scafetta 2013, 2014b; Scafetta et al. 2016, and others). Since solar and climate records correlate quite significantly throughout the Holocene (cf: Kerr 2001; Steinhilber et al. 2012; Scafetta 2012, 20104b), the results shown herein may be quite realistic, although the exact physical mechanisms linking astronomical forcings to climate change are still poorly understood.”  (Mazzarella and Scafetta, 2018)”

Coal to remain ‘King’ in Southeast Asia

by David Middleton, October 4, 2019 in WUWT


‘Coal is still king’ in Southeast Asia even as countries work toward cleaner energy
PUBLISHED MON, SEP 30 2019
Huileng Tan

KEY POINTS

• Not only will coal continue to be the dominant fuel source in power generation in Southeast Asia, its use will grow and peak in 2027 before slowing, according to a Wood Mackenzie study.

• The Indonesian government has targeted generating 23% of electricity from renewable sources by 2025 — almost double the 12% now, but it will be “difficult to achieve because capacity expansion plans are still dominated by coal,” Moody’s analysts say.

• Global coal demand grew for a second straight year to reach 0.7% in 2018, International Energy Agency data shows.

Coal is still a dominant fuel in the rapidly growing economies of Southeast Asia, even amid a general global move toward cleaner energy sources, data from several recent reports show.

Figure 1. Global coal consumption by region (million tonnes of oil equivalent per year). BP Statistical Review of World Energy 2019.

NEW ZEALAND EXPERIENCES FOURTH COLDEST SEPTEMBER THIS CENTURY

by Cap Allon, October 4, 2019 in Electroverse


New Zealand’s average temperature last month –for the country as a whole– was below the 1981-2010 September avg., Niwa has said in its Monthly Climate Summary.

An unusual warming of the atmosphere high above Antarctica –called a Sudden Stratospheric Warming event (SSW)– assisted in making last month the fourth coldest September in New Zealand this century.

There have only ever been two SSWs recorded in the Southern Hemisphere, previous to this years — one in September 2002 (major) and another in September 2010 (minor).

The 2002 SSW event resulted in New Zealand experiencing a significant cold outbreak in October while the 2010 event was associated with record rainfall during September.

Record Antarctic Stratospheric Warming Causes Sept. 2019 Global Temperature Update Confusion

by Roy Spencer, October 4, 2019 in WUWT


While the vast majority of our monthly global temperature updates are pretty routine, September 2019 is proving to be a unique exception. The bottom line is that there is nothing wrong with the UAH temperatures we originally reported. But what I discovered about last month is pretty unusual.

It all started when our global lower tropospheric (LT) temperature came in at an unexpectedly high +0.61 deg. C above the 1981-2010 average. I say “unexpected” because, as WeatherBell’s Joe Bastardi has pointed out, the global average surface temperature from NOAA’s CFS model had been running about 0.3 C above normal, and our numbers are usually not that different from that model product.

[By way of review, the three basic layers we compute average temperatures from the satellites are, in increasing altitude, the mid-troposphere (MT), tropopause region (TP), and lower stratosphere (LS). From these three deep layer temperatures, we compute the lower tropospheric (LT) product using a linear combination of the three main channels, LT = 1.548MT – 0.538TP +0.01LS.]

Yesterday, John Christy noticed that the Southern Hemisphere was unusually warm in our lower stratosphere (LS) temperature product, while the Northern Hemisphere was unusually cool. This led me to look at the tropical results for our mid-troposphere (MT) and ‘tropopause’ (TP) products, which in the tropics usually track each other. A scatterplot of them revealed September 2019 to be a clear outlier, that is, the TP temperature anomaly was too cool for the MT temperature anomaly.

So, John put a notice on his monthly global temperature update report, and I added a notice to the top of my monthly blog post, that we suspected maybe one of the two satellites we are currently using (NOAA-19 and Metop-B) had problems.

As it turns out, there were no problems with the data. Just an unusual regional weather event that produced an unusual global response.

RECORDS CONTINUE TO FALL ACROSS THE NW + MORE HISTORIC COLD SET TO ENGULF ALL OF NORTH AMERICA BY OCT 10

by Cap Allon, October 3, 2019 in Electroverse


This weekend will mark the final phase of a major winter storm that ravaged the NW U.S. bringing whipping winds to the Flathead Valley, feet of snow along the Continental Divide and record-breaking/challenging temps for all.

A new all-time daily record low temperature was set in Kalispell, Montana on Wednesday, October 02 as the mercury plunged into the teens across the region.

The weather station at Glacier Park International Airport recorded a low of 19F (-7.2C) at 5 AM which busted the dates previous record low of 21F (-6.1C) set back in 1999.

Great Falls, Montana registered a record-smashing 9F (-12.8C) on Tue, Oct 01, according to the NWS, which annihilated the previous daily low of 22F (-5.6C) set back in 1959.

Additionally, areas to the northwest also saw record low daily temperatures on Tuesday as both Cut Bank and Browning comfortably surpassed their previous cold records from 1950.

And further south, crossing a few state lines into California, temperatures at Sacramento Executive Airport dropped to 42F (5.6C) early Wednesday morning, surpassing the old record of 43F (6.1C) set in 1971. Meaning that in less than a week, Sacramento has now set multiple all-time record lows; on Sunday, both downtown Sacramento and the airport set record lows of 45F (7.2C) and 46F (7.8C) respectively.

Global Temperature Report: September 2019

by Anthony Watts, October 3, 2019 in WUWT


Global climate trend since Dec. 1 1978: +0.13 C per decade

September Temperatures (preliminary)

Global composite temp.: +0.61 C (+1.10 °F) above seasonal average

Northern Hemisphere.: +0.64 C (+1.15 °F) above seasonal average

Southern Hemisphere.: +0.58 C (+1.00°F) above seasonal average

Tropics.: +0.60 C (+1.08°F) above seasonal average

August Temperatures (final)

Global composite temp.: +0.38 C (+0.68 °F) above seasonal average

Northern Hemisphere.: +0.33 C (+0.59 °F) above seasonal average

Southern Hemisphere.: +0.44 C (+0.79°F) above seasonal average

Tropics.: +0.45 C (+0.81 °F) above seasonal average

Notes on data released October 3, 2019 (v6.0)

September’s globally-averaged, bulk-layer atmospheric temperature anomaly of +0.61°C (+1.10°F) represented the warmest September reading of the past 41 Septembers in our satellite record. The jump from August was substantial (+0.23°C) and ranks among the largest month-to-month changes. (Several previous jumps were greater than 0.3°C however.) The warmth was global in extent with warmest September temperatures posted for both hemispheres and the tropical belt. This month-to-month heating is possibly related, at least in part, to the tropical Pacific Ocean’s loss of heat energy to the atmosphere in the recent months as El Niño conditions declined.

Emmanuel Le Roy Ladurie A (re)lire absolument…

by Alain Préat,  3 octobre 2019 inScienceClimatEnergie


S’il est un livre, et un des premiers, à s’être penché de manière aussi détaillée sur l’évolution (récente) du climat, c’est celui d’Emmanuel Le Roy Ladurie ‘Histoire du climat depuis l’an mil’, publié en 1967.

Rappelons cependant le livre précurseur de Joseph-Jean-Nicolas Fuster publié en 1845 et récemment analysé ici même à SCE (et toujours disponible, voir ici).


1/ Introduction

A lire ou relire ce livre de 366 pages (Figure 1), on ne peut qu’être stupéfié par l’analyse rigoureuse qui met en évidence la variabilité naturelle du climat aux échelles pluriséculaire et décennale, qui décortique et privilégie  avec finesse le caractère local du climat par rapport à un climat global et fournit à partir d’indicateurs fiables des fourchettes de températures pour les variations climatiques observées à l’échelle pluriséculaire.

 Figure 1. Histoire du climat depuis l’an mil, Flammarion, publié en 1967

Avant d’aborder ce sujet en détail, il semble qu’aucun modèle sorti des ‘computers’ (GIEC) n’ait été jusqu’à présent capable de rendre compte des évolutions rapportées dans le livre d’ Emmanuel Le Roy Ladurie, ces modèles se prétendent ‘globaux’, contrairement à la conclusion du livre en question qui insiste particulièrement sur le caractère local des climats. Enfin il s’agit d’un livre de 366 pages bien illustré (photographies, cartes et graphiques) dans lequel il n’est pas mentionné une seule fois ‘le poison’ des temps modernes, à savoir le CO2. L’auteur, en 1967 (faut-il le rappeler …), propose ou explore quand  même des pistes pour rendre compte de la succession d’épisodes ‘froids’ et ‘chauds’, tout au long de ces 1000 années d’histoire, qui en fait  débutent il y a 3500 ans (mais pour ces temps historiques plus reculés, les données fiables sont moins nombreuses).


2/ Alors que dit Emmanuel Le Roy Ladurie ?

Net-Zero Carbon Dioxide Emissions By 2050 Requires A New Nuclear Power Plant Every Day

by Roger Pielke, Sep. 30, 2019 in WUWT


I research and write about science, policy and politics.

More than a decade ago, Gwyn Prins and Steve Rayner characterized climate policy as an “auction of promises” in which politicians “vied to outbid each other with proposed emissions targets that were simply not achievable.” For instance, among Democrats competing for the presidency in 2020, several, including Joe Biden, have committed to achieving net-zero carbon dioxide emissions by 2050. Candidate Andrew Yang bid 2049, and Cory Booker topped that by offering 2045. Bernie Sanders has offered a 71% reduction by 2030.

One reason that we see this “auction of promises” is that the targets and timetables for emissions reductions are easy to state but difficult to comprehend. Here I’ll present what net-zero carbon dioxide emissions for 2050 actually means in terms of the rate of deployment of carbon-free energy and the coincident decommissioning of fossil fuel infrastructure.

To conduct this analysis I use the BP Statistical Review of World Energy, which presents data on global and national fossil fuel consumption in units called “million tons of oil equivalent” or mtoe. In 2018 the world consumed 11,743 mtoe in the form of coal, natural gas and petroleum. The combustion of these fossil fuels resulted in 33.7 billion tonnes of carbon dioxide emissions. In order for those emissions to reach net-zero, we will have to replace about 12,000 mtoe of energy consumption expected for 2019. (I ignore so-called negative emissions technologies, which do not presently exist at scale.)

Another useful number to know is that there are 11,051 days left until January 1, 2050. To achieve net-zero carbon dioxide emissions globally by 2050 thus requires the deployment of >1 mtoe of carbon-free energy consumption (~12,000 mtoe/11,051 days) every day, starting tomorrow and continuing for the next 30+ years. Achieving net-zero also requires the corresponding equivalent decommissioning of more than 1 mtoe of energy consumption from fossil fuels every single day.

Another important number to consider is the expected increase in energy consumption in coming decades. The International Energy Agency currently projects that global energy consumption will increase by about 1.25% per year to 2040. That rate of increase in energy consumption would mean that the world will require another ~5,800 mtoe of energy consumption by 2050, or about another 0.5 of an mtoe per day to 2050. That brings the total needed deployment level to achieve net-zero emissions to about 1.6 mtoe per day to 2050.


The scale of the challenge to achieve net-zero carbon dioxide emissions in 2050. Roger Pielke Jr., BP 2018

2019 Arctic Ice Demise Deferred Again

by Ron Clutz, October 2, 2019 in ScienceMatters


MASIE daily results for September show 2019 early melting followed by an early stabilizing and refreezing.

Note that 2019 started the month about 800k km2 below the 12 year average (2007 through 2018 inclusive).  There was little additional loss of ice, a rise then a dip below 4 M km2, and a sharp rise ending the month.  Interestingly, 2019 matched the lowest year 2012 at the start, but ended the month well ahead of both 2012 and 2007.

The table for day 273 shows distribution of ice across the regions making up the Arctic ocean.

Trois solutions (et demie) pour le climat

by Prof. Samuel Furfari, 3 octobre 2019 in L’Echo


“Après avoir travaillé pendant plus de 40 ans dans le domaine, mon expérience me pousse à plaider pour une analyse factuelle et objective de la situation, même si elle peut paraître iconoclaste dans le climat actuel…’

Les feux des projecteurs de l’Assemblée générale de l’ONU s’étant éteints, il est temps de voir plus sereinement la situation en matière de politique climatique — et donc énergétique – qui menace dangereusement notre démocratie. Après avoir travaillé pendant plus de 40 ans dans le domaine, mon expérience me pousse à plaider pour une analyse factuelle et objective de la situation, même si elle peut paraître iconoclaste dans le climat actuel.

Malgré l’opinion générale, et de certains scientifiques, la science du climat est très jeune. Affirmer que “tout est connu et qu’il n’y a plus qu’à agir” est donc prématuré. Le rapport du GIEC est rempli de conditionnels. Pas de certitudes, mais des hypothèses loin d’être irrécusables, puisque le système climatique possède “une signature chaotique“.

Lorsque durant la vague de chaleur de cet été, le climatologue français Jean Jouzel annonce que la température augmentera de “trois ou quatre” degrés, il omet d’ajouter que le GIEC assortit cette hypothèse d’une probabilité de 1% et que c’est pour un maximum de 3°C et non de 4°C ou de 7°C comme on l’entend parfois.

‘There is no climate emergency,’ hundreds of scientists, engineers tell U.N.

by P. Homewood, October 2, 2019 in NotaLotofPeopleKnowThat


Lost amid the coverage of Swedish teen activist Greta Thunberg at last week’s U.N. Global Climate Summit were the 500 international scientists, engineers and other stakeholders sounding a very different message: “There is no climate emergency.”

The European Climate Declaration, spearheaded by the Amsterdam-based Climate Intelligence Foundation [CLINTEL], described the leading climate models as “unfit” and urged UN Secretary-General Antonio Guterres to pursue a climate policy based on “sound science.”

“Current climate policies pointlessly and grievously undermine the economic system, putting lives at risk in countries denied access to affordable, reliable electrical energy,” said the Sept. 23 letter signed by professionals from 23 countries.

Most of the signers hailed from Europe, but there were also scientists from the United States, Canada, Australia, New Zealand and South America.

“We urge you to follow a climate policy based on sound science, realistic economics and genuine concern for those harmed by costly but unnecessary attempts at mitigation,” the letter said.

Full story here.

Eocene Climatic Optima: Another Clean Kill of Carbon Dioxide-Driven Climate Change Hypothesis?

by David Middleton, September 30, 2019 in WUWT


Key points

  1. The Eocene was, on average, 4–15 °C warmer than today.
  2. Atmospheric CO2 was very likely in the 450-600 ppm range.
  3. Modern climate models would require 4,500 ppm CO2 to simulate the Eocene temperature range;
  4. And/or a climate sensitivity of 4-8 °C per doubling;
  5. And/or “that other climate forcings were stronger than previously assumed”.

They totally missed the most obvious reason why just about every effort to gin up a paleo example of CO2-driven climate change falls apart: Atmospheric CO2 is not a primary driver of climate change over geologic time. This wouldn’t mean that it isn’t a greenhouse gas or that it has no effect on temperature. It would simply mean that it was a relatively minor climate driver, like volcanic eruptions.

At some point over the past 30 years or so, the assumption that CO2 drives modern climate change has become a paradigm. And I think we have seen a rare failure in the application of the geologic principle of Uniformitarianism.

Uniformitarianism is often incorrectly cited as the reason geologists were slow to accept plate tectonics, the impact theory of the K-Pg extinction and why the hypotheses for a Younger Dryas impact and abiotic oil are generally unaccepted. However, Uniformitarianism may be why a CO2-driven climate paradigm appears to have come into wide acceptance, at least in academia.

Figure 3a. Marine pCO2 (foram boron δ11B, alkenone δ13C), atmospheric CO2 from plant stomata (green and yellow diamonds with red outlines), Mauna Loa instrumental CO2 (thick red line) and Cenozoic temperature change from benthic foram δ18O (light gray line).


New Study: Modern Arctic Sea Ice Cover Is Present MONTHS Longer Than Nearly All Of The Last 8000 Years

by Caron et al., 2019, 30 Sep. 2019 in NoTricksZone


A new reconstruction of Arctic (NW Greenland) sea ice cover (Caron et al., 2019) reveals modern day sea ice is present multiple months longer than almost any time in the last 8000 years…and today’s summer sea surface temperatures s are among the coldest of the Holocene.
Yet another new study (Caron et al., 2019) shows today’s Arctic sea ice cover is still quite extensive when compared to the last several thousand years, when CO2 concentrations ranged between 260 and 270 ppm.

Other new Arctic sea ice reconstructions from the north of Iceland (Harning et al., 2019) and Barents Sea (Berben et al., 2019) regions indicate a) modern sea ice extent has changed very little in the last several hundred years, or since the Little Ice Age, and b) the Early Holocene had millennial-scale periods of sea-ice-free and open water conditions, which is in stark contrast to “modern conditions” – the “highest value” or furthest extent of the sea ice record.

[T]he PBIP25 values [proxy for sea ice presence] reach their highest value (0.87) of the record at ca. 0 cal yr BP. An increase in PBIP25 suggests a further extension in sea ice cover, reflecting Arctic Front conditions (Müller et al., 2011), most similar to modern conditions.” (Berben et al., 2019)