UH researchers reveal largest and hottest shield volcano on Earth
Posted on May 13, 2020 by Marcie Grabowski
In a recently published study, researchers from the University of Hawai‘i at Mānoa School of Ocean and Earth Science and Technology revealed the largest and hottest shield volcano on Earth. A team of volcanologists and ocean explorers used several lines of evidence to determine Pūhāhonu, a volcano within the Papahānaumokuākea Marine National Monument, now holds this distinction.
Geoscientists and the public have long thought Mauna Loa, a culturally-significant and active shield volcano on the Big Island of Hawai‘i, was the largest volcano in the world. However, after surveying the ocean floor along the mostly submarine Hawaiian leeward volcano chain, chemically analyzing rocks in the UH Mānoa rock collection, and modeling the results of these studies, the research team came to a new conclusion. Pūhāhonu, meaning ‘turtle rising for breath’ in Hawaiian, is nearly twice as big as Mauna Loa.
“It has been proposed that hotspots that produce volcano chains like Hawai‘i undergo progressive cooling over 1-2 million years and then die,” said Michael Garcia, lead author of the study and retired professor of Earth Sciences at SOEST. “However, we have learned from this study that hotspots can undergo pulses of melt production. A small pulse created the Midway cluster of now extinct volcanoes and another, much bigger one created Pūhāhonu. This will rewrite the textbooks on how mantle plumes work.”
The lack of any sunspots suggests the current solar minimum is one of the ‘deepest’ in 100 years.
The sun has been reported to have a ‘very deep’ solar minimum with 100 days of 2020 not seeing any sunspots on its surface.
Astronomer Dr Tony Phillips says the current lack of sunspot counts suggests the current solar minimum is one of the ‘deepest’ of the past century.
A sunspot is an area of magnetic activity on the surface of the sun – also known as storms – and appear in areas of darkness. They play a huge part in the sun’s activity, including birthing solar flares and coronal mass ejections.
A solar minimum occurs when zero sunspots are spotted, but, before you start panicking and thinking this is a bad thing, solar minimums are all part of the sun’s cycle and occur every 11 years or so.
NASA first recorded no activity on the sun last summer and it is thought to have continued to be without sunspots ever since. Solar minimums usually consist of 12 months of little sunspot activity.
“The cause” of climate alarmism and forced energy transformation has been pushed backward by a very long overdue hard look at renewable energy as a mass substitute for mineral energies. Being dilute and intermittent, renewables have more bad secrets than any closet could hold. Small wonder; renewable energies chew up the earth’s surface and creatures in a way that leads to the joke:
Q. “When is an environmentalist not an environmentalist?” A. “When it comes to industrial wind turbines and solar farms.”
Moore’s Planet of the Humans all but ensures that DC-based Big Environmentalism will frontally reject biomass/biofuels, their loss-leader to try to prop up wind and solar as viable. Remove biomass from “green” portfolios and it gets a little skinnier for the business cronies.
And if Big Environmentalism loses wind, the supply-side ruse is over, and people will reconsider climate science given that the ‘cure’ is gone. Hence Michael Mann versus Michael Moore’s Planet of the Humans, the gist of Maxime Joselow’s “Michael Moore’s documentary irks climate scientists” (May 5, 2020).
Parts of the UK and US have suffered their lowest May temperatures on record of late, according to data from filthy warm-mongers&partners-in-crime the Met Office and NOAA.
While the official li(n)e coming out of these agencies is that our World Is On Fire, thermometer stations the length and breadth of both Europe and North America are telling a rather different story.
Overnight Wednesday (May 13-14), the mercury in Katesbridge and Castlederg, N. Ireland, plummeted to an extra-duvet-grabbing -6.1C (21F) and -3.9C (25F), respectively, as a wave of brutal Arctic air rode anomalously-far south on the back on a meridional (wavy) jet stream flow.
Wednesday night followed what had been a record-chilly day — a minimum temperature of -5C (23F)was observed in Tulloch Bridge, Scotland.
The wave of record cold actually engulfed much of Northern Europe overnight Wednesday, as visible in coolwx.com‘s temperature animation:
Almost a full two months after the season officially ended, winter reared its ugly head in much of the United States over the weekend. A winter-type Polar Vortex has caused record cold and extremely late season snow from the Rockies to the Atlantic Ocean. What’s responsible for this late season cold? If you listen to climate alarmists, the answer is simple: global warming.
In the Northeast, higher elevation areas reported snowfalls of up to 10 inches over the weekend. New York City received a trace of snow on May 9, tying the city’s record for the latest snowfall. In Islip, New York, a town of the southern shore of Long Island, the month of May was officially snowier than the month of February. Mother’s Day celebrations across the Midwest and Northeast were ruined by cold and windy conditions in the regions. Near record cold temperatures were reported from the Dakotas stretching down Texas and across most of the eastern United States.
Short summary: scientists sought political relevance and allowed policy makers to put a big thumb on the scale of the scientific assessment of the attribution of climate change.
The importance of this book is reflected in its acknowledgements, in context of assistance and contributions from early leaders and participants in the IPCC:
This book would not have been possible without the documents obtained via Mike MacCracken and John Zillman. Their abiding interest in a true and accurate presentation of the facts prevented my research from being led astray. Many of those who participated in the events here described gave generously of their time in responding to my enquiries, they include Ben Santer, Tim Barnett, Tom Wigley, John Houghton, Fred Singer, John Mitchell, Pat Michaels . . . and many more.
Read the whole book, it is well worth reading. The focus of my summary of the book is on Chapters 8-16 in context of the theme of ‘detection and attribution’, ‘policy cart in front of the scientific horse’ and ‘manufacturing consensus’. Annotated excerpts from the book are provided below.
by P. Homewood, May 10, 2020 in NotaLotofPeopleKnowThat
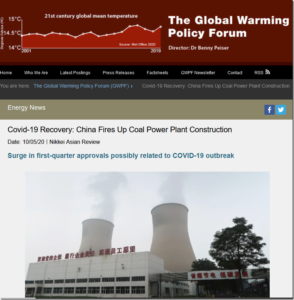
China approved nearly 10 gigawatts of new coal-fired power generation projects in the first quarter, roughly equal to the amount approved for all of last year, amid a broader scramble to jump-start an economy hobbled by the COVID-19 epidemic.
Investment in infrastructure like power generation has played an important part in China’s rapid economic rise, especially in times of economic distress like the global financial crisis of 2008 and 2009. Many expect such spending to play an important role as Beijing tries to restart the economy in the aftermath of the coronavirus outbreak that has brought activity to a crawl, causing the economy to post its first quarterly contraction since modern record-keeping began.
Coal has always been a controversial part of the nation’s power mix. On the one hand, China has plentiful supply of the resource, which it has harnessed to rapidly build up power infrastructure to feed the country’s growing economy. But such energy is notoriously dirty, and overly aggressive building led to oversupply earlier this decade that sent many producers into the red.
Those factors led the government to scale back and even halt many new coal-powered projects in recent years. But that trend went into reverse in the first quarter, when six major new coal-fired projects were approved that could add 9.96 GW of capacity, according to calculations by Caixin.
That was roughly equal to the amount of similar new power projects approved for all of last year. Of the new projects, four were in the coal-rich area of Shaanxi province, one was in South China’s Guangdong Province and one was in Inner Mongolia.
The lightness of water vapor buffers climate warming in the tropics.
Conventional knowledge has it that warm air rises while cold air sinks. But a study from the University of California, Davis, found that in the tropical atmosphere, cold air rises due to an overlooked effect — the lightness of water vapor. This effect helps to stabilize tropical climates and buffer some of the impacts of a warming climate.
The study, published today (May 6, 2020) in the journal Science Advances, is among the first to show the profound implications water vapor buoyancy has on Earth’s climate and energy balance.
Abstract
Moist air is lighter than dry air at the same temperature, pressure, and volume because the molecular weight of water is less than that of dry air. We call this the vapor buoyancy effect. Although this effect is well documented, its impact on Earth’s climate has been overlooked. Here, we show that the lightness of water vapor helps to stabilize tropical climate by increasing the outgoing longwave radiation (OLR). In the tropical atmosphere, buoyancy is horizontally uniform. Then, the vapor buoyancy in the moist regions must be balanced by warmer temperatures in the dry regions of the tropical atmosphere. These higher temperatures increase tropical OLR. This radiative effect increases with warming, leading to a negative climate feedback. At a near present-day surface temperature, vapor buoyancy is responsible for a radiative effect of 1 W/m2 and a negative climate feedback of about 0.15 W/m2 per kelvin.
This paper discusses the physical linkage between the surface and the atmosphere, and demonstrates how even slight changes in surface conditions can have a pronounced effect on weather and climate. Observational and modeling evidence are presented to demonstrate the influence of landscape type on the overlying atmospheric conditions. The albedo, and the fractional partitioning of atmospheric turbulent heat flux into sensible and latent fluxes is shown to be particularly important in directly affecting local and regional weather and climate. It is concluded that adequate assessment of global climate and climate change cannot be achieved unless mesoscale landscape characteristics and their changes over time can be accurately determined.
UPDATE: Changed emphasis from Northern Hemisphere extratropics to entire Northern Hemisphere (h/t John Christy)
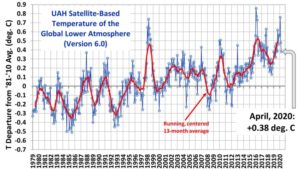
In April, 2020, the Northern Hemisphere experienced its 2nd largest 2-month drop in temperature in the 497-month satellite record.
The Version 6.0 global average lower tropospheric temperature (LT) anomaly for April, 2020 was +0.38 deg. C, down from the March, 2020 value of +0.48 deg. C.
The Northern Hemisphere temperature anomaly fell from +0.96 deg. C to 0.43 deg. C from February to April, a 0.53 deg. C drop which is the 2nd largest 2-month drop in the 497-month satellite record. The largest 2-month drop was -0.69 deg. C from December 1987 to February 1988.
The oldest bones of Homo sapiens ever found in Europe have been discovered in a Bulgarian cave, providing the earliest known evidence of our species’ emergence in the European continent, according to new research.
The appearance and spread of modern humans in Europe is a difficult timeline for researchers to reconstruct, owing to a scarcity of sufficiently ancient remains that have been identified in the fossil record.
When modern humans did show up, though, our arrival ultimately sealed the fate of the indigenous Neanderthals who called Europe home before us, as we then proceeded to swiftly replace them over the course of the next several thousand years.
Michael Moore has had enough of the modern green movement.
The Oscar-winning director made it official late last month by unleashing his new project, for free, on YouTube.
“The Planet of the Humans,” which Moore executive produced and shared via his Rumble Media platform, excoriates some of the green movement’s sacred cows:
Wind Energy
Solar Power
Electric Cars
Al Gore
The documentary shreds all of the above, albeit from a decidedly progressive perspective. Solar and wind, no matter how well-intentioned those who support them, can’t power the planet. Electric cars require fossil fuels, a non-starter for saving the world.
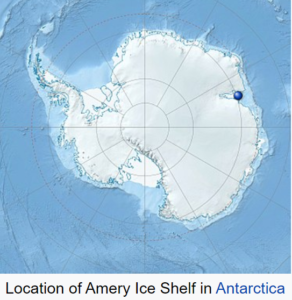
According to climate scientists, less dense meltwater on the surface of the Antarctic ocean reduced convection between the surface and ocean depths, leaving heat trapped in the depths.
A
…
Don’t you love climate science? When sea ice accumulates, scientists adjust the models until they get the right result. When the sea ice melts, well that is what you would expect from global warming.
Researchers at Purdue University in the US have developed a new technology that promises to be a game-changer in the extraction of rare earths.
THE GLOBAL MARKET OF RARE EARTH METALS HAS BEEN VALUED AT $4 BILLION PER YEAR BUT 70% OF THE PRODUCTION IS CONCENTRATED IN CHINA
In a paper published in the journal Green Chemistry, the scientists explain that the patented extraction and purifying processes use ligand-assisted chromatography and are shown to remove and purify rare earth metals from coal ash, recycled magnets and raw ore safely, efficiently and with virtually no detrimental environmental impact.
This is key because, at present, many companies across the world don’t even dare to consider extracting REE due to the damages caused to the environment by acid-based separation and purification of these elements.
“About 60% of rare earth metals are used in magnets that are needed in almost everyone’s daily lives. These metals are used in electronics, aeroplanes, hybrid cars and even windmills,” Nien-Hwa Linda Wang, whose lab developed the technology, said in a media statement. “We currently have one dominant foreign source for these metals and if the supply were to be limited for any reason, it would be devastating to people’s lives. It’s not that the resource isn’t available in the US, but that we need a better, cleaner way to process these rare earth metals.”
See also Two-zone ligand-assisted displacement chromatography for producing high-purity praseodymium, neodymium, and dysprosium with high yield and high productivity from crude mixtures derived from waste magnets (here)
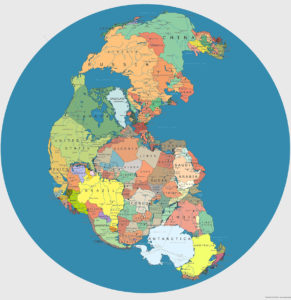
Although shallow magma storage at Erta Ale volcano hints at a rift-to-ridge transition, the tectonic future of the Afar region is far from certain.
Standing next to a lava lake at the summit of a massive volcano, Christopher Moore, a Ph.D. candidate at the School of Earth and Environment at the University of Leeds in the United Kingdom, could see the red haze of lava flows a few kilometers away. This might seem like a rare sight, but at Ethiopia’s Erta Ale, it’s business as usual.
Are such behaviors the first signs of a tectonic transition? This question is part of what Moore has been studying at Erta Ale. The entire Afar region in eastern Africa finds itself in the middle of changes that could split the continent, forming a new ocean basin. The magmatism at Erta Ale might be offering signs of this switch by mimicking the characteristics of a mid-ocean ridge.
The East African Rift valley, the Red Sea, and the Gulf of Aden are clearly visible in this Landsat 8 image, taken on 8 November 2019. Credit: NASA/Erik Klemetti
However, there isn’t agreement about how close the Afar region is to this tectonic transition. The geophysical characteristics of magma storage at Erta Ale could point to the region’s conversion to an incipient oceanic spreading center, but the petrology of the erupting lava might be telling us that we aren’t there yet.
UPDATE: Changed emphasis from Northern Hemisphere extratropics to entire Northern Hemisphere (h/t John Christy)
In April, 2020, the Northern Hemisphere experienced its 2nd largest 2-month drop in temperature in the 497-month satellite record.
The Version 6.0 global average lower tropospheric temperature (LT) anomaly for April, 2020 was +0.38 deg. C, down from the March, 2020 value of +0.48 deg. C.
The Northern Hemisphere temperature anomaly fell from +0.96 deg. C to 0.43 deg. C from February to April, a 0.53 deg. C drop which is the 2nd largest 2-month drop in the 497-month satellite record. The largest 2-month drop was -0.69 deg. C from December 1987 to February 1988.
The linear warming trend since January, 1979 has now increased to +0.14 C/decade (but remains statistically unchanged at +0.12 C/decade over the global-averaged oceans, and +0.18 C/decade over global-averaged land).
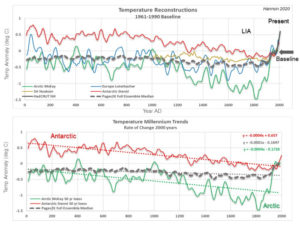
There have been recent discussions about ‘flattening the curve’ and some curves are easier to flatten than others. The Pages 2K Consortium calculates global mean temperature in a manner that flattens the long-term trend and makes present day temperatures appear warmer relative to past temperatures. Across the globe, temperature reconstructions show cooling millennial temperature trends with one exception, the Pages 2K global mean.
Millennial Temperature Trends Show Global Cooling
Global mean surface temperature anomalies were recently calculated by the Pages 2K Consortium led by Nuekom, 2019. Their statistical means are a conglomeration of seven different averaging methods for 7000 proxy records over the past 2000 years. The median across all global mean methods is plotted as a dashed line in Figure 1 and compared to Pages 2K’s published regional reconstructions. All means demonstrate similar trends as the median and will be simply be referred to as the global mean(s).
Regional temperature reconstructions are chosen that utilize similar proxy datasets used in the global mean calculation. The Arctic reconstruction by McKay incorporates a balance of proxy records consisting of ice cores, tree rings, lake and marine sediments north of 60 deg N. The Northern Hemisphere (NH) European reconstruction by Luterbacher is tree ring proxy based. And Stenni’s Antarctic reconstruction uses predominantly ice core isotopes.
The Pages 2K global mean appears to be reasonable compared to regional reconstructions from Present through the Little Ice Age (LIA) until about 1250 AD. Although it is difficult to see how the mean compares to regional reconstructions during the Present when using a 1961-1990 baseline as all reconstructions converge creating the “hockey stick” effect. Pre-1250 AD, the global mean appears to parallel NH Europe temperatures largely ignoring the Antarctic.
Figure 1: Top graph are surface temperature reconstructions with a 50-year loess filter plotted with Pages 2K global mean of the 7000-member ensemble across all methods. Bottom graph shows linear trends over the past 2000 years.
The Temperature of the Global Lower Atmosphere plunged 0.38C through March and April, halving its February above baseline high of 0.76C to 0.38C — the second-largest two-month drop in the UAH temperature dataset.
The largest two month drop remains the 0.69C observed back in 1987. And note how the global average temperature back in 1987 –before both the drop AND the inception of the global warming scare— is EXACTLY the same as it is now:
A continuation of this sharp downward plunge (seen in March and April, 2020) is highly probable over the coming months (with the odd bump on the way), and we can now consider a reading below baseline by the end of the year “likely”.
For a more in-depth look at the data check out this video from the Oppenheimer Ranch Project:
The northern hemisphere surface temperature was expected to drop substantiallyaccording to NCEP, but this of course will not keep global warming alarmists from sounding the warming alarms.
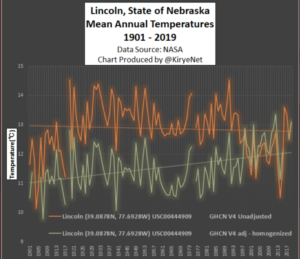
But a look at the unadjusted data from some rural US stations tells us that there has been no warming.
Today we look at temperature data from NASA of some stations along the northern US with a Brightness Index (BI) of 0, meaning rural locations with no urban heat island effects. We want to see the trend over the past 100 or so years.
Plotted are the USHCN Version 4 versus Version 4 adjusted.
The first plots are the data from Lincoln, Nebraska going back to 1901:
Note how a modest cooling trend was changed to a warming trend. Very ealy temperatures were cooled by 2°C!
Next we move to the Livingston, Montana station, where here as well a modest cooling trend was transformed into warming by massively adjusting past temperatures downward also by more than 2°C:
by P. Homewood, May 2, 2020 in NotaLotofPeopleKnowThat
A
…
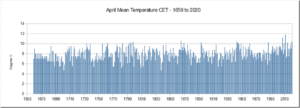
In other words, all we have had is “weather”, and of the type we have had plenty of times in the past.
What has made the month much warmer than average is the persistence of this weather. Indeed this has been the pattern all year, with daily temperatures consistently above average, but within the normal band.
Inland waters such as rivers, lakes, and reservoirs play an important role in the global carbon cycle.
Calculations that scale up the carbon dioxide emissions from land and water surface areas do not take account of inland waters that dry out intermittently.
This means that the actual emissions from inland waters have been significantly underestimated—as shown by the results of a recent international research project led by scientists at the Helmholtz Centre for Environmental Research (UFZ) in Magdeburg and the Catalan Institute for Water Research (ICRA).
The study was published in Nature Communications.
“The interaction of local conditions like temperature, moisture, and the organic matter content of the sediments is crucial, and it has a bigger influence than regional climate conditions,” Keller explains.
So what do the results of the study mean for the future assessment of carbon dioxide emissions from inland waters? “Our study shows that carbon dioxide emissions from inland waters have been significantly underestimated up until now,” says Koschorreck.
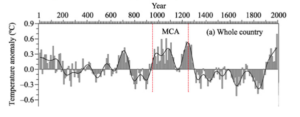
For China as a whole, the longest warm period during the last 2000 years occurred in the 10th–13th centuries’
Abstract: The Medieval Climate Anomaly (MCA, AD950-1250) is the most recent warm period lasting for several hundred years and is regarded as a reference scenario when studying the impact of and adaptation to global and regional warming. In this study, we investigated the characteristics of temperature variations on decadal-centennial scales during the MCA for four regions (Northeast, Northwest, Central-east, and Tibetan Plateau) in China, based on high-resolution temperature reconstructions and related warm-cold records from historical documents. The ensemble empirical mode decomposition method is used to analyze the time series. The results showed that for China as a whole, the longest warm period during the last 2000 years occurred in the 10th–13th centuries, although there were multi-decadal cold intervals in the middle to late 12th century. However, in the beginning and ending decades, warm peaks and phases on the decadal scale of the MCA for different regions were not consistent with each other. On the inter-decadal scale, regional temperature variations were similar from 950 to 1130; moreover, their amplitudes became smaller, and the phases did not agree well from 1130 to 1250. On the multi-decadal to centennial scale, all four regions began to warm in the early 10th century and experienced two cold intervals during the MCA. However, the Northwest and Central-east China were in step with each other while the warm periods in the Northeast China and Tibetan Plateau ended about 40–50 years earlier. On the multi-centennial scale, the mean temperature difference between the MCA and Little Ice Age was significant in Northeast and Central-east China but not in the Northwest China and Tibetan Plateau. Compared to the mean temperature of the 20th century, a comparable warmth in the MCA was found in the Central-east China, but there was a little cooling in Northeast China; meanwhile, there were significantly lower temperatures in Northwest China and Tibetan Plateau.
La géologie, une science plus que passionnante … et diverse