by P. Homewood, Sep 23, 2022 in ClimateChangeDispatch
For years the ‘experts’ have been telling us that the Arctic would soon be ice-free in summer.
Al Gore notoriously warned us in 2009 that ‘there is a 75 percent chance that the entire north polar ice cap, during the summer months, could be completely ice-free within five to seven years.’
He was, of course, just a politician. But a whole host of supposed Arctic scientists were all busy issuing similar warnings at the time. [bold, links added]
In 2007, for instance, Professor Wieslaw Maslowski told us that northern polar waters could be ice-free in summers within just five to six years.
In December of that year, Jay Zwally of Nasa agreed, giving the ice till 2012. A year later, in 2008 Professor David Barber went one step further, saying the ice would all be gone that very summer.
For sheer persistence in getting it wrong, however, the prize must go to Peter Wadhams, professor and head of the Polar Ocean Physics Group in the Department of Applied Mathematics and Theoretical Physics at the University of Cambridge:
…
• In 2012, he predicted that the Arctic would be ice-free by 2015/16.
• In 2014, he thought it might last till 2020.
• In 2016, he confidently predicted the Arctic would be ice-free that summer (though curiously he now defined ‘ice-free’ as less than 1 million square kilometers).
All these pronouncements were designed for political propaganda purposes, not for scientific reasons, and were widely propagated by the gullible media.
…
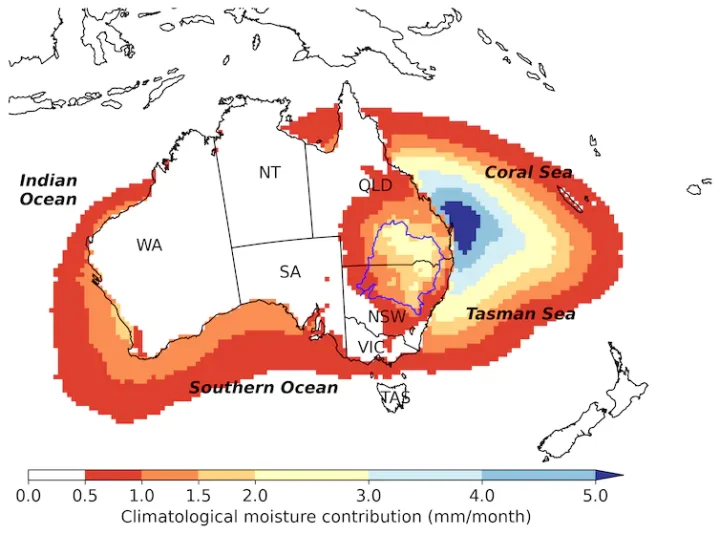 Sources of moisture in eastern Australia. Source: Holgate et al, 2020…